![]()
![]()
|
Coffee production1 |
|||
|
|
1996-98 |
1999 |
2000 |
|
‘000 tonnes |
|||
|
World total |
6 095 |
6 878 |
6 630 |
|
Brazil |
1 699 |
1 941 |
1 920 |
|
Colombia |
684 |
560 |
720 |
|
Guatemala |
273 |
312 |
270 |
|
Mexico |
308 |
387 |
270 |
|
Côte d'Ivoire |
205 |
354 |
190 |
|
Ethiopia |
179 |
210 |
221 |
|
Kenya |
66 |
90 |
101 |
|
Uganda |
203 |
186 |
192 |
|
Indonesia |
490 |
326 |
400 |
|
Viet Nam |
391 |
699 |
700 |
1 Production of green beans in crop year beginning in the year shown.
|
Coffee exports1 |
|||
|
|
1996-98 |
1999 |
2000 |
|
‘000 tonnes |
|||
|
World total |
4 737 |
5 113 |
5 334 |
|
Brazil |
1 006 |
1 388 |
1 082 |
|
Colombia |
655 |
600 |
551 |
|
Guatemala |
235 |
281 |
291 |
|
Mexico |
251 |
261 |
318 |
|
Côte d'Ivoire |
219 |
132 |
355 |
|
Ethiopia |
115 |
109 |
119 |
|
Kenya |
78 |
67 |
79 |
|
Uganda |
229 |
230 |
151 |
|
Indonesia |
356 |
304 |
312 |
|
Viet Nam |
328 |
465 |
696 |
1 Green beans only.
|
Coffee stocks1 |
|||
|
|
1996-98 |
1999 |
2000 |
|
‘000 tonnes |
|||
|
Producing countries2 |
1 768 |
1 408 |
1 322 |
|
Brazil |
842 |
709 |
614 |
|
Colombia |
290 |
192 |
126 |
|
Ethiopia |
223 |
223 |
144 |
|
Uganda |
76 |
76 |
30 |
|
Consuming countries |
492 |
492 |
978 |
|
United States |
83 |
83 |
336 |
|
EC 4/ |
118 |
118 |
132 |
|
Japan |
56 |
56 |
84 |
|
Other countries |
16 |
16 |
18 |
1 Green beans only.2 Stocks at the beginning of the marketing year.
3 Stocks at the end of the calendar year (including those in Free Ports) in importing member countries of ICO.
4 Excludes Greece and Ireland.
|
Coffee imports1 |
|||
|
|
1996-98 |
1999 |
2000 |
|
‘000 tonnes |
|||
|
World total 2 |
4 475 |
4 755 |
4 818 |
|
United States |
1 217 |
1 367 |
1 430 |
|
Canada |
137 |
138 |
139 |
|
EC |
2 731 |
2 820 |
2 803 |
|
Poland |
117 |
106 |
106 |
|
Russia Federation |
88 |
77 |
77 |
|
Algeria |
82 |
71 |
71 |
|
Korea, Rep. |
60 |
65 |
65 |
|
Japan |
365 |
397 |
419 |
|
Australia |
48 |
54 |
55 |
1 Green beans only.
2 Excluding quantities subsequently re-exported.
|
Coffee prices1 |
||||
|
|
1996-98 |
1999 |
2000 |
2001* |
|
US cents/lb |
||||
|
Brazilian natural Arabicas2 |
136.13 |
88.84 |
79.86 |
52.34 |
|
Colombian milds Arabicas2 |
157.66 |
116.45 |
102.60 |
73.74 |
|
Other milds Arabicas3 |
148.83 |
103.90 |
87.07 |
63.18 |
|
Robustas 4 |
81.11 |
67.53 |
41.41 |
28.25 |
|
ICO Composite price |
114.98 |
85.72 |
64.25 |
45.96 |
Source: ICOWORLD COFFEE PRODUCTION - '000 tonnes1 ICO indicator price.
2 New York Market.
3 Weighted average of New York and Bremen/Hamburg markets.
4 Weighted average of New York and Le Havre/Marseilles markets.
* January-October average.
WORLD COFFEE EXPORTS - '000 tonnes
|
Cocoa production |
|||
|
|
1996-98 |
1999/00 |
2000/01 |
|
‘000 tonnes |
|||
|
World total |
2 737 |
3 061 |
2 836 |
|
Brazil |
164 |
124 |
138 |
|
Dominican Republic |
49 |
35 |
45 |
|
Ecuador |
69 |
95 |
100 |
|
Cameroon |
121 |
115 |
120 |
|
Côte d'Ivoire |
1 128 |
1 400 |
1 170 |
|
Ghana |
377 |
437 |
410 |
|
Nigeria |
174 |
165 |
170 |
|
Indonesia |
349 |
410 |
405 |
|
Malaysia |
80 |
45 |
40 |
|
Cocoa exports |
||
|
|
1996-98 |
1999/00 |
|
‘000 tonnes |
||
|
World total 1 |
2 028 |
2 496 |
|
Brazil |
8 |
2 |
|
Dominican Republic |
38 |
29 |
|
Ecuador |
37 |
48 |
|
Cameroon |
90 |
84 |
|
Côte d'Ivoire |
991 |
1373 |
|
Ghana |
313 |
360 |
|
Nigeria |
145 |
143 |
|
Indonesia |
280 |
339 |
|
Malaysia |
25 |
10 |
1 Excluding re-exports.
|
Cocoa stocks |
|||
|
|
1996-98 |
1999/00 |
2000/01 |
|
‘000 tonnes |
|||
|
World total |
1 288 |
1 332 |
1 132 |
|
ICCO buffer stocks |
26 |
|
|
Source: ICCO.
|
Cocoa imports1 |
||
|
|
1996-98 |
1999/00 |
|
‘000 tonnes |
||
|
World total2 |
2 188 |
2 471 |
|
United States |
403 |
521 |
|
Canada |
43 |
56 |
|
EC |
1 215 |
1 226 |
|
Poland |
36 |
32 |
|
Czech Republic |
12 |
10 |
|
Area of former USSR |
134 |
149 |
|
China |
28 |
29 |
|
Japan |
48 |
48 |
|
Philippines |
8 |
5 |
|
Singapore |
87 |
99 |
1 Excluding re-exports.
|
Grindings |
|||
|
|
1996-98 |
1999/00 |
2000/01 |
|
‘000 tonnes |
|||
|
World total |
2 747 |
2 964 |
3 008 |
|
EC |
1 135 |
1 183 |
1 202 |
|
Former USSR |
80 |
93 |
104 |
|
Côte d'Ivoire |
189 |
235 |
265 |
|
Ghana |
67 |
70 |
70 |
|
Brazil |
187 |
201 |
198 |
|
Colombia |
38 |
37 |
38 |
|
Canada |
43 |
56 |
50 |
|
United States |
400 |
439 |
440 |
|
Indonesia |
74 |
85 |
75 |
|
Malaysia |
100 |
115 |
110 |
|
Cocoa prices |
|||||
|
|
1996-98 |
1999 |
2000 |
2001 |
|
|
ICCO daily |
|||||
|
|
$/tonne |
1 583 |
1 140 |
888 |
1 058* |
|
|
cents/lb |
72 |
52 |
40 |
48* |
|
Ghana, spot London |
|||||
|
|
£stg/tonne |
1 032 |
744 |
619 |
780** |
|
|
$/tonne |
1 672 |
1 204 |
938 |
1 121** |
* January-October.
** January-June.
|
Cocoa - re-exports |
||
|
|
1996-98 |
1999/00 |
|
‘000 tonnes |
||
|
World total |
208 |
255 |
|
EC |
108 |
140 |
|
Estonia |
52 |
56 |
|
United States |
20 |
21 |
|
Singapore |
133 |
37 |
WORLD COCOA EXPORTS - Thousand Metric Tonnes
|
Tea production |
|||
|
|
1996-98 |
1999 |
2000 |
|
‘000 tonnes |
|||
|
World total |
2 811 |
2 897 |
2 972 |
|
Bangladesh |
54 |
47 |
52 |
|
China |
647 |
699 |
700 |
|
India |
820 |
806 |
846 |
|
Indonesia |
162 |
165 |
159 |
|
Sri Lanka |
272 |
284 |
308 |
|
Kenya |
257 |
249 |
236 |
|
Malawi |
41 |
39 |
42 |
|
Tanzania |
22 |
24 |
24 |
|
Argentina |
53 |
57 |
57 |
|
Japan |
88 |
89 |
89 |
|
Tea exports |
|||
|
|
1996-98 |
1999 |
2000 |
|
‘000 tonnes |
|||
|
World total 1 |
1 208 |
1 253 |
1 315 |
|
Bangladesh |
25 |
15 |
18 |
|
China |
200 |
203 |
231 |
|
India |
190 |
192 |
201 |
|
Indonesia |
79 |
98 |
106 |
|
Sri Lanka |
252 |
264 |
281 |
|
Kenya |
235 |
242 |
217 |
|
Malawi |
42 |
43 |
38 |
|
Tanzania |
20 |
21 |
23 |
|
Zimbabwe |
12 |
15 |
17 |
|
Argentina |
52 |
52 |
47 |
1 Excluding re-exports
|
Black tea prices |
||||
|
|
1996-98 |
1999 |
2000 |
2001* |
|
national currency/kg |
||||
|
Average auction prices |
||||
|
Colombo (rupees) |
119 |
115 |
135 |
142 |
|
Calcutta (rupees) |
74 |
87 |
79 |
79 |
|
Cochin (rupees) |
60 |
63 |
52 |
53 |
|
|
US cents/kg1 |
|||
|
Colombo 2 |
200 |
163 |
176 |
160 |
|
Calcutta |
194 |
201 |
176 |
169 |
|
Cochin |
158 |
146 |
116 |
114 |
|
Mombasa |
177 |
178 |
202 |
155 |
|
FAO composite price 3 |
189 |
174 |
180 |
159 |
1 Converted monthly on the basis of average exchange rates reported by IMF.
2 Including export duties.
3 Weighted average of the four series shown.
* January-October 2001.
|
Tea imports |
|||
|
|
1996-98 |
1999 |
2000 |
|
‘000 tonnes |
|||
|
World total 1 |
1 180 |
1 202 |
1 264 |
|
EC |
227 |
209 |
203 |
|
Area of the former USSR/CIS 2 |
193 |
224 |
223 |
|
United States |
89 |
100 |
88 |
|
Australia |
16 |
14 |
15 |
|
Japan |
49 |
49 |
58 |
|
Iran, Islamic Rep. of |
29 |
30 |
38 |
|
Syria |
18 |
20 |
20 |
|
Egypt |
72 |
73 |
63 |
|
Morocco |
35 |
35 |
42 |
|
Pakistan |
108 |
108 |
111 |
1 Excluding re-exports.WORLD TEA PRODUCTION - Thousand Metric Tonnes
2 Including Russian Federation.
WORLD TEA EXPORT - Thousand Metric Tonnes
|
Sugar production |
||||
|
|
1996/97-1998/99 |
1999/00 |
2000/01 |
2001/02* |
|
Million tonnes, raw value |
||||
|
World total |
127.2 |
135.8 |
129.4 |
131.0 |
|
India |
14.9 |
19.5 |
19.5 |
18.7 |
|
EC |
18.3 |
19.1 |
18.2 |
15.9 |
|
Brazil |
17.1 |
19.8 |
17.3 |
19.1 |
|
China |
8.5 |
8.2 |
7.2 |
8.3 |
|
United States |
7.1 |
8.2 |
7.7 |
7.5 |
|
Thailand |
5.3 |
5.7 |
5.4 |
5.6 |
|
Mexico |
5.1 |
5.1 |
4.9 |
5.0 |
|
Australia |
5.5 |
5.5 |
4.4 |
4.8 |
|
Cuba |
3.7 |
4.0 |
3.5 |
3.8 |
|
Pakistan |
3.3 |
2.7 |
2.6 |
2.9 |
|
South Africa |
2.5 |
2.5 |
2.8 |
2.8 |
|
Others |
36.0 |
35.5 |
36.0 |
36.7 |
* Forecast.
|
Sugar exports |
|||
|
|
1996-98 |
1999 |
2000 |
|
Million tonnes, raw value |
|||
|
World total 1 |
38.1 |
41.8 |
40.8 |
|
Brazil |
6.9 |
12.5 |
8.8 |
|
EC 2 |
7.8 |
7.8 |
7.9 |
|
Australia |
4.3 |
4.2 |
4.0 |
|
Thailand |
3.7 |
3.4 |
3.9 |
|
Cuba |
3.3 |
2.6 |
3.4 |
|
South Africa |
1.0 |
1.1 |
1.3 |
|
Guatemala |
1.1 |
1.1 |
1.2 |
|
Mauritius |
0.6 |
0.5 |
0.4 |
|
Colombia |
0.9 |
1.0 |
1.0 |
|
Mexico |
0.9 |
0.5 |
0.3 |
|
Others |
7.7 |
7.1 |
8.5 |
1 Calendar year.
2 Including intra-EC trade.
|
Sugar - closing stocks |
||||
|
|
1998/99 |
1999/00 |
2000/01 |
2001/02* |
|
Million tonnes, raw value |
||||
|
World total |
50.5 |
60.6 |
59.3 |
57.5 |
|
EC |
5.8 |
6.9 |
6.5 |
6.3 |
|
India |
8.1 |
11.4 |
11.7 |
11.4 |
|
Brazil |
4.1 |
5.0 |
3.6 |
3.1 |
|
Russian Federation |
1.6 |
2.5 |
2.7 |
2.5 |
|
China |
2.3 |
1.9 |
1.0 |
0.8 |
|
Indonesia |
2.2 |
2.6 |
2.4 |
2.1 |
|
United States |
1.7 |
2.2 |
2.3 |
1.9 |
|
Others |
24.6 |
28.1 |
29.1 |
29.4 |
* Forecast.
|
Sugar imports |
|||
|
|
1996-98 |
1999 |
2000 |
|
Million tonnes, raw value |
|||
|
World total 1 |
35.3 |
39.8 |
38.9 |
|
EC 2 |
4.0 |
4.3 |
4.7 |
|
Russian Federation |
3.6 |
5.9 |
5.2 |
|
United States |
2.6 |
1.7 |
1.4 |
|
Japan |
1.6 |
1.5 |
1.5 |
|
Korea Rep. |
1.4 |
1.4 |
1.5 |
|
China |
0.8 |
0.4 |
0.6 |
|
Canada |
1.1 |
0.8 |
1.1 |
|
Malaysia |
1.2 |
1.2 |
1.2 |
|
Iran, Islamic Republic |
1.0 |
1.2 |
1.0 |
|
Egypt |
1.1 |
1.2 |
1.0 |
|
Others |
16.8 |
20.1 |
19.6 |
1 Calendar year.
2 Including intra-EC trade.
|
Sugar prices |
||||||||
|
|
1997 |
1998 |
1999 |
2000 |
2001 |
2001 |
2001 |
2001 |
|
US cents/lb (450g) |
||||||||
|
ISA daily price |
11.37 |
8.92 |
6.27 |
8.18 |
9.82 |
9.12 |
8.22 |
7.17 |
World sugar exports 1991-2000 - (million tonnes, raw value)
|
Banana exports1 |
||||
|
|
1995-97 |
1998 |
1999 |
2000 * |
|
‘000 tonnes |
||||
|
World |
11 741 |
11 671 |
11 718 |
11 070 |
|
Ecuador |
4 011 |
3 848 |
3 865 |
3 932 |
|
Costa Rica |
1 934 |
2 101 |
2 113 |
1 814 |
|
Colombia |
1 417 |
1 436 |
1 650 |
1 506 |
|
Philippines |
1 213 |
1 150 |
1 320 |
1 418 |
|
Panama |
643 |
463 |
593 |
538 |
|
Guatemala |
635 |
794 |
680 |
527 |
|
Honduras |
572 |
502 |
109 |
150 |
|
Côte d'Ivoire |
185 |
193 |
219 |
220 |
|
Cameroon |
172 |
132 |
162 |
|
|
Former Windward Islands |
175 |
143 |
134 |
141 |
* Estimate.
|
Banana imports1 |
||||
|
|
1995-97 |
1998 |
1999 |
2000 * |
|
‘000 tonnes |
||||
|
World |
10 914 |
11 117 |
11 951 |
12 086 |
|
United States |
3 329 |
3 497 |
3 876 |
3 700 |
|
European Union |
3 142 |
2 982 |
3 197 |
3 285 |
|
Japan |
859 |
865 |
983 |
1 079 |
|
Area of former USSR |
675 |
608 |
518 |
535 |
|
China |
407 |
539 |
432 |
508** |
|
Canada |
408 |
416 |
419 |
420 |
|
Argentina |
223 |
243 |
294 |
294 |
|
Poland |
236 |
277 |
348 |
348 |
|
Czech Republic |
146 |
115 |
129 |
131 |
|
Korea Rep. |
144 |
143 |
155 |
155 |
* Estimate.
**Jan-Aug
|
Banana import prices |
||||||||
|
|
1995-97 |
1998 |
1999 |
2000 |
2001 |
2001 |
2001 |
|
|
national currency/kg |
||||||||
|
France (francs) |
3.8 |
4.5 |
3.6 |
3.3 |
4.0 |
|
|
(Jan-Feb.) |
|
Germany (DM) |
1.6 |
1.8 |
1.6 |
1.6 |
1.9 |
1.9 |
1.6 |
(July) |
|
United States (US cents) |
47.9 |
49.1 |
41.6 |
42.4 |
58.8 |
59.9 |
69.8 |
(July) |
|
Japan (yen) |
50.6 |
65.8 |
59.9 |
51.6 |
48.2 |
54.0 |
|
(April) |
|
Production of tropical fruits |
|||
|
|
1996-98 |
1999 |
2000 |
|
‘000 tonnes |
|||
|
MAJOR FRUITS |
43 656 |
45 683 |
46 561 |
|
Mangoes |
21 946 |
21 939 |
22 367 |
|
India |
10 316 |
9 782 |
10 000 |
|
China |
2 093 |
2 127 |
2 375 |
|
Mexico |
1 388 |
1 450 |
1 529 |
|
Pineapples |
12 339 |
13 171 |
13 436 |
|
Thailand |
1 950 |
2 331 |
2 281 |
|
Philippines |
1 534 |
1 519 |
1 524 |
|
Brazil |
1 263 |
1 161 |
1 340 |
|
Avocados |
2 188 |
2 195 |
2 331 |
|
Mexico |
814 |
807 |
939 |
|
United States |
160 |
165 |
165 |
|
Indonesia |
129 |
115 |
122 |
|
Papaya |
7 183 |
8 378 |
8 426 |
|
Brazil |
2 691 |
3 300 |
3 300 |
|
India |
1 404 |
1 582 |
1 582 |
|
Nigeria |
642 |
751 |
748 |
|
MINOR FRUITS 1 |
14 194 |
14 781 |
14 887 |
|
India |
3 833 |
4 460 |
4 460 |
|
Philippines |
3 289 |
2 935 |
2 935 |
|
Indonesia |
1 364 |
1 300 |
1 300 |
|
TOTAL PRODUCTION |
57 850 |
60 464 |
61 447 |
1 Including durian, longan, passion fruit, rambutan etc.
|
Exports of fresh tropical fruits |
|||
|
|
1996-98 |
1999 |
2000 |
|
‘000 tonnes |
|||
|
MAJOR FRUITS |
1 425 |
1 638 |
1 687 |
|
Mangoes |
416 |
452 |
440 |
|
Mexico |
155 |
135 |
125 |
|
Brazil |
29 |
54 |
54 |
|
India |
40 |
50 |
50 |
|
Pineapples |
719 |
856 |
868 |
|
Costa Rica |
243 |
360 |
360 |
|
Côte d'Ivoire |
180 |
210 |
210 |
|
Philippines |
136 |
130 |
135 |
|
Avocados |
177 |
202 |
228 |
|
Chile |
26 |
35 |
55 |
|
Mexico |
56 |
55 |
52 |
|
South Africa |
34 |
35 |
46 |
|
Papaya |
114 |
128 |
151 |
|
Mexico |
46 |
51 |
57 |
|
Malaysia |
36 |
44 |
45 |
|
Brazil |
8 |
11 |
22 |
|
MINOR FRUITS |
133 |
180 |
185 |
|
Malaysia |
52 |
45 |
52 |
|
United States |
24 |
23 |
28 |
|
Kenya |
10 |
8 |
11 |
|
TOTAL EXPORTS |
1 558 |
1 818 |
1 872 |
|
Imports of fresh tropical fruits |
|||
|
|
1996-98 |
1999 |
2000 |
|
‘000 tonnes |
|||
|
MAJOR FRUITS |
1 442 |
1 705 |
1 802 |
|
Mangoes |
413 |
494 |
514 |
|
United States |
185 |
219 |
235 |
|
EC |
75 |
116 |
119 |
|
China, Hong Kong SAR |
40 |
33 |
33 |
|
Pineapples |
727 |
881 |
904 |
|
United States |
197 |
283 |
319 |
|
EC |
273 |
333 |
317 |
|
Japan |
92 |
90 |
90 |
|
Avocados |
194 |
199 |
241 |
|
EC |
102 |
89 |
89 |
|
United States |
38 |
55 |
79 |
|
Canada |
10 |
12 |
13 |
|
Papaya |
108 |
132 |
143 |
|
United States |
51 |
67 |
70 |
|
Singapore |
21 |
25 |
25 |
|
China, Hong Kong SAR |
12 |
14 |
15 |
|
MINOR FRUITS |
156 |
145 |
176 |
|
Singapore |
59 |
55 |
67 |
|
Malaysia |
30 |
15 |
37 |
|
Canada |
24 |
27 |
31 |
|
TOTAL IMPORTS |
1 598 |
1 850 |
1 978 |
World Exports of Major Tropical Fruits 1991-2000 - ( '000 tonnes )
|
Citrus production |
||||
|
|
1995/96- 1997/98 |
1998/99 |
1999/00 |
2000-2001* |
|
‘000 tonnes |
||||
|
World total |
86 919 |
80 808 |
90 875 |
89 339 |
|
Brazil 1 |
18 797 |
17 662 |
19702 |
17 907 |
|
United States |
15 279 |
12 334 |
15 644 |
14 756 |
|
China |
8 338 |
8 096 |
10 180 |
8 511 |
|
Spain |
4 994 |
5 265 |
5 625 |
5 401 |
|
Mexico |
5 175 |
4 543 |
5 015 |
5 140 |
|
Italy |
3 318 |
2 373 |
3 215 |
3 144 |
|
Egypt |
2 434 |
2 410 |
2 498 |
2 508 |
|
Argentina |
2 342 |
2 227 |
2 581 |
2 632 |
|
Japan |
1 741 |
1 597 |
1 817 |
1 487 |
|
Turkey |
1 612 |
1 597 |
1 826 |
1 532 |
|
Others |
22 887 |
22 704 |
22 772 |
26 322 |
1 Marketing year (harvest in first year shown).
* Estimate.
|
Citrus exports |
||||
|
|
1995/96- 1997/98 |
1998/99 |
1999/00 |
2000-2001* |
|
‘000 tonnes |
||||
|
World total |
9 438 |
9 005 |
9 478 |
9 518 |
|
Spain |
2 783 |
2 793 |
3 221 |
2 859 |
|
United States |
1 189 |
802 |
1 046 |
1 172 |
|
South Africa |
651 |
722 |
691 |
820 |
|
Morocco |
581 |
583 |
597 |
393 |
|
Greece |
410 |
309 |
322 |
423 |
|
Argentina |
324 |
326 |
289 |
283 |
|
Israel |
331 |
255 |
220 |
199 |
|
Egypt |
253 |
231 |
227 |
226 |
|
Turkey |
306 |
456 |
490 |
499 |
|
Italy |
197 |
112 |
212 |
225 |
|
Others |
2 413 |
2 416 |
2 163 |
2 418 |
* Estimate.
|
Citrus prices (wholesale)1 |
|||||
|
|
1995/96 |
1996/97 |
1997/98 |
1998/99 |
1999/00 |
|
national currency/kg |
|||||
|
ORANGES AND TANGERINES |
|
|
|
|
|
|
France (francs) |
|
|
|
|
|
|
Spain oranges |
3.73 |
3.43 |
3.18 |
3.46 |
2.94 |
|
Moroccan clementines |
5.66 |
4.89 |
4.75 |
5.50 |
3.88 |
|
Germany (DM) |
|
|
|
|
|
|
Spanish navels |
1.46 |
1.43 |
1.38 |
1.53 |
1.27 |
|
Spanish clementines |
2.25 |
2.16 |
1.97 |
2.09 |
2.04 |
|
United States (cents) |
|
|
|
|
|
|
California navels |
66.48 |
65.58 |
90.06 |
132.19 |
68.11 |
|
Japan (yen) |
|
|
|
|
|
|
Mikan |
193.00 |
254.60 |
151.86 |
299.57 |
123.7 |
|
LEMONS |
|
|
|
|
|
|
United States (cents) |
|
|
|
|
|
|
California |
100.84 |
109.80 |
137.15 |
186.71 |
94.6 |
|
Germany (DM) |
|
|
|
|
|
|
Spanish |
1.85 |
1.52 |
1.42 |
1.58 |
1.61 |
|
Japan (yen) |
|
|
|
|
|
|
Average |
181.44 |
293.58 |
269.17 |
264.08 |
237.1 |
|
GRAPEFRUIT |
|
|
|
|
|
|
United States (cents) 1 |
|
|
|
|
|
|
Florida, seedless |
55.39 |
40.33 |
38.75 |
52.37 |
n.a. |
1 United States prices in calendar year, for the second year shown.
|
Citrus imports 1 |
|||
|
|
1995/96- 1997/98 |
1998/99 |
1999/00* |
|
‘000 tonnes |
|||
|
World total |
8 838 |
8 464 |
9 060 |
|
Germany |
1 188 |
1 040 |
1 374 |
|
France |
1 040 |
975 |
1 119 |
|
United Kingdom |
621 |
704 |
725 |
|
Netherlands |
710 |
790 |
727 |
|
Japan |
500 |
428 |
491 |
|
Canada |
408 |
345 |
|
|
Belgium-Luxembourg |
449 |
419 |
458 |
|
China, Hong Kong SAR 1 |
304 |
229 |
|
|
Poland 1 |
322 |
347 |
155** |
|
Area of former USSR 1 |
682 |
539 |
268** |
|
Others |
2 613 |
2 648 |
|
1 Calendar year, second part of the split yearWorld Citrus Production
* Estimate
** Jan-Jun 2000
|
Rice production (paddy) 1 |
||||
|
|
1996-98 |
1999 |
2000 |
2001 |
|
Million tonnes |
||||
|
World total |
578.2 |
612.0 |
595.7 |
586.8 |
|
Bangladesh |
28.8 |
34.6 |
36.5 |
36.6 |
|
Brazil |
9.3 |
11.6 |
11.4 |
10.4 |
|
China 2 |
200.1 |
200.4 |
189.8 |
181.0 |
|
EC |
2.7 |
2.6 |
2.5 |
2.6 |
|
Egypt |
5.0 |
5.8 |
6.0 |
5.4 |
|
India |
125.3 |
134.4 |
128.8 |
131.0 |
|
Indonesia |
49.9 |
50.9 |
51.9 |
50.2 |
|
Japan |
12.2 |
11.5 |
11.9 |
10.9 |
|
Pakistan |
6.7 |
7.7 |
7.2 |
5.8 |
|
Philippines |
10.5 |
12.0 |
12.5 |
12.8 |
|
Thailand |
23.2 |
24.2 |
24.1 |
24.1 |
|
United States |
8.2 |
9.3 |
8.7 |
9.4 |
|
Viet Nam |
29.0 |
32.7 |
31.7 |
31.8 |
1 Production refers to the calendar year in which the harvest or bulk of the harvest took place.
2 Including Hong Kong and Province of Taiwan.
|
Rice exports (milled) 1 |
||||
|
|
1996-98 |
1999 |
2000 |
2001 |
|
Million tonnes |
||||
|
World total |
22.0 |
24.8 |
22.6 |
22.4 |
|
Argentina |
0.4 |
0.7 |
0.4 |
0.2 |
|
Australia |
0.6 |
0.7 |
0.5 |
0.7 |
|
China 2 |
2.0 |
3.1 |
3.4 |
2.3 |
|
EC 2 |
0.2 |
0.2 |
0.2 |
0.2 |
|
India |
3.4 |
2.6 |
1.4 |
1.5 |
|
Myanmar |
0.2 |
0.1 |
0.1 |
0.4 |
|
Pakistan |
1.9 |
1.9 |
2.0 |
1.9 |
|
Thailand |
5.7 |
6.7 |
6.6 |
6.8 |
|
United States |
2.7 |
2.6 |
2.8 |
2.7 |
|
Uruguay |
0.6 |
0.7 |
0.7 |
0.6 |
|
Viet Nam |
3.5 |
4.6 |
3.4 |
3.8 |
1 Excludes re-exports.
2 Including Hong Kong and Province of Taiwan.
3 Excludes intra-trade.
|
Rice stocks (milled) 1 |
||||
|
|
1996-98 |
1999 |
2000 |
2001 |
|
Million tonnes |
||||
|
World total |
149.6 |
155.7 |
162.6 |
154.7 |
|
Bangladesh |
1.5 |
1.4 |
2.1 |
2.5 |
|
China 2 |
107.2 |
113.3 |
112.9 |
106.4 |
|
India |
16.7 |
17.7 |
20.1 |
18.7 |
|
Indonesia |
4.8 |
4.0 |
4.5 |
4.1 |
|
Thailand |
1.4 |
1.1 |
1.2 |
0.9 |
|
United States |
0.9 |
0.7 |
0.9 |
0.9 |
|
Viet Nam |
1.8 |
2.2 |
3.3 |
3.3 |
1 At the end of national crop years.
2 Including Hong Kong and Province of Taiwan.
|
Rice imports (milled) 1 |
||||
|
|
1996-98 |
1999 |
2000 |
2001 |
|
Million tonnes |
||||
|
World total |
21.9 |
24.6 |
22.4 |
22.4 |
|
Bangladesh |
1.5 |
1.8 |
0.5 |
0.3 |
|
Brazil |
1.0 |
1.0 |
0.7 |
0.6 |
|
China 2 |
0.4 |
0.2 |
0.2 |
0.3 |
|
EC 3 |
0.7 |
0.7 |
0.6 |
0.6 |
|
Indonesia |
3.0 |
3.9 |
2.0 |
1.2 |
|
Iran, Isl. Rep. |
0.8 |
1.0 |
1.1 |
1.0 |
|
Japan |
0.5 |
0.7 |
0.7 |
0.7 |
|
Malaysia |
0.6 |
0.6 |
0.7 |
0.7 |
|
Nigeria |
0.5 |
0.9 |
1.0 |
1.0 |
|
Philippines |
1.2 |
0.8 |
0.8 |
0.8 |
|
Saudi Arabia |
0.7 |
0.8 |
0.8 |
0.8 |
|
Senegal |
0.5 |
0.7 |
0.5 |
0.7 |
1 Excludes re-exports.
2 Including Hong Kong and Province of Taiwan.
3 Excludes intra-trade.
|
Rice export prices (fob) |
|||||||
|
|
1995 |
1996 |
1997 |
1998 |
1999 |
2000 |
2001 |
|
US$/tonne |
|||||||
|
Thai 100% B |
336 |
352 |
316 |
315 |
253 |
207 |
177 |
|
Thai A1 Super |
268 |
234 |
214 |
215 |
192 |
143 |
134 |
RICE TRADE1 (Milled) million tonnes
1 Exports
|
Wheat production |
||||
|
|
1996-98 |
1999 |
2000 |
2001 |
|
Million tonnes |
||||
|
World total |
600.1 |
590.8 |
584.9 |
575.5 |
|
Argentina |
14.6 |
15.7 |
16.5 |
17.5 |
|
Australia |
21.2 |
25.0 |
21.2 |
21.0 |
|
Canada |
26.1 |
26.9 |
26.8 |
20.7 |
|
China |
114.5 |
113.9 |
99.6 |
93.9 |
|
EC |
99.4 |
97.6 |
105.2 |
91.6 |
|
India |
65.9 |
70.8 |
75.6 |
68.5 |
|
Pakistan |
17.4 |
17.9 |
21.1 |
19.0 |
|
Turkey |
19.4 |
16.5 |
18.0 |
16.0 |
|
United States |
66.3 |
62.6 |
60.8 |
53.3 |
|
Russian Federation |
37.4 |
34.0 |
38.0 |
43.0 |
|
Wheat exports 1 |
||||
|
|
1995/96-1997/98 |
1998/99 |
1999/00 |
2000/01 |
|
World total |
100.0 |
100.9 |
110.0 |
100.7 |
|
Main Exporters |
84.7 |
81.7 |
92.2 |
87.2 |
|
Argentina |
7.6 |
8.3 |
10.3 |
11.0 |
|
Australia |
15.2 |
16.5 |
17.3 |
16.5 |
|
Canada |
18.7 |
14.2 |
18.5 |
17.4 |
|
EC 2 |
13.6 |
13.7 |
16.7 |
14.5 |
|
United States |
29.6 |
29.0 |
29.5 |
27.9 |
|
Others |
15.3 |
19.2 |
17.8 |
13.5 |
|
Hungary |
1.5 |
1.6 |
0.7 |
1.2 |
|
Romania |
0.9 |
0.4 |
0.6 |
0.0 |
|
Turkey |
0.9 |
2.8 |
2.0 |
1.3 |
|
Russian Federation |
0.7 |
1.5 |
0.6 |
0.7 |
1 Trade season July/June.
2 Excluding intra-trade between the 15 member countries.
|
Wheat closing stocks 1 |
||||
|
|
1995/96-1997/98 |
1998/99 |
1999/00 |
2000/01 |
|
Million tonnes |
||||
|
World total |
231.0 |
257.7 |
251.9 |
236.8 |
|
Main exporters |
34.6 |
50.7 |
50.4 |
52.3 |
|
Argentina |
1.1 |
0.8 |
0.8 |
0.9 |
|
Australia |
1.8 |
2.0 |
3.7 |
3.2 |
|
Canada |
7.3 |
7.4 |
7.7 |
9.2 |
|
EC |
10.5 |
14.8 |
12.3 |
15.0 |
|
United States |
14.0 |
25.7 |
25.9 |
24.0 |
|
Others |
196.3 |
207.0 |
201.5 |
184.5 |
|
China |
131.8 |
133.3 |
130.4 |
112.4 |
|
Egypt |
1.1 |
2.3 |
1.6 |
1.1 |
|
India |
16.2 |
22.0 |
28.5 |
35.0 |
|
Japan |
1.4 |
1.3 |
1.0 |
0.9 |
|
Russian Federation |
5.2 |
4.0 |
4.0 |
4.4 |
1 At the end of national crop years.
|
Wheat imports 1 |
||||
|
|
1995/96-1997/98 |
1998/99 |
1999/00 |
2000/01 |
|
Million tonnes |
||||
|
World total |
100.9 |
108.6 |
103.0 |
104.0 |
|
Algeria |
4.0 |
4.4 |
4.8 |
4.3 |
|
Brazil |
6.3 |
7.4 |
6.5 |
7.0 |
|
China |
3.3 |
2.0 |
1.4 |
3.1 |
|
Egypt |
7.2 |
5.9 |
6.2 |
6.6 |
|
Indonesia |
3.8 |
3.5 |
3.9 |
3.8 |
|
Iran, Islamic Rep. |
4.6 |
7.0 |
7.2 |
7.4 |
|
Japan |
6.0 |
5.8 |
5.7 |
6.0 |
|
Korea Rep. |
3.8 |
3.4 |
3.8 |
4.0 |
|
Morocco |
2.4 |
2.2 |
3.3 |
3.0 |
|
Russian Federation |
2.4 |
5.2 |
1.6 |
1.5 |
1 Trade season July/June.
|
Wheat export prices |
||||||
|
|
1995/96 |
1996/97 |
1997/98 |
1998/99 |
1999/00 |
2000/01 |
|
US$/tonne |
||||||
|
Argentina: Trigo pan 1 |
218 |
157 |
137 |
118 |
104 |
118 |
|
US Hard Winter No.2 2 |
216 |
181 |
142 |
120 |
112 |
128 |
|
US Soft red Winter No.2 3 |
198 |
158 |
129 |
100 |
97 |
101 |
|
EC: Standard 4 |
210 |
170 |
134 |
101 |
97 |
103 |
|
Australia: Standard White 5 |
231 |
203 |
165 |
148 |
136 |
155 |
Sources: International Grain Council, USDA and Reuters.WHEAT PRODUCTION - 'million tonnes1 Buenos Aires, indicative traded prices. 2 Fob US Gulf ports.. 3 Fob US Atlantic ports. 4 Fob France (Rouen) based on weekly "free market tenders", net of export restitutions. 5 Fob East Coast.
WHEAT TRADE * - million tonnes
* Estimated world imports of wheat on July/June basis.
|
Production of coarse grains |
||||
|
|
1996-98 |
1999 |
2000 |
2001 |
|
Million tonnes |
||||
|
World total |
912.5 |
888.0 |
874.0 |
900.2 |
|
Argentina |
19.2 |
17.9 |
21.7 |
19.5 |
|
Brazil |
32.8 |
33.7 |
32.9 |
43.1 |
|
Canada |
26.9 |
27.0 |
24.5 |
22.5 |
|
China |
137.8 |
140.6 |
118.4 |
122.6 |
|
EC |
107.9 |
103.7 |
109.0 |
108.8 |
|
India |
32.0 |
30.3 |
29.7 |
30.4 |
|
Mexico |
25.0 |
24.9 |
23.5 |
26.8 |
|
Poland |
17.2 |
16.7 |
13.8 |
16.6 |
|
United States 1 |
266.1 |
263.6 |
274.7 |
263.7 |
|
Russian Federation |
32.8 |
24.6 |
31.6 |
36.3 |
1 Clean weight basis.
|
Exports of coarse grains |
||||
|
|
1995/96 1997/98 |
1998/99 |
1999/00 |
2000/01 |
|
Million tonnes |
||||
|
World total |
91.2 |
94.9 |
101.7 |
105.4 |
|
Main Exporters |
77.7 |
80.5 |
85.7 |
86.3 |
|
Argentina |
10.2 |
10.8 |
8.6 |
12.9 |
|
Australia |
3.7 |
4.8 |
3.9 |
4.3 |
|
Canada |
4.0 |
2.7 |
3.2 |
3.2 |
|
EC 2/ |
5.7 |
9.1 |
12.9 |
10.8 |
|
United States |
54.1 |
53.1 |
57.1 |
55.1 |
|
Others |
13.5 |
14.4 |
16.0 |
19.2 |
|
China 3/ |
3.1 |
3.3 |
7.2 |
9.8 |
|
Hungary |
1.0 |
1.9 |
1.9 |
0.6 |
|
Romania |
0.4 |
0.2 |
0.3 |
0.0 |
|
South Africa |
1.4 |
1.2 |
0.2 |
1.6 |
|
Turkey |
0.4 |
1.3 |
0.2 |
0.8 |
1 Trade season July/June.
2 Excluding intra-trade between the 15 member countries.
|
Closing stocks1 |
||||
|
|
1995/96 1997/98 |
1998/99 |
1999/00 |
2000/01 |
|
Million tonnes |
||||
|
World total |
236.0 |
272.1 |
262.1 |
235.4 |
|
Main exporters |
49.3 |
82.2 |
74.6 |
77.0 |
|
Argentina |
0.7 |
0.9 |
0.8 |
1.2 |
|
Australia |
1.3 |
1.3 |
1.0 |
0.9 |
|
Canada |
4.1 |
5.0 |
5.8 |
4.5 |
|
EC |
16.7 |
23.7 |
18.1 |
17.8 |
|
United States |
26.5 |
51.4 |
48.9 |
52.7 |
|
Others |
186.8 |
189.9 |
187.6 |
158.4 |
|
China |
135.8 |
141.2 |
139.0 |
119.0 |
|
Egypt |
0.3 |
0.5 |
0.7 |
1.8 |
|
Japan |
2.2 |
2.2 |
2.5 |
2.4 |
|
Mexico |
3.8 |
3.5 |
4.1 |
3.5 |
|
Russian Federation |
5.3 |
1.7 |
0.9 |
2.1 |
1 At the end of national crop years.
|
Imports of coarse grains1 |
||||
|
|
1995/96 1997/98 |
1998/99 |
1999/00 |
2000/01 |
|
Million tonnes |
||||
|
World total |
91.7 |
96.4 |
102.8 |
106.5 |
|
Brazil |
0.9 |
1.7 |
1.6 |
1.1 |
|
China |
9.1 |
6.8 |
8.3 |
7.1 |
|
Colombia |
1.5 |
2.1 |
2.1 |
2.3 |
|
EC 2 |
3.2 |
3.5 |
2.3 |
2.4 |
|
Egypt |
2.9 |
3.6 |
3.8 |
4.9 |
|
Japan |
20.6 |
21.0 |
20.6 |
20.4 |
|
Korea Rep. |
9.2 |
7.5 |
7.5 |
9.8 |
|
Malaysia |
2.4 |
2.4 |
2.4 |
2.4 |
|
Mexico |
7.2 |
9.4 |
10.4 |
10.2 |
|
Saudi Arabia |
5.3 |
6.4 |
5.8 |
6.2 |
1 Trade season July/June.
2 Excluding intra-trade between the 15 member countries.
|
Export prices of coarse grains |
||||||
|
|
1995/96 |
1996/97 |
1997/98 |
1998/99 |
1999/00 |
2000/01 |
|
$/tonne |
||||||
|
Maize, US No.2 1 |
159 |
135 |
112 |
95 |
91 |
86 |
|
Maize, Argentina 2 |
160 |
133 |
109 |
98 |
88 |
78 |
|
Sorghum, US No.2 3 |
156 |
124 |
111 |
92 |
89 |
93 |
Sources: USDA and Reuters.COARSE GRAIN PRODUCTION - million tonnes1 Yellow, delivered US Gulf ports. 2 Buenos Aires, indicative traded prices. 3 Yellow, fob US Gulf ports.
COARSE GRAIN TRADE * - million tonnes
* Estimated world imports of coarse grains on July/June basis
|
Cassava production 1 |
|||||
|
|
1995-97 |
1998 |
1999 |
2000* |
2001 ** |
|
Million tonnes |
|||||
|
World |
161.9 |
163.4 |
172.7 |
175.6 |
178.0 |
|
Nigeria |
31.6 |
32.7 |
32.7 |
33.9 |
34.0 |
|
Brazil |
21.0 |
19.5 |
20.9 |
23.3 |
24.2 |
|
Congo Dem. Rep. |
17.8 |
17.1 |
16.5 |
16.0 |
15.4 |
|
Thailand |
17.2 |
16.4 |
20.3 |
18.8 |
18.3 |
|
Indonesia |
15.9 |
14.7 |
16.5 |
16.1 |
15.6 |
|
Ghana |
6.9 |
7.2 |
7.8 |
8.1 |
8.5 |
|
Tanzania |
5.9 |
6.1 |
7.2 |
5.8 |
5.0 |
|
India |
5.7 |
6.1 |
6.1 |
6.3 |
7.0 |
|
Mozambique |
4.7 |
5.6 |
5.4 |
4.6 |
4.7 |
|
China |
3.6 |
3.4 |
3.6 |
3.6 |
3.8 |
|
Paraguay |
3.0 |
3.3 |
3.5 |
3.5 |
3.7 |
|
Madagascar |
2.4 |
2.4 |
2.5 |
2.5 |
2.4 |
|
Uganda |
2.3 |
3.2 |
3.3 |
5.0 |
5.5 |
|
Viet Nam |
2.2 |
1.8 |
1.8 |
2.0 |
2.0 |
|
Others |
21.7 |
23.9 |
24.6 |
26.1 |
27.9 |
1 In fresh root equivalent
* Preliminary.
**Forecast.
|
Cassava trade 1 |
|||||
|
|
1995-97 |
1998 |
1999 |
2000 |
2001 |
|
Million tonnes |
|||||
|
World exports |
6.68 |
5.19 |
6.96 |
6.85 |
7.27 |
|
Thailand |
5.57 |
4.75 |
6.41 |
6.49 |
6.98 |
|
Indonesia |
0.39 |
0.22 |
0.34 |
0.15 |
0.14 |
|
China |
0.37 |
0.01 |
0.01 |
0.01 |
0.01 |
|
Viet Nam |
0.03 |
0.03 |
0.02 |
0.02 |
- |
|
Others |
0.32 |
0.18 |
0.18 |
0.18 |
0.14 |
|
World imports |
6.68 |
5.19 |
6.96 |
6.85 |
7.27 |
|
EC |
3.48 |
2.89 |
4.28 |
3.66 |
2.67 |
|
China |
0.77 |
0.73 |
1.12 |
0.89 |
2.42 |
|
Korea Republic of |
0.42 |
0.36 |
0.10 |
0.09 |
0.26 |
|
Japan |
0.56 |
0.43 |
0.53 |
0.58 |
0.59 |
|
Indonesia |
0.41 |
0.14 |
0.10 |
0.51 |
0.40 |
|
United States |
0.11 |
0.11 |
0.13 |
0.11 |
0.07 |
|
Others |
0.93 |
0.53 |
0.69 |
1.02 |
0.86 |
1 In product weight of chips and pellets (one tonne of flour equivalent to two tonnes of pellets).
* Preliminary.
**Forecast.
|
Cassava export prices 1 |
|||||||||
|
|
1995
|
1996
|
1997
|
1998
|
1999
|
2000
|
2001 |
2001 |
2001 |
|
Jan-Mar |
Apr-Jun |
Jul-Aug |
|||||||
|
US$/tonne |
|||||||||
|
Tapioca flour/starch |
357 |
277 |
244 |
281 |
172 |
158 |
158 |
177 |
185 |
1 F.o.b. Bangkok.
|
Cassava import prices |
|||||||||
|
|
1995
|
1996
|
1997
|
1998
|
1999
|
2000
|
2001 |
2001 |
2001 |
|
Jan-Mar |
Apr-Jun |
Jul-Aug |
|||||||
|
US$/tonne |
|||||||||
|
Cassava pellets 2 |
177 |
152 |
108 |
107 |
102 |
84 |
80 |
80 |
84 |
|
Cassava-soybean meal 3 |
181 |
175 |
142 |
120 |
112 |
105 |
102 |
98 |
104 |
|
Barley 4 |
209 |
194 |
161 |
145 |
143 |
144 |
139 |
144 |
154 |
|
Maize 5 |
124 |
165 |
117 |
102 |
92 |
88 |
93 |
85 |
92 |
1 In the EC, the major import market. 2 F.o.b. Rotterdam (barge or rail) including 6 percent duty. 3 Consisting of 80 percent cassava pellets and 20 percent soybean meal. 4 Selling price in Spain. 5 U.S. Maize No. 2 Yellow F.O.B. Gulf Port.CASSAVA PRODUCTION - million tonnes
CASSAVA TRADE - million tonnes
|
Production of oils and fats1 |
||||
|
|
1995/96-1997/98 |
1998/99 |
1999/00 |
2000/01 |
|
Million tonnes |
||||
|
WORLD TOTALS |
||||
|
All fats and oils2 |
100.5 |
111.2 |
114.7 |
116.9 |
|
Soybean |
21.9 |
25.6 |
25.6 |
27.5 |
|
Sunflowerseed |
9.1 |
10.4 |
9.9 |
8.3 |
|
Groundnut |
5.1 |
5.3 |
5.0 |
5.3 |
|
Cottonseed |
3.5 |
3.3 |
3.4 |
3.4 |
|
Rapeseed |
11.3 |
12.4 |
14.6 |
12.8 |
|
Olive |
2.4 |
2.6 |
2.4 |
2.6 |
|
Coconut |
3.3 |
2.7 |
3.4 |
3.6 |
|
Palm kernel |
2.2 |
2.6 |
2.7 |
2.9 |
|
Palm |
17.5 |
20.6 |
21.7 |
23.5 |
|
Marine |
1.1 |
1.4 |
1.4 |
1.3 |
|
REGIONAL TOTALS |
||||
|
Africa |
5.3 |
5.4 |
5.3 |
5.4 |
|
Nigeria |
1.5 |
1.5 |
1.5 |
1.5 |
|
Asia |
40.1 |
43.8 |
45.4 |
48.8 |
|
China |
9.6 |
9.9 |
10.7 |
12.4 |
|
India |
8.7 |
8.6 |
8.0 |
7.4 |
|
Indonesia |
6.5 |
7.7 |
8.6 |
9.0 |
|
Malaysia |
9.7 |
11.9 |
12.2 |
13.0 |
|
Philippines |
1.4 |
0.9 |
1.5 |
1.8 |
|
South America |
13.3 |
16.0 |
16.2 |
16.5 |
|
Argentina |
5.2 |
6.8 |
6.3 |
6.1 |
|
Brazil |
5.8 |
6.5 |
7.1 |
7.7 |
|
N. America & Caribbean |
22.6 |
25.6 |
25.6 |
26.2 |
|
Canada |
3.2 |
4.0 |
4.4 |
3.7 |
|
United States |
18.5 |
20.7 |
20.2 |
21.6 |
|
Europe |
13.7 |
14.6 |
15.5 |
13.7 |
|
EU |
10.6 |
11.4 |
11.8 |
10.9 |
|
Eastern Europe |
2.7 |
2.9 |
3.5 |
2.7 |
|
CIS |
3.5 |
3.3 |
3.9 |
3.9 |
|
Russian Federation |
1.8 |
1.6 |
2.0 |
1.7 |
|
Oceania |
1.9 |
2.4 |
2.6 |
2.3 |
|
Australia |
1.0 |
1.4 |
1.6 |
1.4 |
1 The output of vegetable oils in a given year is not based on actual crushings but is calculated by applying extraction rates to the proportion of the oilseed crop that is estimated to be available for crushing, regardless of whether it is crushed in producing countries or exported in unprocessed form for crushing in importing countries, or put into stock.2 In addition to the oils listed, includes maize, mustard, rice bran, safflower, sesameseed, babassu, poppyseed and hempseed oils. Butter, lard, sheanut butter, tallow and greases are also included.
|
Exports of oils and fats1 |
||||
|
|
1995/96-1997/98 |
1998/99 |
1999/00 |
2000/01 |
|
Million tonnes |
||||
|
WORLD TOTALS |
||||
|
All fats and oils2 |
41.1 |
47.4 |
50.6 |
53.4 |
|
Soybean |
12.4 |
14.4 |
14.6 |
16.2 |
|
Sunflowerseed |
4.4 |
5.0 |
4.7 |
4.1 |
|
Groundnut |
0.8 |
0.7 |
0.7 |
0.7 |
|
Cottonseed |
0.4 |
0.3 |
0.4 |
0.4 |
|
Rapeseed |
3.4 |
4.5 |
5.5 |
4.8 |
|
Olive |
0.4 |
0.6 |
0.5 |
0.5 |
|
Coconut |
1.7 |
1.0 |
2.0 |
2.2 |
|
Palm kernel |
1.0 |
1.3 |
1.2 |
1.4 |
|
Palm |
11.1 |
13.9 |
14.8 |
16.9 |
|
Marine |
0.6 |
0.6 |
0.8 |
0.8 |
|
REGIONAL TOTALS |
||||
|
Africa |
0.9 |
1.0 |
0.9 |
1.0 |
|
Asia |
14.9 |
17.0 |
18.6 |
21.4 |
|
China |
0.8 |
0.3 |
0.4 |
0.5 |
|
Indonesia |
3.2 |
4.3 |
5.5 |
5.8 |
|
Malaysia |
8.3 |
10.1 |
10.1 |
11.4 |
|
Philippines |
1.0 |
0.5 |
1.1 |
1.3 |
|
South America |
8.0 |
10.6 |
10.0 |
10.9 |
|
Argentina |
4.4 |
6.2 |
5.2 |
5.5 |
|
Brazil |
2.6 |
3.2 |
3.3 |
4.0 |
|
N. America & Caribbean |
10.6 |
11.3 |
11.7 |
12.3 |
|
Canada |
2.6 |
3.3 |
3.2 |
3.6 |
|
United States |
7.8 |
7.8 |
8.3 |
8.5 |
|
Europe |
3.9 |
4.3 |
5.7 |
4.0 |
|
EU |
2.9 |
3.2 |
3.8 |
2.7 |
|
Eastern Europe |
0.8 |
0.9 |
1.5 |
1.0 |
|
CIS |
1.2 |
1.1 |
1.3 |
1.6 |
|
Oceania |
1.5 |
1.9 |
2.2 |
1.9 |
|
Australia |
0.7 |
1.2 |
1.4 |
1.2 |
1 Including oil equivalent of oilseeds; excluding main re-exports of oil from imported oilseeds.2 In addition to the oils listed, includes maize, mustard, rice bran, safflower, sesameseed, babassu, poppyseed and hempseed oils. Butter, sheanut butter, lard, tallow and greases are also included.
|
Prices of oilcrop-based products |
||||
|
|
1996/97 1998/99 |
1999/00 |
2000/01 |
2001/025 |
|
FAO price index 1990-92=100 1 |
||||
|
All fats and oils1 |
|
93 |
82 |
93 |
|
Edible/soap |
91 |
91 |
81 |
92 |
|
Soft2 |
94 |
94 |
93 |
110 |
|
Oilcakes and meals3 |
110 |
89 |
96 |
99 |
|
Oilseeds4 |
105 |
84 |
82 |
83 |
1 Fats and oils index excludes butter and lard.
2 Cottonseed, groundnut, rapeseed, soybean and sunflowerseed oils.
3 Prices of copra, groundnut and palm kernel cakes and of soybean, rapeseed and sunflowerseed meals.
4 Prices of soybean, rapeseed, linseed, copra and sunflowerseed.
5 Only for October and November 2001.
|
Imports of oils and fats1 |
||||
|
|
1995/96-1997/98 |
1998/99 |
1999/00 |
2000/01 |
|
Million tonnes |
||||
|
WORLD TOTALS |
||||
|
All fats and oils |
40.5 |
48.2 |
51.3 |
52.6 |
|
REGIONAL TOTALS |
||||
|
Africa |
3.8 |
4.5 |
4.5 |
4.3 |
|
Egypt |
1.0 |
1.2 |
1.3 |
1.1 |
|
Asia |
17.9 |
22.9 |
24.6 |
24.6 |
|
China |
3.8 |
4.3 |
5.6 |
5.5 |
|
India |
2.0 |
4.9 |
5.6 |
5.7 |
|
Pakistan |
1.3 |
1.6 |
1.7 |
1.7 |
|
Turkey |
1.1 |
1.2 |
1.1 |
1.2 |
|
South America |
1.8 |
2.0 |
2.0 |
1.8 |
|
N. America & Caribbean |
5.0 |
5.4 |
5.9 |
5.9 |
|
Mexico |
1.8 |
2.1 |
2.3 |
2.3 |
|
United States |
1.9 |
1.9 |
2.2 |
2.2 |
|
Europe |
10.5 |
11.9 |
12.9 |
14.4 |
|
EU |
9.2 |
9.5 |
10.2 |
10.9 |
|
Eastern Europe |
0.8 |
0.7 |
0.7 |
0.7 |
|
CIS |
1.2 |
1.1 |
1.0 |
1.0 |
|
Oceania |
0.3 |
0.3 |
0.3 |
0.3 |
1 Including the oil equivalent of oilseeds.
|
Production of oilmeals and cakes1 |
||||
|
|
1995/96-1997/98 |
1998/99 |
1999/00 |
2000/01 |
|
Million tonnes(protein equivalent) |
||||
|
WORLD TOTALS |
||||
|
Meals and cakes2 |
68.3 |
76.8 |
77.8 |
80.2 |
|
Soybean |
43.5 |
50.8 |
50.7 |
54.6 |
|
Sunflowerseed |
3.9 |
4.5 |
4.2 |
3.6 |
|
Groundnut |
3.4 |
3.5 |
3.2 |
3.4 |
|
Cottonseed |
4.9 |
4.6 |
4.7 |
4.7 |
|
Rapeseed |
6.2 |
6.7 |
7.9 |
6.9 |
|
Copra |
0.4 |
0.3 |
0.4 |
0.4 |
|
Palm kernel |
0.6 |
0.7 |
0.7 |
0.7 |
|
Fishmeal |
4.1 |
4.3 |
4.5 |
4.4 |
|
REGIONAL TOTALS |
||||
|
Africa |
1.7 |
1.8 |
1.8 |
1.8 |
|
Asia |
15.8 |
16.1 |
15.8 |
16.0 |
|
China |
7.1 |
7.4 |
7.5 |
8.3 |
|
India |
5.6 |
5.5 |
4.9 |
4.4 |
|
Indonesia |
0.2 |
0.3 |
0.3 |
0.3 |
|
Pakistan |
0.7 |
0.6 |
0.7 |
0.7 |
|
Malaysia |
0.3 |
0.4 |
0.4 |
0.4 |
|
South America |
18.8 |
22.7 |
23.8 |
26.2 |
|
Argentina |
6.3 |
8.7 |
8.5 |
9.7 |
|
Brazil |
9.4 |
10.7 |
11.7 |
12.9 |
|
Chile |
0.7 |
0.6 |
0.6 |
0.5 |
|
Paraguay |
0.9 |
1.0 |
1.0 |
1.1 |
|
Peru |
1.0 |
1.2 |
1.5 |
1.5 |
|
N. America/Caribbean |
25.8 |
29.3 |
28.7 |
29.5 |
|
Canada |
1.9 |
2.3 |
2.5 |
2.2 |
|
United States |
23.7 |
26.8 |
26.0 |
27.1 |
|
Europe |
4.3 |
4.8 |
5.3 |
4.5 |
|
EC |
3.1 |
3.5 |
3.7 |
3.3 |
|
Eastern Europe |
0.9 |
1.0 |
1.3 |
0.9 |
|
CIS |
1.5 |
1.5 |
1.7 |
1.7 |
|
Oceania |
0.3 |
0.6 |
0.8 |
0.5 |
1 The output of vegetable oilmeals in a given year is not based on actual crushings but is calculated by applying extraction rates to the proportion of the oilseed crop that is estimated to be available for crushing regardless of whether it is crushed in producing countries or exported in unprocessed form for crushing in importing countries, or put into stocks.2 In addition to the oilcakes listed, includes safflower and sesameseed cakes and meals.
|
Exports of oilmeals and cakes1 |
||||
|
|
1995/96-1997/98 |
1998/99 |
1999/00 |
2000/01 |
|
Million tonnes (protein equivalent) |
||||
|
WORLD TOTALS |
||||
|
Meals and cakes 2 |
34.6 |
38.0 |
40.9 |
42.7 |
|
Soybean |
26.8 |
29.9 |
31.9 |
34.5 |
|
Sunflowerseed |
1.7 |
2.0 |
1.6 |
1.4 |
|
Groundnut |
0.6 |
0.4 |
0.4 |
0.4 |
|
Cottonseed |
0.5 |
0.5 |
0.5 |
0.5 |
|
Rapeseed |
1.7 |
1.9 |
2.6 |
2.2 |
|
Copra |
0.2 |
0.1 |
0.2 |
0.2 |
|
Palm kernel |
0.4 |
0.6 |
0.6 |
0.6 |
|
Fishmeal |
2.1 |
2.1 |
2.6 |
2.5 |
|
REGIONAL TOTALS |
||||
|
Africa |
0.4 |
0.4 |
0.4 |
0.4 |
|
Asia |
3.0 |
2.9 |
2.9 |
2.6 |
|
China |
0.5 |
0.3 |
0.5 |
0.5 |
|
India |
1.7 |
1.6 |
1.3 |
1.1 |
|
Indonesia |
0.2 |
0.3 |
0.3 |
0.3 |
|
Malaysia |
0.3 |
0.4 |
0.4 |
0.4 |
|
Philippines |
0.1 |
0.1 |
0.1 |
0.2 |
|
South America |
15.9 |
19.2 |
19.7 |
21.9 |
|
Argentina |
6.1 |
8.4 |
8.0 |
9.2 |
|
Brazil |
7.1 |
8.0 |
8.5 |
9.6 |
|
Chile |
0.5 |
0.4 |
0.4 |
0.4 |
|
Paraguay |
0.8 |
1.0 |
0.9 |
1.0 |
|
Peru |
0.9 |
1.1 |
1.5 |
1.5 |
|
N. America/Caribbean |
13.2 |
12.8 |
14.5 |
15.0 |
|
Canada |
1.4 |
1.7 |
1.7 |
1.7 |
|
United States |
11.7 |
11.0 |
12.7 |
13.2 |
|
Europe |
1.4 |
1.8 |
2.3 |
1.9 |
|
EC |
0.7 |
1.1 |
1.3 |
1.0 |
|
Eastern Europe |
0.4 |
0.4 |
0.7 |
0.5 |
|
CIS |
0.5 |
0.5 |
0.5 |
0.6 |
|
Oceania |
0.2 |
0.5 |
0.6 |
0.4 |
1 Including the cake equivalent of oilseeds; excluding main re-exports of cake from imported oilseeds.2 In addition to the oilcakes listed, includes safflower, sesameseed and unspecified oilcakes and meals.
|
Imports of oilmeals and cakes 1 |
||||
|
|
1995/96-1997/98 |
1998/99 |
1999/00 |
2000/01 |
|
Million tonnes (protein equivalent) |
||||
|
WORLD TOTALS |
||||
|
Meals and cakes |
34.3 |
38.2 |
40.8 |
42.6 |
|
REGIONAL TOTALS |
||||
|
Africa |
1.1 |
1.2 |
1.3 |
1.3 |
|
Egypt |
0.3 |
0.5 |
0.5 |
0.5 |
|
Asia |
12.1 |
12.9 |
15.4 |
16.5 |
|
China |
2.6 |
2.8 |
4.5 |
5.6 |
|
Indonesia |
0.5 |
0.5 |
0.7 |
0.7 |
|
Malaysia |
0.5 |
0.5 |
0.5 |
0.5 |
|
Turkey |
0.4 |
0.6 |
0.5 |
0.6 |
|
South America |
1.6 |
1.9 |
1.9 |
1.6 |
|
Brazil |
0.4 |
0.3 |
0.4 |
0.2 |
|
N. America/Caribbean |
3.0 |
3.6 |
3.8 |
3.8 |
|
Canada |
0.5 |
0.6 |
0.6 |
0.6 |
|
Mexico |
1.4 |
1.8 |
1.8 |
1.9 |
|
United States |
0.6 |
0.6 |
0.6 |
0.6 |
|
Europe |
15.9 |
18.0 |
18.0 |
18.8 |
|
EC |
14.3 |
16.3 |
16.2 |
16.7 |
|
Eastern Europe |
1.3 |
1.3 |
1.2 |
1.2 |
|
CIS |
0.3 |
0.4 |
0.3 |
0.3 |
|
Oceania |
0.2 |
0.2 |
0.2 |
0.2 |
1 Including the oilcake equivalent of oilseeds.Global Production of Oils/Fats and Meals ('000 tonnes)
Global Trade of Oils/Fats and Meals ('000 tonnes)
|
Meat production1 |
||||
|
|
1996-98 |
1999 |
2000 |
2001 |
|
Million tonnes cwe |
||||
|
TOTAL MEAT2 |
214.5 |
228.8 |
233.4 |
236.9 |
|
Bovine meat |
58.0 |
58.9 |
60.0 |
59.4 |
|
United States |
11.8 |
12.1 |
12.2 |
11.8 |
|
EC |
7.9 |
7.7 |
7.4 |
6.9 |
|
CIS |
4.7 |
4.0 |
4.3 |
4.0 |
|
Brazil |
6.0 |
6.2 |
6.5 |
6.7 |
|
China |
4.3 |
5.1 |
5.4 |
5.6 |
|
Others |
23.4 |
23.8 |
24.3 |
24.4 |
|
Ovine meat |
10.5 |
11.1 |
11.4 |
11.5 |
|
China |
2.0 |
2.5 |
2.7 |
2.8 |
|
EC |
1.2 |
1.1 |
1.1 |
1.0 |
|
CIS |
0.6 |
0.5 |
0.5 |
0.5 |
|
Pakistan |
0.5 |
0.5 |
0.5 |
0.5 |
|
India |
0.7 |
0.7 |
0.7 |
0.7 |
|
Others |
5.6 |
5.7 |
5.9 |
5.9 |
|
Pig meat |
82.7 |
89.9 |
91.1 |
93.1 |
|
China |
36.5 |
40.9 |
42.9 |
44.9 |
|
EC |
16.8 |
18.0 |
17.6 |
17.4 |
|
United States |
8.1 |
8.8 |
8.5 |
8.6 |
|
CIS |
2.8 |
2.7 |
2.4 |
2.2 |
|
Poland |
2.0 |
2.0 |
1.9 |
1.8 |
|
Others |
16.5 |
17.5 |
17.8 |
18.2 |
|
Poultry meat |
59.1 |
64.7 |
66.6 |
68.6 |
|
United States |
14.9 |
16.0 |
16.5 |
16.7 |
|
China |
10.3 |
11.9 |
12.4 |
12.7 |
|
EC |
8.5 |
8.7 |
8.5 |
8.8 |
|
Brazil |
4.6 |
5.6 |
6.0 |
6.4 |
|
CIS |
1.0 |
1.1 |
1.1 |
1.1 |
|
Others |
19.8 |
21.4 |
22.1 |
22.9 |
1 In terms of carcass weight (cwe), excluding slaughter fats and offals.
2 Including “Other meat”.
|
Meat exports1 |
||||
|
|
1996-98 |
1999 |
2000 |
2001 |
|
Million tonnes cwe |
||||
|
TOTAL MEAT2 |
14.68 |
16.52 |
16.91 |
17.00 |
|
Bovine meat |
5.17 |
5.48 |
5.36 |
5.17 |
|
Australia |
1.08 |
1.18 |
1.23 |
1.27 |
|
EC |
0.87 |
0.85 |
0.51 |
0.40 |
|
United States |
0.86 |
1.00 |
1.04 |
0.98 |
|
New Zealand |
0.46 |
0.40 |
0.44 |
0.46 |
|
Argentina |
0.32 |
0.30 |
0.32 |
0.15 |
|
Others |
1.58 |
1.75 |
1.83 |
1.91 |
|
Ovine meat |
0.67 |
0.69 |
0.77 |
0.78 |
|
New Zealand |
0.36 |
0.35 |
0.37 |
0.38 |
|
Australia |
0.24 |
0.27 |
0.32 |
0.31 |
|
Others |
0.08 |
0.07 |
0.08 |
0.09 |
|
Pig meat |
2.75 |
3.26 |
3.25 |
3.25 |
|
EC |
0.88 |
1.33 |
1.22 |
0.99 |
|
China |
0.33 |
0.14 |
0.13 |
0.15 |
|
United States |
0.45 |
0.52 |
0.53 |
0.64 |
|
Canada |
0.37 |
0.50 |
0.62 |
0.67 |
|
Others |
0.72 |
0.77 |
0.75 |
0.80 |
|
Poultry meat |
5.83 |
6.83 |
7.26 |
7.55 |
|
United States |
2.53 |
2.53 |
2.77 |
2.95 |
|
EC |
0.91 |
1.00 |
1.10 |
1.07 |
|
Brazil |
0.54 |
0.81 |
0.95 |
1.20 |
|
Thailand |
0.24 |
0.34 |
0.39 |
0.45 |
|
Others |
1.61 |
2.15 |
2.06 |
1.88 |
1 Excluding live animals and offals.
2 Including “Other meat”.
|
Meat imports 1 |
||||
|
|
1996-98 |
1999 |
2000 |
2001 |
|
Million tonnes cwe |
||||
|
TOTAL MEAT 2 |
14.67 |
16.83 |
17.02 |
16.95 |
|
Bovine meat |
5.11 |
5.44 |
5.31 |
5.20 |
|
Japan |
0.93 |
0.96 |
1.03 |
1.01 |
|
United States |
1.00 |
1.23 |
1.30 |
1.31 |
|
EC |
0.38 |
0.38 |
0.24 |
0.40 |
|
Korea, Rep. of |
0.17 |
0.25 |
0.30 |
0.26 |
|
Canada |
0.23 |
0.26 |
0.27 |
0.28 |
|
Others |
2.38 |
2.37 |
2.17 |
1.94 |
|
Ovine meat |
0.67 |
0.67 |
0.76 |
0.78 |
|
EC |
0.22 |
0.22 |
0.24 |
0.25 |
|
Saudi Arabia |
0.05 |
0.05 |
0.06 |
0.06 |
|
Japan |
0.04 |
0.03 |
0.04 |
0.04 |
|
Others |
0.36 |
0.37 |
0.43 |
0.44 |
|
Pig meat |
2.72 |
3.33 |
3.29 |
3.21 |
|
Japan |
0.77 |
0.82 |
0.90 |
0.86 |
|
United States |
0.29 |
0.37 |
0.44 |
0.42 |
|
China (Hong Kong SAR) |
0.16 |
0.20 |
0.23 |
0.26 |
|
Mexico |
0.10 |
0.17 |
0.22 |
0.23 |
|
Others |
1.41 |
1.76 |
1.51 |
1.44 |
|
Poultry meat |
5.91 |
7.12 |
7.36 |
7.46 |
|
China (Hong Kong SAR) |
0.83 |
1.07 |
1.09 |
1.07 |
|
Japan |
0.64 |
0.73 |
0.75 |
0.73 |
|
Saudi Arabia |
0.29 |
0.37 |
0.34 |
0.36 |
|
Mexico |
0.26 |
0.32 |
0.35 |
0.37 |
|
Others |
3.88 |
4.63 |
4.84 |
4.94 |
1 Excluding live animals and offals.
2 Including “Other meat”.
|
International meat prices |
|||||||||
|
|
1996 |
1997 |
1998 |
1999 |
2000 |
2001 |
2001 |
2001 |
2001 |
|
US$/tonne |
|||||||||
|
BEEF |
|||||||||
|
Australia: cow, cif 1 |
1 741 |
1 880 |
1 754 |
1 894 |
1 957 |
1 985 |
2 031 |
2 277 |
2 2813 |
|
Japan: fresh or chilled boneless, cif |
5 538 |
5 269 |
4 756 |
4 844 |
4 693 |
4 529 |
4 565 |
4 435 |
|
|
SHEEP MEAT |
|||||||||
|
New Zealand: frozen lamb 2 |
3 295 |
3 393 |
2 750 |
2 610 |
2 619 |
2 858 |
2 913 |
2 839 |
3 0084 |
|
PIG-MEAT |
|||||||||
|
Japan: frozen, boneless, cif |
6 178 |
5 280 |
4 259 |
4 771 |
4 904 |
4 450 |
4 313 |
5 028 |
|
|
United States: frozen, export unit value |
2 733 |
2 724 |
2 121 |
2 073 |
2 083 |
1 992 |
2 069 |
2 060 |
|
|
CHICKEN MEAT |
|||||||||
|
Japan: fresh, chilled or frozen, cif |
2 357 |
2 036 |
1 900 |
1 812 |
1 522 |
1 442 |
1 480 |
1 657 |
|
|
United States: parts, export unit value |
978 |
843 |
760 |
602 |
592 |
546 |
660 |
682 |
|
1 Destination: United States.World Meat Production
2 Whole carcasses, UK wholesale.
3 October-November. 4 October only
|
Production of milk and milk products |
||||
|
|
1995-97 |
1998 |
1999 |
2000 |
|
Million tonnes |
||||
|
TOTAL MILK |
||||
|
World total |
544.5 |
562.7 |
571.5 |
576.0 |
|
EC |
125.5 |
125.9 |
127.0 |
125.3 |
|
India |
67.4 |
74.5 |
77.2 |
79.0 |
|
United States |
70.2 |
71.4 |
73.8 |
76.3 |
|
Russian Federation |
37.9 |
33.3 |
32.3 |
31.9 |
|
Brazil |
18.0 |
19.4 |
21.8 |
22.3 |
|
Pakistan |
21.8 |
26.7 |
25.6 |
27.0 |
|
Ukraine |
16.2 |
13.8 |
13.4 |
12.6 |
|
Poland |
11.9 |
12.6 |
12.3 |
11.7 |
|
New Zealand |
10.0 |
11.4 |
10.9 |
12.0 |
|
Turkey |
10.5 |
10.0 |
9.9 |
9.9 |
|
Australia |
8.8 |
9.7 |
10.5 |
11.2 |
|
|
.000 tonnes |
|||
|
WHOLE MILK POWDER |
||||
|
World total |
2 301 |
2454 |
2 411 |
2 523 |
|
EC |
825 |
823 |
795 |
775 |
|
New Zealand |
345 |
401 |
341 |
430 |
|
Brazil |
207 |
240 |
244 |
256 |
|
Argentina |
125 |
203 |
224 |
204 |
|
Australia |
111 |
140 |
171 |
190 |
|
SKIMMED MILK POWDER |
||||
|
World total |
3 338 |
3 246 |
3 387 |
3 432 |
|
EC |
1 173 |
1 082 |
1 104 |
1 100 |
|
United States |
540 |
517 |
627 |
690 |
|
Australia |
210 |
230 |
243 |
260 |
|
New Zealand |
164 |
211 |
226 |
220 |
|
Japan |
194 |
202 |
191 |
197 |
|
BUTTER AND GHEE |
||||
|
World total |
6 652 |
6 881 |
7 058 |
6 917 |
|
EC |
1 789 |
1 796 |
1 762 |
1 732 |
|
India |
1 343 |
1 600 |
1 750 |
1 750 |
|
United States |
566 |
530 |
578 |
595 |
|
Pakistan |
384 |
439 |
451 |
465 |
|
New Zealand |
296 |
344 |
320 |
344 |
|
Russian Fed. |
381 |
276 |
257 |
274 |
|
Poland |
165 |
174 |
166 |
160 |
|
Australia |
142 |
161 |
176 |
190 |
|
Ukraine |
189 |
113 |
108 |
120 |
|
CHEESE |
||||
|
World total |
14 765 |
15 504 |
15 721 |
16 015 |
|
EC |
6 318 |
6 549 |
6 558 |
6 670 |
|
United States |
3 538 |
3 729 |
3 931 |
4 057 |
|
Argentina |
394 |
420 |
446 |
432 |
|
Egypt |
352 |
380 |
382 |
370 |
|
Canada |
322 |
352 |
353 |
351 |
|
Australia |
254 |
295 |
315 |
362 |
|
New Zealand |
218 |
266 |
245 |
270 |
|
Exports of milk and milk products |
||||
|
|
1995-97 |
1998 |
1999 |
2000 |
|
‘000 tonnes |
||||
|
WHOLE MILK POWDER |
||||
|
World total |
1 240 |
1 404 |
1 471 |
1 492 |
|
EC |
572 |
589 |
576 |
555 |
|
New Zealand |
312 |
358 |
362 |
382 |
|
Australia |
107 |
147 |
172 |
175 |
|
Argentina |
49 |
99 |
141 |
118 |
|
United States |
40 |
51 |
18 |
20 |
|
SKIMMED MILK POWDER |
||||
|
World total |
1 059 |
961 |
1 149 |
1 170 |
|
New Zealand |
146 |
166 |
179 |
185 |
|
EC |
263 |
175 |
272 |
280 |
|
Australia |
181 |
210 |
225 |
230 |
|
Poland |
100 |
101 |
83 |
70 |
|
BUTTER AND GHEE |
||||
|
World total |
806 |
786 |
782 |
752 |
|
New Zealand |
261 |
316 |
298 |
335 |
|
EC1 |
201 |
167 |
160 |
154 |
|
Australia |
92 |
100 |
145 |
140 |
|
CHEESE |
||||
|
World total |
1 117 |
1 243 |
1 234 |
1 267 |
|
EC |
505 |
443 |
394 |
415 |
|
New Zealand |
179 |
233 |
256 |
260 |
|
Australia |
127 |
182 |
208 |
210 |
|
Switzerland |
60 |
56 |
60 |
60 |
|
Imports of milk and milk products |
||||
|
|
1995-97 |
1998 |
1999 |
2000 |
|
‘000 tonnes |
||||
|
WHOLE MILK POWDER |
||||
|
World total |
1 057 |
1 192 |
1 168 |
1 209 |
|
Brazil |
122 |
134 |
146 |
125 |
|
Algeria |
84 |
134 |
117 |
110 |
|
Malaysia |
57 |
45 |
54 |
60 |
|
Thailand |
48 |
50 |
50 |
55 |
|
Philippines |
36 |
41 |
37 |
58 |
|
Mexico |
36 |
47 |
35 |
45 |
|
Venezuela |
60 |
84 |
52 |
65 |
|
Peru |
30 |
25 |
22 |
25 |
|
SKIMMED MILK POWDER |
||||
|
World total |
1 263 |
1 132 |
1 356 |
1 388 |
|
Mexico |
121 |
103 |
125 |
105 |
|
Philippines |
93 |
78 |
87 |
96 |
|
Algeria |
91 |
86 |
90 |
75 |
|
Malaysia |
78 |
60 |
72 |
112 |
|
Japan |
84 |
57 |
56 |
53 |
|
Thailand |
72 |
53 |
56 |
45 |
|
Indonesia |
48 |
33 |
98 |
110 |
|
BUTTER AND GHEE |
||||
|
World total |
726 |
642 |
621 |
567 |
|
Russian Federation |
172 |
83 |
53 |
40 |
|
EC |
83 |
83 |
82 |
72 |
|
Egypt |
47 |
35 |
43 |
45 |
|
Morocco |
24 |
22 |
20 |
20 |
|
Mexico |
25 |
27 |
34 |
25 |
|
CHEESE |
||||
|
World total |
1 065 |
1 096 |
1 183 |
1 168 |
|
Russian Fed. |
124 |
84 |
60 |
65 |
|
Japan |
159 |
183 |
187 |
197 |
|
United States |
151 |
171 |
203 |
190 |
|
EC |
96 |
129 |
149 |
139 |
|
International prices of milk and milk products
1 |
||||||||||
|
|
1996 |
1997 |
1998 |
1999 |
2000 |
2001 |
2001 |
2001 |
2001 |
2001 |
|
Whole milk powder |
1 959 |
1 758 |
1 701 |
1 477 |
1 847 |
2 007 |
2 025 |
2 017 |
2 017 |
1 969 |
|
Skimmed milk powder |
1 922 |
1 735 |
1 444 |
1 319 |
1 871 |
2 073 |
2 158 |
2 071 |
2 075 |
19 88 |
|
Butter |
1 698 |
1 540 |
1 715 |
1 331 |
1 204 |
1 316 |
1 225 |
1 317 |
1 371 |
1 350 |
|
Cheddar cheese |
2117 |
2165 |
2008 |
1752 |
1835 |
2134 |
1992 |
2113 |
2175 |
2257 |
1 Mid pointf.o.b. prices reported by New Zealand Dairy Board.World Milk Production
1/ Exports
|
Cotton production 1 |
||||
|
|
1996-98 |
1999/00 |
2000/01 * |
2001/02 ** |
|
‘000 tonnes |
||||
|
World total |
19 432 |
18 887 |
19 173 |
20 329 |
|
United States |
3 749 |
3 694 |
3 742 |
4 165 |
|
China 2 |
4 435 |
3 830 |
4 420 |
4 650 |
|
India |
2 807 |
2 650 |
2 350 |
2 723 |
|
Pakistan |
1 545 |
1 800 |
1 750 |
1 624 |
|
Area of former USSR |
1 474 |
1 597 |
1 392 |
1 457 |
|
Turkey |
835 |
795 |
880 |
880 |
|
Australia |
676 |
733 |
704 |
737 |
|
EC |
449 |
553 |
519 |
482 |
|
Argentina |
275 |
130 |
168 |
120 |
|
Brazil |
413 |
648 |
858 |
893 |
|
Egypt |
306 |
229 |
206 |
272 |
|
Others |
2 468 |
2 228 |
2 184 |
2 326 |
Source: ICAC-Cotton: Review of the World Situation, various issues.1 Season beginning 1 August.
2 Hong Kong SAR and Province of Taiwan do not produce cotton.
* Preliminary.
** Estimates.
|
Cotton exports 1 |
||||
|
|
1996-98 |
1999/00 |
2000/01 * |
2001/02 ** |
|
‘000 tonnes |
||||
|
World total |
5 772 |
6 054 |
5 700 |
6 153 |
|
United States |
1 358 |
1 481 |
1 459 |
1 851 |
|
Area of former USSR |
1 376 |
1 312 |
1 213 |
1 121 |
|
Australia |
585 |
710 |
719 |
664 |
|
EC |
294 |
382 |
332 |
335 |
|
Argentina |
225 |
80 |
100 |
70 |
|
Mali |
196 |
168 |
125 |
177 |
|
Pakistan |
34 |
150 |
115 |
90 |
|
Syria |
199 |
180 |
255 |
183 |
|
Benin |
134 |
146 |
134 |
136 |
|
Sudan |
76 |
37 |
22 |
71 |
|
Egypt |
75 |
100 |
85 |
100 |
|
China 2 |
71 |
388 |
106 |
110 |
|
Others |
1 151 |
920 |
1 035 |
1 245 |
Source: ICAC-Cotton: Review of the World Situation, various issues.1 Season beginning 1 August.
2 Hong Kong SAR and Province of Taiwan do not export cotton.
* Preliminary.
** Estimates.
|
Cotton stocks 1 |
||||
|
|
1996-98 |
1999/00 |
2000/01 * |
2001/02 ** |
|
‘000 tonnes |
||||
|
World total |
9 745 |
8717 |
8238 |
8668 |
|
China 2 |
4 220 |
2890 |
2285 |
2085 |
|
India |
968 |
910 |
848 |
880 |
|
United States |
856 |
860 |
1215 |
1682 |
|
Area of former USSR |
457 |
524 |
382 |
470 |
|
Pakistan |
336 |
463 |
388 |
391 |
|
EC |
233 |
228 |
266 |
244 |
|
Brazil |
341 |
370 |
500 |
456 |
|
Argentina |
209 |
141 |
142 |
110 |
|
Australia |
383 |
431 |
450 |
493 |
|
Japan |
80 |
67 |
64 |
58 |
|
Turkey |
186 |
302 |
280 |
326 |
|
Others |
1 475 |
1 531 |
1418 |
1473 |
Source: ICAC-Cotton: Review of the World Situation, various issues.1 Season beginning 1 August.
2 Including Hong Kong SAR and Province of Taiwan.
* Preliminary.
** Estimates
|
Cotton imports 1 |
||||
|
|
1996-98 |
1999/00 |
2000/01 * |
2001/02 ** |
|
‘000 tonnes |
||||
|
World total |
5787 |
5811 |
5700 |
6153 |
|
EC |
991 |
893 |
887 |
876 |
|
China 2 |
830 |
459 |
434 |
480 |
|
Brazil |
408 |
259 |
140 |
114 |
|
Area of former USSR |
305 |
409 |
404 |
447 |
|
Indonesia |
464 |
455 |
510 |
547 |
|
Korea, Rep. |
313 |
360 |
315 |
321 |
|
Thailand |
283 |
302 |
360 |
367 |
|
Japan |
281 |
276 |
242 |
239 |
|
Turkey |
327 |
459 |
325 |
375 |
|
Mexico |
283 |
436 |
414 |
416 |
|
Others |
1301 |
1503 |
1669 |
1971 |
Source: ICAC-Cotton: Review of the World Situation, various issues.1 Season beginning 1 August.
2 Including Hong Kong SAR and Province of Taiwan which import cotton.
* Preliminary.
** Estimates.
|
Prices 1 |
||||
|
|
1996-98 |
1999 |
2000 |
20012 |
|
COTLOOK ‘A’ Index |
167 |
119 |
133 |
115 |
1 Season beginning 1 August.COTTON WORLD PRODUCTION
2 Average until end September 2001.
|
Jute, kenaf and allied fibres - production of fibres 1 |
||||
|
|
1996/97- 1998/99 |
1999/00 |
2000/01 |
2001/02 |
|
‘000 tonnes |
||||
|
World total |
3 378 |
2 565 |
2 605 |
2 951 |
|
India |
1 761 |
1 530 |
1 620 |
1 800 |
|
Bangladesh |
1 052 |
732 |
720 |
876 |
|
China |
347 |
164 |
126 |
136 |
|
Thailand |
88 |
30 |
30 |
30 |
|
Myanmar |
35 |
27 |
28 |
28 |
|
Viet Nam |
17 |
9 |
9 |
9 |
|
Nepal |
15 |
15 |
15 |
16 |
|
Brazil |
11 |
8 |
8 |
8 |
|
Indonesia |
5 |
7 |
7 |
7 |
|
Sudan |
3 |
3 |
3 |
3 |
|
Egypt |
2 |
0 |
0 |
0 |
|
Others |
41 |
40 |
38 |
38 |
1 Crop year beginning 1 July.
|
Jute, kenaf and allied fibres - exports of fibres and products 1 |
||||
|
|
1996/97- 1998/99 |
1999/00 |
2000/01 |
2001/02* |
|
‘000 tonnes |
||||
|
FIBRES 1 |
||||
|
World |
394 |
327.3 |
305.0 |
311.0 |
|
Bangladesh |
369 |
297.2 |
279.2 |
288.0 |
|
China, Main |
2 |
0.7 |
0.5 |
0.5 |
|
Europe 2 |
11 |
11.3 |
11.1 |
10.0 |
|
Myanmar |
4 |
9.3 |
5.7 |
5.0 |
|
Nepal |
0 |
0.0 |
0.0 |
0.0 |
|
Thailand |
3 |
2.5 |
3.5 |
3.0 |
|
United States |
1 |
2.1 |
2.0 |
1.5 |
|
Viet Nam |
3 |
3.0 |
2.0 |
2.0 |
|
Others |
1 |
1.2 |
1.0 |
1.0 |
|
PRODUCTS 3 |
1996-98 Average |
1999 |
2000 |
|
|
World |
394 |
327.3 |
305.0 |
311.0 |
|
Bangladesh |
369 |
297.2 |
279.2 |
288.0 |
|
China, Main |
2 |
0.7 |
0.5 |
0.5 |
|
Europe 2 |
11 |
11.3 |
11.1 |
10.0 |
|
Myanmar |
4 |
9.3 |
5.7 |
5.0 |
|
Nepal |
0 |
0.0 |
0.0 |
0.0 |
|
Thailand |
3 |
2.5 |
3.5 |
3.0 |
|
United States |
1 |
2.1 |
2.0 |
1.5 |
|
Viet Nam |
3 |
3.0 |
2.0 |
2.0 |
|
Others |
1 |
1.2 |
1.0 |
1.0 |
* Estimate
1 Marketing year beginning 1 July.
2 Includes eastern European countries (excludes countries of the area of the former USSR).
3 Products in calendar year.
|
Jute, kenaf and allied fibres - imports of fibres and products |
|||
|
|
1996-98 |
1999 |
2000 |
|
‘000 tonnes |
|||
|
FIBRES 1 |
|||
|
World |
352 |
330.4 |
331.6 |
|
Australia |
5 |
4.8 |
4.8 |
|
Brazil |
8 |
5.6 |
6.0 |
|
China, Main |
96 |
8.7 |
5.0 |
|
Côte d’Ivoire |
19 |
11.0 |
10.0 |
|
Egypt |
12 |
5.8 |
8.5 |
|
Europe |
28 |
24.8 |
23.7 |
|
India |
51 |
160.9 |
130.0 |
|
Indonesia |
6 |
5.9 |
6.0 |
|
Pakistan |
73 |
73.1 |
70.0 |
|
Thailand |
5 |
1.1 |
42.2 |
|
Turkey |
3 |
1.5 |
1.5 |
|
United States |
3 |
2.4 |
2.5 |
|
Others |
44 |
24.8 |
21.4 |
|
PRODUCTS 3 |
1996-98 |
1999 |
2000 |
|
World |
352 |
330.4 |
331.6 |
|
Algeria |
6 |
5.0 |
5.0 |
|
Australia |
37 |
40.4 |
43.0 |
|
Egypt |
12 |
8.1 |
14.3 |
|
Europe 2 |
270 |
218.6 |
208.3 |
|
Indonesia |
7 |
2.4 |
2.5 |
|
Iran |
52 |
55.8 |
56.0 |
|
Japan |
33 |
23.9 |
24.0 |
|
Sudan |
35 |
40.0 |
38.0 |
|
Syria |
43 |
9.3 |
36.9 |
|
Turkey |
59 |
50.7 |
52.0 |
|
United States |
60 |
63.5 |
66.2 |
|
Others |
145 |
132.3 |
124.1 |
1 In calendar year
2 Includes eastern European countries (excludes countries of the former USSR).
|
Closing stocks 1 |
||||
|
|
1997/98 |
1998/99 |
1999/00 |
2000/01 |
|
‘000 tonnes |
||||
|
World total 2 |
1 021.5 |
889.2 |
625.1 |
487.2 |
|
Bangladesh |
367.4 |
317.5 |
175.5 |
84.4 |
|
India |
474.7 |
390.2 |
257.6 |
212.6 |
|
Thailand |
149.1 |
151.5 |
169.3 |
174.2 |
1 As at 30 June of the second year shown.
2 Includes only Bangladesh, India, Myanmar, Nepal and Thailand.
|
Prices (fob) |
|||||
|
|
1997 |
1998 |
1999 |
2000 |
2001 |
|
$/tonne |
|||||
|
Jute (BWD Grade) |
302.0 |
259.3 |
277.2 |
279.0 |
328.31 |
|
Polypropylene (Raffia) |
837.0 |
656.0 |
652.0 |
778.0 |
764.32 |
|
|
$/100 yards |
||||
|
Hessian (40” x 10 oz) |
21.3 |
16.9 |
17.9 |
19.5 |
19.83 |
|
|
$/100 bags |
||||
|
Sacking (B-Twills) |
58.9 |
45.0 |
40.3 |
40.0 |
40.73 |
1 - Jan-October 2001; 2Jan-June 2001; 3Jan-March 2001JUTE FIBRE WORLD EXPORTS '000 tonnes
JUTE FIBRE WORLD PRODUCTION '000 tonnes
|
Production of hard fibres |
||||
|
|
1996-98 |
1999 |
2000 |
2001 Prov. |
|
‘000 tonnes |
||||
|
Sisal and henequen |
346.3 |
306.2 |
303.6 |
322.0 |
|
Kenya |
23.2 |
21.9 |
11.5 |
20.7 |
|
Tanzania |
23.0 |
20.6 |
20.5 |
22.1 |
|
Brazil |
125.1 |
110.0 |
125.0 |
130.0 |
|
Abaca |
84.3 |
86.53 |
88.26 |
89.50 |
|
Philippines |
68.7 |
71.24 |
73.50 |
75.00 |
|
Coir fibre (Brown) |
244.9 |
305.9 |
315.4 |
317.3 |
|
India |
176.0 |
236.0 |
246.0 |
251.0 |
|
Sri Lanka |
58.8 |
55.2 |
55.1 |
52.2 |
|
Coir yarn 1 |
212.5 |
228.0 |
241.2 |
252.6 |
1 Including yarn from brown fibre.
|
Exports of hard fibres and products |
||||
|
|
1996-98 |
1999 |
2000 |
2001 Prov. |
|
‘000 tonnes |
||||
|
FIBRES |
||||
|
Sisal and henequen |
70.13 |
69.28 |
70.82 |
75.17 |
|
Kenya |
19.93 |
16.20 |
15.63 |
15.90 |
|
Tanzania |
6.65 |
12.50 |
11.49 |
12.55 |
|
Brazil |
32.31 |
28.18 |
29.80 |
32.00 |
|
Abaca |
31.44 |
32.85 |
34.98 |
35.30 |
|
Ecuador |
13.28 |
13.05 |
12.52 |
12.50 |
|
Philippines |
17.82 |
19.20 |
20.96 |
21.50 |
|
Coir fibre (brown) |
59.04 |
58.33 |
59.62 |
58.00 |
|
Sri Lanka |
49.75 |
46.82 |
46.70 |
44.25 |
|
Coir yarn 2 |
19.13 |
14.68 |
22.62 |
23.12 |
|
India |
15.36 |
10.09 |
16.00 |
17.00 |
|
Sri Lanka |
3.08 |
3.97 |
5.73 |
5.62 |
|
PRODUCTS |
||||
|
Sisal and henequen |
132.99 |
114.06 |
119.94 |
128.07 |
|
Brazil |
63.90 |
56.60 |
62.00 |
65.00 |
|
Tanzania |
7.50 |
1.99 |
3.17 |
7.97 |
|
Abaca 3/ |
39.71 |
36.83 |
42.83 |
43.81 |
|
Philippines |
38.73 |
36.22 |
42.28 |
43.41 |
|
Coir |
34.70 |
40.89 |
45.48 |
48.68 |
|
India |
25.06 |
30.62 |
36.96 |
41.36 |
|
EU |
5.69 |
4.58 |
3.22 |
... |
1 Including yarn from decorticated fibre
2 From the fibre producing countries
3 In fibre equivalent
|
Imports of hard fibres |
|||
|
|
1996-98 |
1999 |
2000 |
|
‘000 tonnes |
|||
|
FIBRES: |
|||
|
Sisal and henequen |
70.28 |
64.01 |
57.36 |
|
EU |
47.45 |
43.58 |
33.56 |
|
Abaca |
32.55 |
32.69 |
34.57 |
|
EU |
15.52 |
18.59 |
21.76 |
|
United States |
8.74 |
6.59 |
6.80 |
|
Coir fibre |
59.03 |
58.30 |
63.00 |
|
Coir yarn |
22.65 |
18.74 |
21.14 |
|
EU |
13.52 |
11.66 |
14.13 |
|
United States |
4.36 |
2.15 |
2.00 |
|
PRODUCTS: |
|||
|
Sisal and Henequen |
116.52 |
86.14 |
91.69 |
|
EU |
30.08 |
24.66 |
23.93 |
|
Canada |
8.76 |
6.4 |
6.7 |
|
United States |
58.66 |
37.2 |
42.0 |
|
Abaca (Cordage) |
11.43 |
10.83 |
11.43 |
|
EU |
1.79 |
2.05 |
2.02 |
|
United States |
6.09 |
5.19 |
6.00 |
|
Coir (Mats) |
30.86 |
37.22 |
37.63 |
|
EU |
20.58 |
22.02 |
20.47 |
|
United States |
6.17 |
9.67 |
12.00 |
|
Prices of hard fibres |
|||||
|
|
1997 |
1998 |
1999 |
2000 |
2001 |
|
Sisal |
US$/tonne (cif) |
||||
|
East African UG |
924.6 |
965.4 |
871.3 |
785.0 |
855.61 |
|
East African 3L |
780.8 |
822.5 |
688.3 |
635.0 |
711.11 |
|
Brazil N.3 |
647.1 |
577.9 |
526.7 |
442.0 |
456.71 |
|
Abaca |
US$/bale (fob) |
||||
|
S2 |
184.3 |
147.2 |
173.8 |
159.6 |
122.42 |
|
G |
147.4 |
132.4 |
153.7 |
138.8 |
111.42 |
|
JK |
145.4 |
121.4 |
125.6 |
112.4 |
103.22 |
|
Indicator |
|
|
|
|
|
|
(average) |
59.03 |
133.64 |
152.81 |
136.94 |
112.33 |
1 Jan-Sept.HARD FIBRES: PRODUCTION - '000 tonnes
2 Jan-Oct.
HARD FIBRES: RAW FIBRES EXPORTS - '000 tonnes
HARD FIBRES: PRODUCTS EXPORTS '000tonnes
|
Natural rubber production |
||||
|
|
1996-98 |
1999 |
2000 1 |
2001 2 |
|
World |
6 580 |
6 810 |
6 810 |
7 150 |
|
Thailand |
2 026 |
2 155 |
2 346 |
2 420 |
|
Indonesia |
1 582 |
1 599 |
1 556 |
1 610 |
|
Malaysia |
980 |
769 |
615 |
560 |
|
India |
571 |
620 |
629 |
645 |
|
China |
441 |
460 |
445 |
439 |
|
Sri Lanka |
105 |
97 |
88 |
85 |
|
Viet Nam |
217 |
230 |
269 |
280 |
|
Côte d'Ivoire |
102 |
120 |
113 |
105 |
|
Nigeria |
74 |
58 |
63 |
64 |
|
Brazil |
58 |
70 |
72 |
73 |
|
Others |
424 |
633 |
614 |
869 |
Source: IRSG - Rubber Statistical Bulletin, various issues and FAO.1 Preliminary
2 Estimates.
|
Natural rubber exports |
||||
|
|
1996-98 |
1999 |
2000 1 |
2001 2 |
|
World |
4 623 |
4 670 |
4 970 |
4 800 |
|
Indonesia |
1 493 |
1 495 |
1 380 |
1 400 |
|
Thailand |
1 813 |
1 886 |
2 166 |
2 250 |
|
Malaysia |
574 |
436 |
196 |
150 |
|
Sri Lanka |
58 |
43 |
33 |
34 |
|
Viet Nam |
193 |
230 |
256 |
260 |
|
Nigeria |
59 |
38 |
43 |
44 |
|
Liberia |
57 |
100 |
127 |
130 |
|
Guatemala |
28 |
27 |
30 |
30 |
|
Cambodia |
32 |
34 |
35 |
38 |
|
Others |
316 |
382 |
704 |
464 |
Source: IRSG - Rubber Statistical Bulletin, various issues and FAO.1 Preliminary
2 Estimates.
|
Closing stocks1 |
||||
|
|
1996-98 |
1999 |
2000 2 |
2001 3 |
|
‘000 tonnes |
||||
|
World |
2 210 |
2 560 |
2 030 |
1 915 |
|
Producing countries |
590 |
880 |
680 |
641 |
|
Consuming countries |
773 |
840 |
1010 |
953 |
|
Stocks Afloat |
847 |
840 |
340 |
321 |
1 As at 31 December.
2 Preliminary.
3 Estimates.
|
Natural rubber imports |
||||
|
|
1996-98 |
1999 |
2000 1 |
2001 2 |
|
‘000 tonnes |
||||
|
World |
4 524 |
4 699 |
5 300 |
4850 |
|
United States |
1 078 |
1 116 |
1 192 |
980 |
|
Japan |
711 |
755 |
802 |
760 |
|
China |
421 |
402 |
820 |
860 |
|
Korea, Rep. of |
294 |
332 |
331 |
330 |
|
Germany |
217 |
226 |
250 |
245 |
|
France |
199 |
253 |
309 |
301 |
|
Spain |
146 |
161 |
171 |
168 |
|
Canada |
133 |
141 |
150 |
140 |
|
United Kingdom |
124 |
131 |
133 |
130 |
|
Brazil |
108 |
98 |
139 |
140 |
|
Others |
1 095 |
1 084 |
1 004 |
796 |
Source: IRSG - Rubber Statistical Bulletin, various issues and FAO.1 Preliminary
2 Estimates.
|
Natural rubber prices |
||||
|
|
1996-98 |
1999 |
2000 1 |
2001 2 |
|
national currency/kg |
||||
|
London (pence) |
||||
|
RSS1 cif |
69.1 |
44.6 |
50.6 |
49.2 |
|
SMR 20 cif |
65.8 |
41.6 |
47.3 |
43.2 |
|
Kuala Lumpur (M. cents) |
||||
|
RSS1 cif |
303.9 |
240.4 |
262.4 |
237.1 |
|
SMR 20 cif |
287.8 |
227.5 |
243.3 |
214.0 |
1 Average to July 30 2001.NATURAL RUBBER: WORLD PRODUCTION '000 tonnes
NATURAL RUBBER: EXPORTS '000 tonnes
|
Production of hides and skins |
|||||
|
|
1995-97 |
1998 |
1999 |
2000 1 |
2001 2 |
|
BOVINE HIDES AND SKINS |
|||||
|
World total |
5 594.2 |
5664.4 |
5698.7 |
5806.0 |
5750.0 |
|
United States |
949.8 |
928.5 |
941.0 |
941.0 |
895.7 |
|
EC3 |
719.8 |
695.1 |
688.7 |
693.3 |
643.5 |
|
Brazil |
501.5 |
563.7 |
569.7 |
628.0 |
646.8 |
|
Area of former USSR |
671.6 |
566.0 |
548.4 |
578.4 |
521.0 |
|
China |
442.8 |
542.1 |
562.1 |
578.0 |
597.1 |
|
India |
388.2 |
389.0 |
394.0 |
401.0 |
407.2 |
|
Argentina |
257.2 |
246.1 |
254.0 |
254.0 |
255.9 |
|
Developing countries |
2 717.9 |
2 910.2 |
2 962.8 |
3 048.7 |
3 140.0 |
|
Developed countries |
2 876.4 |
2 754.2 |
2 735.9 |
2 757.4 |
2 610.0 |
|
SHEEPSKINS |
|||||
|
World total |
396.9 |
390.9 |
394.7 |
393.9 |
|
|
China |
39.9 |
42.0 |
44.0 |
46.7 |
|
|
New Zealand |
44.2 |
43.7 |
41.4 |
41.4 |
|
|
Australia |
36.3 |
37.7 |
39.2 |
36.9 |
|
|
Iran, Islamic Rep. of |
27.9 |
28.6 |
28.8 |
28.8 |
|
|
Developing countries |
194.2 |
168.5 |
204.2 |
207.0 |
|
|
Developed countries |
202.7 |
192.3 |
190.5 |
186.9 |
|
|
GOATSKINS |
|||||
|
World total |
219.7 |
235.2 |
239.6 |
242.7 |
|
|
India |
69.0 |
70.4 |
71.0 |
71.3 |
|
|
China |
41.5 |
53.6 |
56.2 |
59.2 |
|
|
Pakistan |
15.5 |
15.3 |
16.3 |
16.3 |
|
|
Developing countries |
207.1 |
222.9 |
227.5 |
230.6 |
|
|
Developed countries |
12.6 |
12.3 |
12.1 |
12.0 |
|
1 Preliminary.
2 Estimate.
3 EC trade is given as the sum of 15 countries, includes trade within the EC
|
Exports of hides and skins |
||||
|
|
1995-97 |
1998 |
1999 |
2000 1 |
|
‘000 tonnes |
||||
|
BOVINE HIDES AND SKINS |
||||
|
World total |
2 214.8 |
2 096.5 |
2 145.3 |
2 190.0 |
|
EC2 |
669.5 |
644.3 |
686.3 |
710.0 |
|
United States |
731.8 |
570.3 |
518.1 |
510.0 |
|
Area of former USSR |
255.8 |
307.9 |
329.9 |
320.0 |
|
Australia |
92.3 |
109.2 |
118.0 |
115.0 |
|
Developing countries |
241.4 |
242.9 |
260.4 |
300.0 |
|
Developed countries |
1 973.4 |
1 853.6 |
1 884.9 |
1 890.0 |
|
SHEEPSKINS |
||||
|
World total |
176.1 |
160.5 |
169.4 |
170.0 |
|
Australia |
28.4 |
30.1 |
38.2 |
38.0 |
|
New Zealand |
22.0 |
20.2 |
23.5 |
24.0 |
|
Iran, Islamic Rep. of |
24.8 |
23.0 |
24.0 |
24.0 |
|
United Kingdom |
18.8 |
20.2 |
19.7 |
19.0 |
|
Developing countries |
46.2 |
50.4 |
50.3 |
42.0 |
|
Developed countries |
129.9 |
110.1 |
119.1 |
128.0 |
|
GOATSKINS |
||||
|
World total |
22.6 |
17.4 |
18.0 |
18.0 |
|
China 3 |
9.1 |
5.1 |
7.5 |
7.5 |
|
EC 2 |
2.4 |
2.2 |
1.1 |
1.2 |
|
South Africa |
0.7 |
0.6 |
0.2 |
0.0 |
|
Developing countries |
18.3 |
14.0 |
16.1 |
16.0 |
|
Developed countries |
4.3 |
3.4 |
1.9 |
2.0 |
1 Preliminary.
2 EC trade is given as the sum of 15 countries, includes trade within the EC.
3 Including Hong Kong and Taiwan Province.
|
Prices of hides and skins |
|||||
|
|
1995-97 |
1998 |
1999 |
2000 |
2001 |
|
1991 April = 100 |
|||||
|
Bovine hides |
124.8 |
113.4 |
99.5 |
125.5 |
150.3 |
|
Sheepskins |
170.1 |
125.5 |
89.1 |
122.5 |
147.3 |
|
Goatskins |
107.4 |
93.1 |
72.7 |
66.3 |
90.5 |
Source: International Trade Centre, Geneva.
|
Imports of hides and skins |
||||
|
|
1995-97 |
1998 |
1999 |
2000 1 |
|
‘000 tonnes |
||||
|
BOVINE HIDES AND SKINS |
||||
|
World total |
2 253.4 |
2 175.8 |
2218.2 |
2 270.0 |
|
Italy |
511.3 |
483.6 |
434.5 |
460.0 |
|
Korea, Rep. of |
328.8 |
228.9 |
255.2 |
260.0 |
|
Japan |
143.2 |
96.8 |
107.2 |
107.2 |
|
China 2 |
402.1 |
417.0 |
485.8 |
400.0 |
|
Developing countries |
994.3 |
979.3 |
1 061.6 |
1 100.0 |
|
Developed countries |
1 259.2 |
1 196.6 |
1 156.5 |
1 170.0 |
|
SHEEPSKINS |
||||
|
World total |
183.2 |
168.9 |
173.2 |
173.0 |
|
EC3 |
66.5 |
53.7 |
50.8 |
52.0 |
|
Turkey |
50.6 |
51.2 |
55.0 |
55.0 |
|
Korea, Rep. Of |
5.0 |
4.9 |
5.1 |
5.1 |
|
Developing countries |
94.1 |
97.5 |
107.0 |
107.0 |
|
Developed countries |
89.2 |
71.4 |
66.2 |
66.0 |
|
GOATSKINS |
||||
|
World total |
24.4 |
17.6 |
18.3 |
18.3 |
|
EC3 |
5.2 |
4.3 |
2.3 |
2.2 |
|
Lebanon |
3.3 |
3.3 |
3.2 |
3.2 |
|
Mexico |
0.7 |
0.9 |
0.8 |
0.0 |
|
Developing countries |
13.7 |
9.3 |
12.1 |
12.0 |
|
Developed countries |
10.7 |
8.4 |
6.2 |
6.3 |
1 Preliminary.BOVINE HIDES AND SKINS - WORLD TOTAL
2 Including Hong Kong and Taiwan Province.
3 EC trade is given as the sum of 15 countries, includes trade within the EC.
![]()
![]()
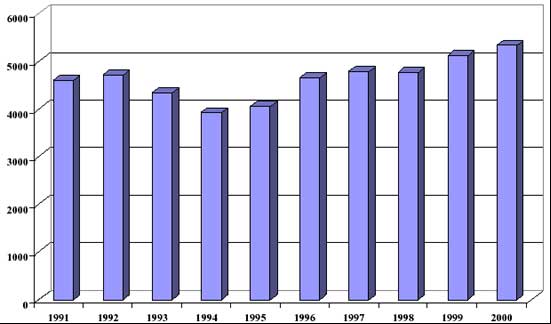
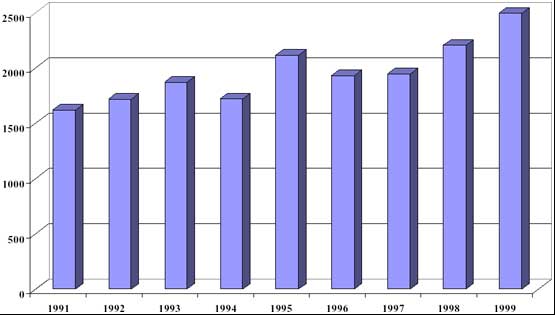
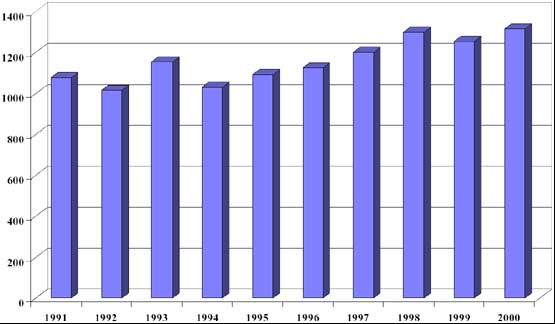
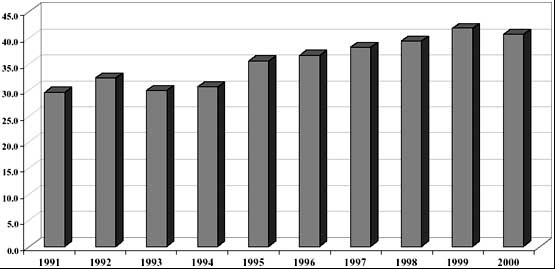
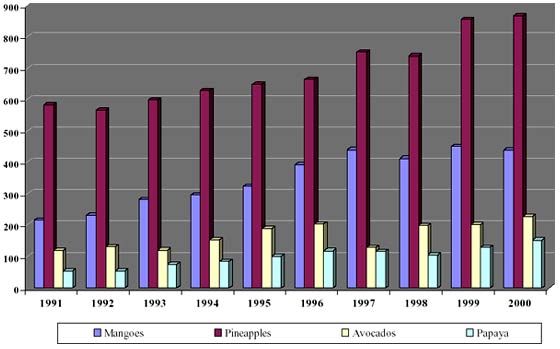
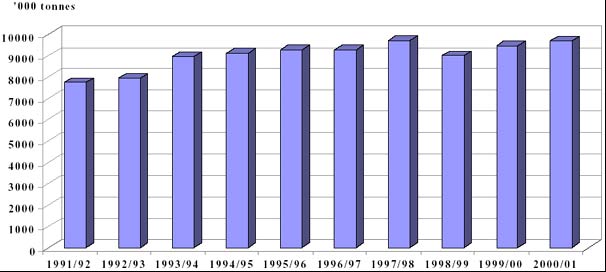
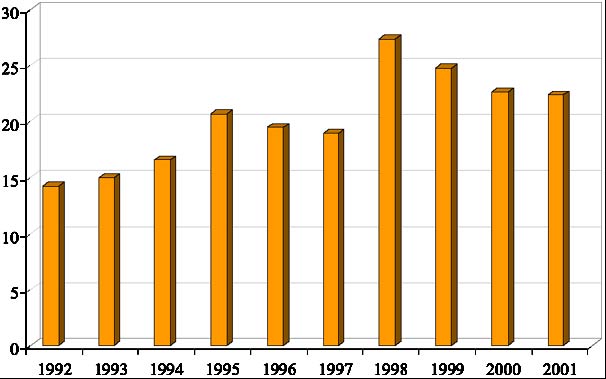
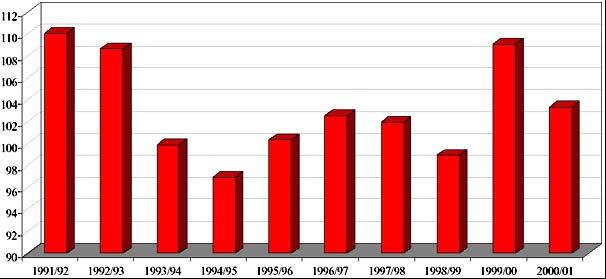
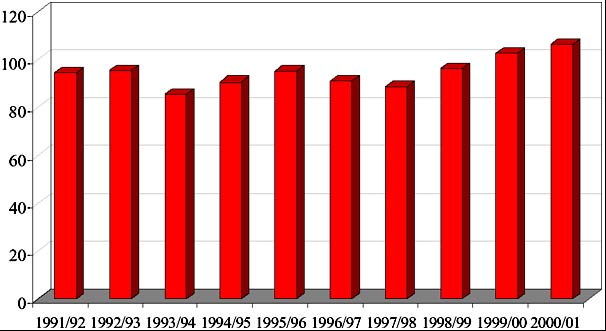
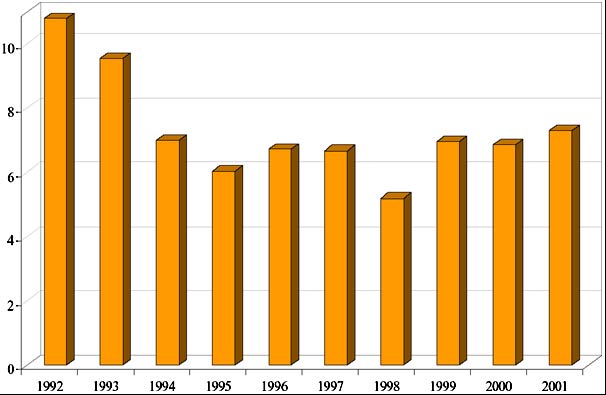
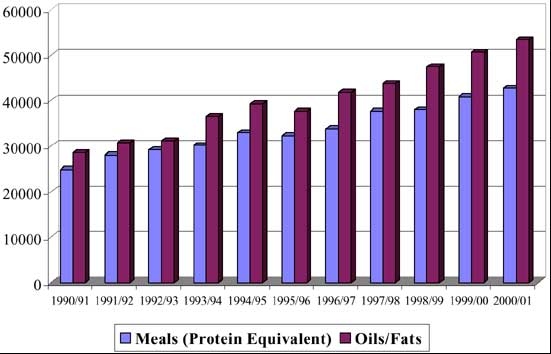
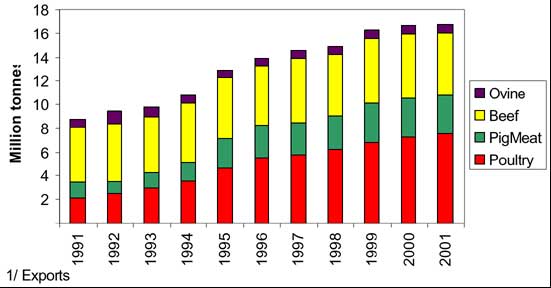
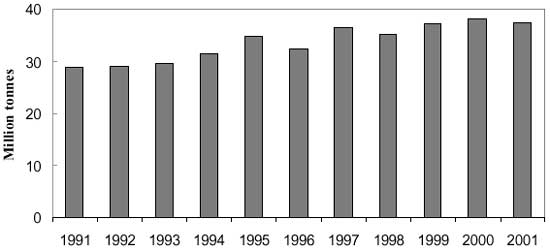
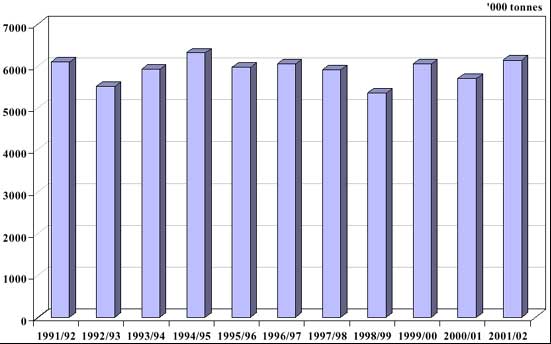
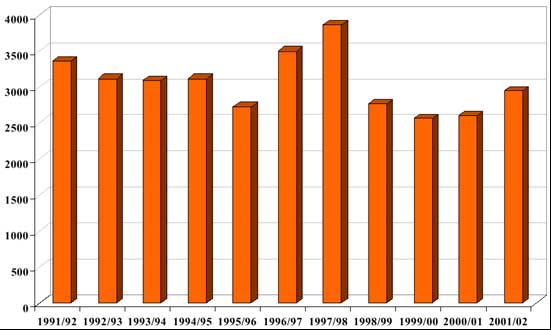
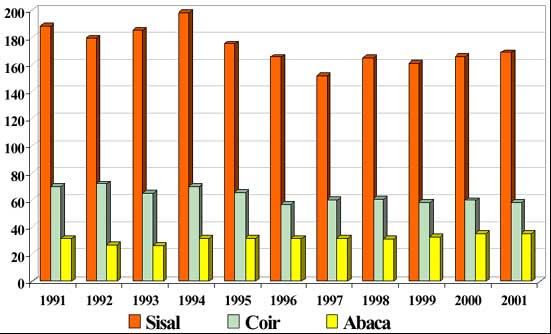
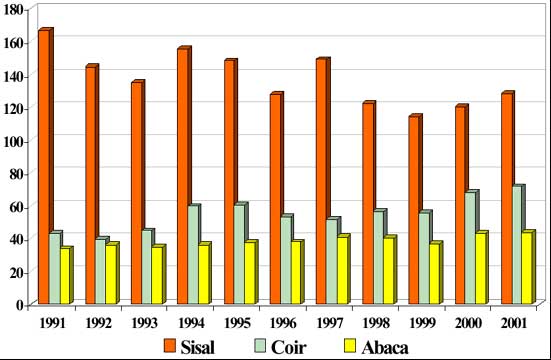
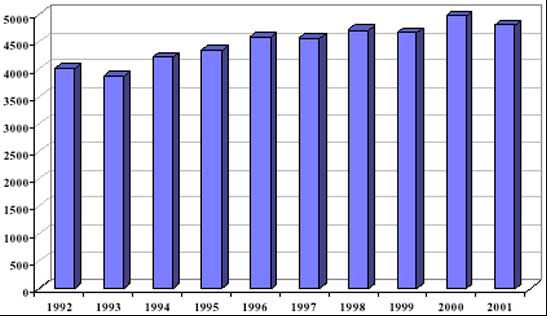
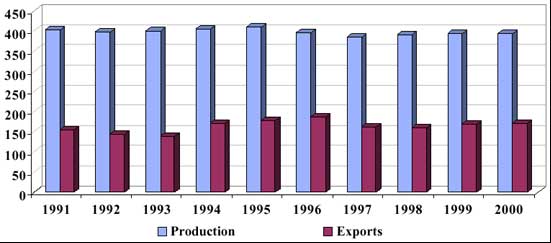
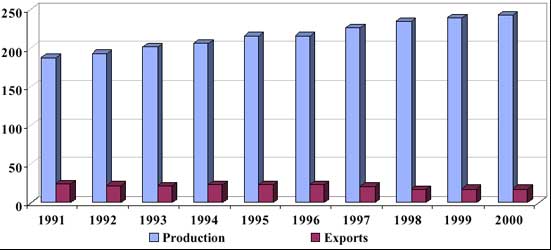