![]()
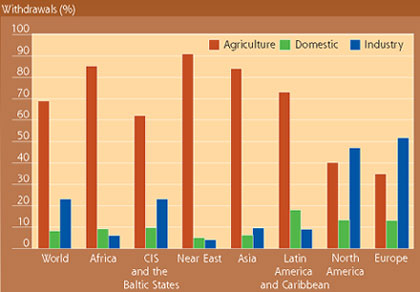
Currently, about 3600 km3 of freshwater are withdrawn for human use - the equivalent of 580 m3 per capita per year. The bar chart on the right shows that, in all regions except Europe and North America, agriculture is by far the biggest user of water, accounting worldwide for about 69 percent of all withdrawals, with domestic (municipal) use amounting to about 10 percent and industry using some 21 percent.
Estimated global water withdrawal (km3 per year, m3 per capita and as a percentage of total withdrawal) | ||
1950 |
1995 | |
Agriculture |
||
withdrawal |
1100 |
2500 |
per capita |
437 |
436 |
percentage of total |
79 |
69 |
Industries |
||
withdrawal |
200 |
750 |
per capita |
79 |
131 |
percentage of total |
14 |
21 |
Municipalities |
||
withdrawal |
100 |
350 |
per capita |
40 |
61 |
percentage of total |
7 |
10 |
Total |
||
withdrawal |
1 400 |
3 600 |
per capita |
556 |
628 |
percentage of total |
100 |
100 |
Note: All numbers are rounded. | ||
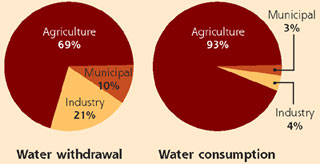
It is important to distinguish between water that is withdrawn and water that is actually consumed. Of the 3600 km3 of water withdrawn annually, roughly half of it is consumed as a result of evaporation and transpiration from plants. Water that is abstracted but not consumed, by contrast, flows back over the surface to rivers or infiltrates the ground and is stored in aquifers. However this water is generally of a lower quality than the water that was withdrawn. Irrigation consumes much of the water it withdraws (often half or more) as a result of evaporation, incorporation into crops and transpiration from crops. The other half recharges groundwater or surface flows or is lost in unproductive evaporation.
|
Water withdrawals by region and by sector  |
Up to 90 percent of the water withdrawn for domestic use is returned to rivers and aquifers as wastewater. Industries typically consume only about 5 percent of the water they withdraw. Wastewater from domestic sewage systems and industries should be treated before it is released into rivers and possibly re-used but it is often heavily polluted.
Figures for water withdrawal in agriculture do not include the direct use that is made of rainwater in rainfed agriculture. In fact, more food is produced from the direct use of rainwater than from the use of irrigation water - and even irrigated agriculture uses considerable rainwater.
These figures highlight the importance of agriculture in the challenge of making the Earth's available water serve the needs of its growing number of users. The water needed for crops amounts to 1000-3000 m3 per tonne of cereal harvested. Put another way, it takes 1-3 tonnes of water to grow 1 kg of rice. Good land management can significantly reduce the amount of water needed to produce a tonne of cereal, both in rainfed and irrigated agriculture.
|
Water withdrawal and water consumption for the three main use sectors (1995)  |
|
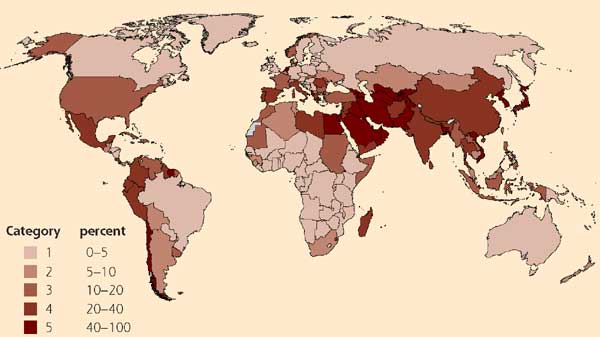
Area equipped for irrigation as a percentage of cultivated land (1998)  |
Map highlights countries where irrigation plays an extremely important (category 5) and a major role(category 4) in agriculture. Irrigation is little used in northern temperate zones and in sub-Saharan Africa.
While much can be done to increase the crop/drop yield in rainfed agriculture, most of the attention currently focuses on irrigated agriculture which relies mainly on water that runs into rivers or is stored in aquifers. As the map above shows, many developing countries rely heavily on irrigation. In an FAO analysis of 93 developing countries, it was found that 18 of them use irrigated agriculture on more than 40 percent of their cultivated land; an additional 18 countries irrigate between 20 and 40 percent of their cultivated area (FAO, World Agriculture: Towards 2015/2030).
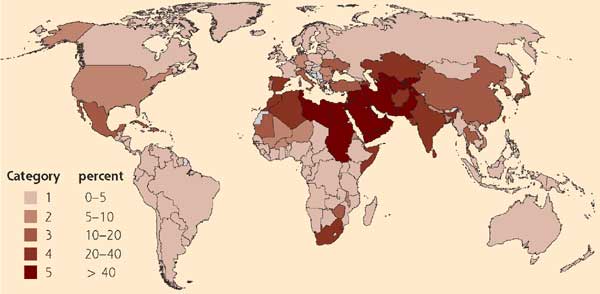
Inevitably, such an intensive use of water for agriculture can strain resources. The map below shows that, 20 countries are in a critical condition in that more than 40 percent of their renewable water resources are used for withdrawals for agriculture. Countries could be defined as water stressed if they abstract more than 20 percent of their renewable water resources. By this definition, 36 of 159 countries (23 percent) were already water stressed in 1998.
|
Agricultural water withdrawals as a percentage of total renewable water resources, 1998 
Map showing where withdrawals for agriculture are critically high (category 5) and indicative of water stress (category 4). |