


Short articles reporting on the state and future of forest assessment in Poland, Mexico and South Africa, and brief summaries of national forest inventory experiences in seven other countries.1
Roman Michalak
|
Poland - linkages between national information needs and international reporting requirements
Poland's forestry information system has been largely shaped by the forest ownership structure over the past 50 years. In 2001, about 80 percent of the country's forests were held by the State, while the rest belonged to about 1 million private owners. The information system has also been greatly influenced by the political and economic priority given to wood and other commercial forest products, especially before 1989. For almost 40 years after the Second World War, ample forest inventory data were collected to provide information needed for forest management at the local level, but forest information at the national level was of secondary importance. National statistics were published by the Main Statistical Office, but most economic and environmental decisions were taken at the local level.
The core of the national database was input from State forests based on forest management plans. As part of the planning process, every forest district received an assessment report for each stand, updated maps and sets of plans that were valid for the next ten years. The district forest services continuously supplemented these detailed stand descriptions with information about operations undertaken.
Essential information in the national database - age class tables by dominant species in terms of area and volume - was updated annually with:
There was no updating of original inventory data at the local level. The accuracy and timeliness of data on forests not owned by the State varied.
Because the source data were collected according to the same nationally applied methods and were of relatively high quality, and because the information generated was strictly for internal use by the forest sector (with public access tightly limited), the system seemed to be efficient and sufficient until the late 1970s.
The environmental disaster of the 1980s, taking the form of permanent deforestation in southern Poland, together with the political and economic breakdown of 1989, revealed the weaknesses of the information system. The main flaws were the long (ten-year) time interval for data collection, the limited extent of the information collected and especially the lack of data about the health of the forests. Growing public awareness of environmental problems and the need for policy-makers to address the issue resulted in a rapid increase in demand for relevant data. With prompt action, four State forest health inventories were conducted in the 1980s and forest health monitoring was established under the United Nations Economic Commission for Europe (UNECE) International Co-operative Programme on Assessment and Monitoring of Air Pollution Effects on Forests (ICP Forests) in 1989.
The continuing increase in international political activity prompted the third stage of development of the national information system. The standard template for criteria and indicators of sustainable forest management created by the Ministerial Conference for the Protection of Forests in Europe was adapted to Polish conditions and applied as a reference system for existing data sets. On the basis of this work, political decisions were taken to establish new tools for an efficient forest information system. The tools have not yet been put into practice, but this is expected to happen in the near future.
The integrated database system implemented in all districts covers all operations and allows information on forest stands to be continuously updated. The development of information technologies has made it possible to manage the large forest district databases efficiently. The forestry information must by law be accessible to the public. Storing data in electronic form allows this.
The scope of the forest district databases has been broadened to include information about environmental aspects. Site assessments and the evaluation of biological diversity have improved.
Forest information collection activities are often supervised by more than one ministry. Good cooperation makes these activities possible, but they are hindered by a lack of formal regulations, particularly concerning reporting for international assessments.
Poland regards the preparation of country data as only one of several important activities involved in regional and global assessments. Even more important are the incorporation of new demands into the national system and the dissemination of international data. The Global Forest Resources Assessment 2000 (FRA 2000) provided a model for country participation in preparatory work. Unfortunately, global standards have had limited influence on the national system, since there is no efficient mechanism for aligning the definitions used in Poland's classification system with those used internationally.
The most important constraint on the data reporting process is distinguishing the scope and quality of data in the national information system. The reliability of information on above-ground woody biomass, for example (determined according to whether the source was measurement, field assessment or expert opinion), varied for different types of forests and for different types of biomass (see Figure). Similar problems occur with other types of data, especially those that deal with changes in forest resources and data gathered in accordance with new indicators.
The increasing international interest in environmental issues has resulted in a growing number of assessments. These usually rely on national data and use national capacity for data preparation. The increase in workload, however, has not been matched by a growth in country capacity, and the quality of data reporting may soon start to deteriorate. The lack of harmonization among international questionnaires can result either in redundancy or in discrepancies originating from the different recommended methods of data preparation.
General scheme of the origin of data in Poland's wood resources inventory
The process of data collection for the national inventory system should be carefully analysed. The first step is to identify the national demands for forest information. The only questionnaire to date on the needs of forest districts was conducted in 1997. A study of national needs was carried out in 2001. The next step is to promote the collection, interpretation and dissemination of useful data. Permanent rules must be formulated for verification and updating of the data in the national information system.
Participation in international assessments should be integrated into national information system activities. Bilateral benefits would result if international processes were to have a more creative role in the system and if the production of statistics for international use were regarded as an integral part of national reporting. This could be achieved at the international level by:
Stimulating national capacities does not simply mean the direct financing of data collection; investment could be directed to the organization of joint workshops, training sessions, exchange of specialists and even language courses, which facilitate better understanding, communication and cooperation.
Economic changes, the increasing needs of data users and technical progress in inventory methods and techniques are all compelling Poland to modify its forest information system substantially. Local, national and international needs should all be taken into account. The growing importance of environmental concerns should be reflected, although data relating to production will still be gathered.
The increasing international interest in environmental issues observed over the past decade often burdens national systems with extra work, but participation in international programmes provides access to the latest methods, technologies and techniques. Investments in better cooperation in forest assessment should benefit many other fields and lead to improvement of source data quality.
Sebueng Kelatwang is in the Department of Water Affairs and Forestry, South Africa. |
Forest information needs in South Africa
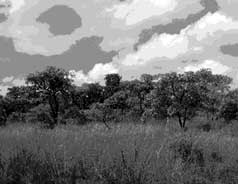
Forest cover in South Africa comprises woodlands, indigenous forest and planta- tions. These resources vary significantly among provinces. Open savannah wood lands cover a large proportion of the country and vary in status, ownership and condition. Of the estimated 690 000 ha of closed canopy forest, 69 percent is owned by the State and 31 percent by private institutions. An estimated 1.3 million hectares of industrial plantations are managed for sustainable production.. About 10 000 to 12 000 ha are planted per year.
In the past, forest information was collected on an ad hoc basis depending on policy demand and donor funding. Currently, the National Forests Act (1998) mandates the Minister for Water Affairs and Forestry to monitor forests according to national criteria and indicators and to report to Parliament at least every three years on facts and trends emerging from monitoring. According to the requirements of the National Environmental Management Act, the report is then submitted to the Department of Environmental Affairs and Tourism, which submits a report on the "state of the environment" to the UN Commission on Sustainable Development.
The demand for forest information has changed dramatically over the past eight years since forest policy underwent a shift in perspective from timber production to social, economic and environmental issues. While the past forest policies focused only on annual roundwood statistics to promote sustainable commercial forestry development, the current forest policy endeavours to promote sustainable forest management for all forest types.
This change in policy perspective has necessitated the need to integrate policy development and implementation with the information gathering process. Accordingly, a Forest Resource Information Service is being established to identify data sources and gaps and to pull together information from different sources. The system is designed to present information in a useful format for policy-making, planning and reporting requirements. The data categories required are being identified on the basis of criteria and indicators of sustainable forest management. These data will come from many sources and parties, and a strategy and plan for accessing and updating such data is still to be developed. The Department of Water Affairs and Forestry collects information on the extent and distribution of all forest types in South Africa. Information on non-wood forest products from State land is collected through licences and exemptions at the local level and aggregated at the national level. The Department of Statistics collects information on utilization of forest resources (fuelwood, non-wood forest products) on communal land. Roundwood statistics are collected through questionnaires. Forest managers at the forest management unit level still collect relevant information regularly to monitor the sustainability of use and conservation.
The various stakeholders are beginning to collaborate to share information and costs for data gathering.
 |
 |
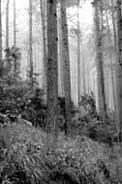 |
South Africa's National Forests Act defined three different types of forests - natural forest, woodland and plantation; the first two are being redefined for alignment with international definitions
- DEPARTMENT OF WATER AFFAIRS AND FORESTRY, SOUTH AFRICA
Different types of forests (including natural forest, woodland and plantation) are defined in the National Forests Act No. 84 of 1998. Because there was some discrepancy between these definitions and those used by FAO, the Department of Water Affairs and Forestry commissioned the Council for Scientific Industrial Research to develop a new classification system for indigenous forests and woodlands, in which definitions would be aligned with international definitions.
In the new definitions, woodlands include those types ranging from wooded grasslands (between 5 and 10 percent canopy cover) to dense thickets (areas with over 75 percent canopy cover but which do not meet the other criteria required to be defined as indigenous forests). This broad woodland category includes vegetation types not traditionally considered true woodlands, but a "true woodland" subcategory was defined within it (tree canopy cover up to 35 percent, with trees responsible for 50 percent of net primary production).
Indigenous forest is defined as "a generally multilayered vegetation unit dominated by trees (largely evergreen or semi-deciduous) whose combined strata have overlapping crowns (i.e. the crown cover is greater than or equal to 75 percent), and where graminoids in the herbaceous stratum (if present) are generally rare". This definition is based on a review of existing definitions of forest used in South Africa, in southern Africa and elsewhere.
In most cases forest inventory has been seen as a technical problem meant merely to describe the extent and distribution of forest in South Africa. Forest monitoring (data gathering and use of criteria and indicators) is linked mainly to regulation, rather than to policy development and review. While the National Forests Act provides a framework for reporting at the national level, this framework is yet to be adhered to in collection and organization of data at the local level.
Time lags in collecting and updating various categories of information at various levels of government depend on policy priorities and availability of resources. Links between national and international reporting requirements are hindered by different categories of information requirements, poor harmonization of forest type definitions and different time frames for collecting and updating information.
Forest policy changes create great challenges in seeking the most cost-effective way of gathering data. Links between policy development and reporting requirements should be an integral component in data collection and regulation. A collaborative network supported by incentives to providers of information is required for the successful implementation of this process. Users of information often fail to take into consideration the constraints faced by institutions that provide information. To ensure a systematic flow of information from the local to the international level, data categories need to be communicated to relevant spheres of government prior to the reporting period. Finally, a system that has the capacity to draw and coordinate the relevant information from different sources is required.
Alejandro Velázquez, Jean-François Mas and José Luis Palacio-Prieto are in the Institute of Geography of the Universidad Nacional Autónoma de México, Morelia, Mexico. Gerardo Bocco is attached to the Institute of Ecology at the same university. |
Land cover mapping to obtain a current profile of deforestation in Mexico
Mexico is highly diverse from both the natural and cultural points of view.
The country encompasses about 2 million square kilometres. Major climatic zones include tropical dry and humid, temperate, arid and semi-arid zones. Forests and other vegetative cover are thus complex and diverse. The tropical and temperate forest cover has diminished by at least 50 percent since the time of the first European settlements (Toledo, 1988; Masera, Ordóñez and Dirzo, 1992).
Estimates of the annual rate of deforestation in Mexico have varied from 370 000 ha (SARH, 1994) to 1.5 million hectares (Toledo, 1988); the divergence cannot be explained by difference in dates alone. These conflicting figures call for repeated, precise and spatially detailed forest inventory. The current Mexican effort, involving government and academic institutions, is producing updated and precise multiple-use land cover information which will help to identify current rates of deforestation and areas with a high conversion rate.
Forest inventory in Mexico traditionally focused on the quantification of available wood resources for productive purposes. More recently, the Ministry of Environment has adopted an approach intended to support increasing demands for data on other forest-related goods and environmental services including water, soils and biodiversity. The inventory aims to provide timely information on the extent, status, changes and sustainable development of Mexico's forests on which to base policy decisions concerning natural resource management. For this there is a need for consistent and complete area coverage, uniform definitions and consistent quality of data collection.
A classification scheme for vegetation and land use was developed over one and a half months through five workshops gathering national experts in vegetation mapping, including staff of the National Institute of Statistics, Geography and Informatics (INEGI). The goal was to generate a compatible and comparable land use and vegetation classification system that could be compared with other mapping efforts at the national scale and would allow land-cover change estimations.
The first step was the selection and acquisition of Landsat ETM+ (high-resolution) images, acquired between November 1999 and April 2000 (Figure 1). The images were geometrically corrected using control points derived from topographic maps at 1:50 000 scale and assembled into 121 image maps, or mosaics of images, according to 121 maps designed by INEGI to cover the whole country at a scale of 1:250 000. A set of colour images was created to identify the best option for visual interpretation. The images were printed at a scale of 1:125 000, which allowed more reliable interpretation and reduction of errors in the final mapping product.
An independent interpretation procedure (based on FAO, 1996) was performed by overlaying on the resulting map a digitized map depicting the land cover types recognized in previous INEGI surveys, reorganized according to the vegetation classification system adopted in the present study. The minimum mapping area was set at 1 km2 on the ground. Botanists expert in specific vegetation types and regions and local INEGI experts supported the interpretations with their specialist and local knowledge.
1 - Steps followed in constructing the current land cover map of Mexico
After careful inspection of potential databases, two were considered suitable for land use and cover change analysis: the so-called INEGI Series I, from 1976, and a database elaborated by the Institute of Geography of the Universidad Nacional Autónoma de México in 2000.
To construct a reliable database label and to shape confidence measurements for the earlier database, 100 points were randomly selected per category and contrasted with ground truthing information. Errors were corrected until the 1976 database was accurate to a 95 percent confidence level for all classes included. Land use and cover change analysis was conducted by overlaying the 1976 and 2000 databases through a geographical information system (Arc/Info 8.1).
The overlay analysis provided two kinds of output: first, a transition matrix describing the changes between 1976 and 2000 among all the vegetation formations; second, a spatially explicit model showing where these changes took place at a scale of 1:250 000 for the whole country. Finally, the statistics derived from the analysis were used to determine the conversion rates for all classes. To calculate these rates the study used the same algorithm used in the Global Forest Resources Assessment 1990 (FRA 1990) (FAO, 1996) so as to facilitate comparison with other rates worldwide.
All data derived from the overlay process were grouped into three major land- cover clusters. The first (referred to as primary land cover) included all categories dominated by primary land cover types such as temperate forests, tropical forests, xerophytic scrublands and hygrophilous tree-dominated vegetation types. The second cluster (referred to as secondary land cover) included temperate forests, tropical forests and xerophytic scrublands dominated by secondary vegetation types. The third cluster (so-called human-made land cover) comprised categories such as crops, exotic forest plantations, improved grasslands for livestock production and human settlements.
Through analysis of the overlay results three major environmental conversion processes were identified:
1 According to these definitions, conversion to exotic plantations is classified as deforestation, but this has little significance because in Mexico exotic plantations cover less than 0.02 percent of the territory.
The legend of the current land cover map is hierarchical. It reconciles a forestry-oriented approach with a more ecology-oriented one and includes nomenclature for four aggregation levels: eight vegetation formations (Figure 2), 17 vegetation types, 47 communities and 28 subcommunities, for a total of 75 categories.
The study calculated Mexico's current annual deforestation rate (for temperate and tropical forests and scrubland only) as 0.43 percent. This implies a loss of 545 000 ha (±50 000 ha) per year from 1976 to 2000. This figure differs greatly from most previous Mexican estimates, which tended either to over- or underestimate deforestation. The slight difference between the new figure and the FRA 2000 estimate (FAO, 2001), 631 000 ha per year, may be the result of small differences in definitions of deforestation processes. The method provides rates of deforestation and reveals where it is taking place (Figure 3).
2 - Coverage by formations considered in the Mexican National Forest Inventory 2000
3 - Annual land use and cover changes in Mexico, 1976 to 2000, including woody and non-woody land cover types
Bibliography
FAO. 1996. Forest resources assessment 1990 - survey of tropical forest cover and study of change processes. FAO Forestry Paper No. 130. Rome.
FAO. 2001. Global Forest Resources Assessment 2000 - main report. FAO Forestry Paper No. 140. Rome.
Masera, O., Ordóñez, M.J. & Dirzo, R. 1992. Emisiones de carbono a partir de la deforestación en México. Ciencia, 43: 151-153.
Secretary of Agriculture and Hydraulic Resources (SARH). 1994. Inventario Nacional Forestal Periódico - México. Memoria Nacional. Mexico City, Mexico, SARH, Subsecretaría Forestal y de Fauna Silvestre.
Toledo, V.M. 1988. La diversidad biológica de México. Ciencia y Desarrollo, 14(81): 17-30.
Mapping of Bhutan's forests by the Land Use Planning Project 
Bhutan has no national forest inventory programme. The Department of Forest Services conducts sample-plot-based forest inventories of the country's 31 forest management units (FMUs), at ten-year intervals, for the preparation of management plans. FMUs cover about one-quarter of the forest area and are found in 17 of 20 districts. Results from these inventories served as the basis for the Global Forest Resources Assessment 2000 (FRA 2000) estimation of growing stock in Bhutan. The accuracy of the forest inventories at FMU level is indicated as 10 percent at confidence level of 95 percent. The Land Use Planning Project of the Policy and Planning Division, Ministry of Agriculture, with assistance from the Danish International Development Agency (DANIDA), carried out a nationwide mapping and recording of the state of Bhutan's land cover in 1994. Earlier national surveys had been carried out first based on aerial photographs from the late 1950s and then on satellite images from the 1970s. The Land Use Planning Project produced three map series of full national coverage:
The land cover maps were produced by interpreting high-resolution satellite images taken in 1989 and 1990, combined with ground truthing carried out in 1993 and 1994. The land cover classification of Bhutan employs three classes (forest, pasture, agriculture). The forest class is divided four subclasses (coniferous, broadleaf, plantation and scrub forest) which in turn are divided into categories and subcategories. For the coniferous, broadleaf and plantation subclasses, crown densities were identified (10 to 40 percent, 41 to 80 percent, 81 to 100 percent). The Land Use Planning Project estimated the area statistics to be 95 to 98 percent correct at class level. The main problems in the mapping of land cover concerned mapping of small horticultural areas, areas that were not visible on remote-sensing material (e.g. crops grown under tree cover) and areas that had undergone a change in land use between the dates of aquisition of the remote-sensing images and the ground truthing. |
National forest inventory in Guatemala 
Guatemala has recently produced detailed maps showing vegetation cover and changes in vegetation cover, based on digital interpretation of Landsat TM scenes with extensive ground-truthing. However, Guatemala has never performed forest inventories at the national level. The existing data on forests were produced from local inventories and were last updated at the beginning of the 1990s. To fill in the information gaps at the national level, the National Forest Institute (Instituto Nacional de Bosques, INAB) initiated the planning of a national forest inventory in late 2001, with technical and financial support from FAO. FAO fielded a mission in early 2002 to assist national experts in planning the inventory activities. The project is being undertaken as a partnership among six national institutions involved in forest resources development. The national forest inventory will be part of a monitoring system for forest and tree resources based on permanent sample plots. The aim is periodic assessment of the environmental, economic and social values of forests and trees, and provision of reliable information on forest state and trends to meet both national and international needs. In contrast with traditional forest inventories, which often emphasize economic aspects, the approach focuses on the various products and services provided by forests and trees and on their management and use. The fieldwork is planned to be completed by mid-2003. |
Evolution of inventory activities in Mozambique 
1979/1980 exploratory national forest inventory. The main source of Mozambique's area information for the Forest Resources Assessments 1980 (FRA 1980) and for FRA 1990 was a 1979/1980 exploratory national forest inventory (NFI), performed as part of an FAO project. The exploratory NFI had national coverage and used Landsat MSS images with 1972 as the average year of acquisition. Exploratory sampling was done with varying sampling intensities in the commercially most important, accessible forest types. Distribution of the 10 x 500 m2 exploratory sample plots varied according to commercial importance and accessibility. The main objectives of the exploratory NFI were:
The 1980 exploratory NFI produced a national and ten provincial 1:1 000 000 maps of forest type/land use, timber volume above 25 cm diameter at breast height (DBH) for four quality classes, determination of medium densities of the forest types or proportion of valuable timber species, location of potential timber production forests and a regeneration assessment. Because of limited time for image interpretation, limited human resources and little or no ground verification, the results of the 1979/1980 inventory were of relatively low precision. Security and accessibility problems limited the possibility of unbiased field verification and measurements. 1994 update. The 1979/1980 inventory was updated in 1994 using 1990/1991 Landsat TM images of national coverage. The forest change estimates produced by this updating were used for FRA 2000. The 1994 update used the same 17 land cover classes as the earlier assessment. Within three priority areas, 108 randomly located 5 000 m2 sample plots covering all forest types generated information on stem volumes and volume distribution as a function of DBH. These results allowed prediction of a number of parameters, for example the mean annual increment (MAI) of commercial timber, which was calculated based on a precipitation-driven formula. To assist in the interpretations, preparatory field trips to secure areas were undertaken prior to the interpretation of the satellite images. The interpretation was assisted by aerial photos (where available) and involved ground truthing as well as interpretation checking from the air. The 1994 update produced an updated 1:1 000 000 map of forest types/land use (one of national coverage and ten provincial maps), a new 1:250 000 map of mangroves, updated forest area and timber volume statistics and estimates of deforestation rates in forests and mangroves. However, the update suffered from the same type of precision problems as the 1979/1980 assessment. 1:250 000 forest type and land cover map. As the 1:1 000 000 scale maps did not provide sufficiently detailed information for development activities, the National Directorate of Forestry and Wildlife, supported by an FAO/United Nations Development Programme (UNDP) project, used Landsat TM images from between 1990 and 1992 to prepare a national forest types map (1:250 000); this map was used for the FRA 2000 assessment of forest area. Approximately 16 percent of the national territory was covered by aerial photographs (mostly pre-1975 photos). Field reconnaissance of different vegetation or land use types with different degrees of disturbance was carried out in ten provinces to assist in the interpretation of the images. In total 20 land cover/land use classes were identified and mapped. The map shows with acceptable accuracy the location and size of forests and other woody vegetation cover, cultivated areas and other land use classes. |
|
Brunei Darussalam - a baseline from the 1980s 
The first national forest survey in Brunei Darussalam was carried out from 1932 to 1934. A number of localized surveys were carried out during the 1950s and the 1970s, but the next national-level survey work was not done until 1983. The results, published in 1984, were used as the baseline information on Brunei's forest resources for the Global Forest Resources Assessment 1990 (FRA 1990) and FRA 2000. For FRA 2000, area data were updated by subtracting official figures for forest areas converted to other uses. The 1983 survey, carried out by a consultancy, consisted of aerial photo interpretation to determine the limits of the potentially commercial forest area, to identify the forest types, density strata and terrain classes and to prepare a forest type map of complete national coverage. For most of the country, 1:25 000 aerial colour photos were available from 1975 and 1976. Black and white 1:25 000 photos from 1981 and 1982 were available for some of the remaining areas. The quality of the photographs for delineating forest types was variable. The resulting nine-sheet 1:50 000 forest cover map delineated six forest types (mangrove, freshwater swamp, peat swamp, tropical heath, mixed dipterocarp and montane) and also mapped non-forest areas including secondary forest, cultivated areas (which include forest plantations, as well as rubber plantations and rice cultivation) and urban and industrial land. Disturbed forest and forest damaged by natural causes were registered. Fieldwork employed three different approaches:
|
|
Papua New Guinea's Forest Inventory and Mapping System 
The Papua New Guinea Forestry Act (1991 as amended) called for the National Forest Authority to establish a national forest inventory. To meet the immediate needs, a rapid forest resource appraisal, based on mapping at a scale of 1:500 000 and 1:1 000 000, was conducted during the early 1990s. To meet the needs for more long-term, detailed and comprehensive forest inventory data, the national forest resources were mapped at a scale of 1:100 000 through interpretation of aerial photos. The mapping was linked to a review of all existing resource inventory and survey data to estimate gross volume and merchantable species for the mapped forest types. The mapping and review were a joint effort of the National Forest Authority and AusAid, the Australian Government's overseas aid programme. The resulting Forest Inventory and Mapping (FIM) system is an information system of national coverage for forest management and planning. FIM is not at a scale suitable for use at the operational level (e.g. for the production of concession-specific logging plans). Its design, however, allows for future incorporation of this level of information. Mapping of the forest resources was based on 1972/75 aerial photographs. FIM adopted 1975 as a baseline. Before 1975 Papua New Guinea had very little commercial logging. To update the 1975 map, areas subject to significant logging activity and other land use change between 1975 abd 1996 were mapped using 1996 remote sensing imagery supported by rapid ground and air survey. FIM provided the baseline area data that were used for the Global Forest Resources Assessment 2000 (FRA 2000). FIM contains information on:
The Forest Mapping Unit is the basic
mapping unit in FIM; it consists of a single vegetation type or complexes
of two or three. All forested areas received a disturbance rating. Six
structural formations are recognized (forest, woodland, savannah, scrub,
grassland and mangrove), within which 58 vegetation types are
differentiated, of which 35 are forest types. |
|
Uganda's National Biomass Study 
The first inventory of national coverage for Uganda was the National Biomass Study, undertaken by the Ugandan Forest Department, with funding from the Norwegian Agency for Development Cooperation (NORAD) and technical support from the Norwegian Forestry Society, largely during the 1990s. The results of this study were used as Uganda's baseline area data for the Global Forest Resources Assessment 2000 (FRA 2000). The overall goal of the National Biomass Study was to promote economic, environmentally sound and sustainable management and development of natural resources in Uganda, while simultaneously providing the knowledge, information and data sets neccessary to increase the biomass resource base. The study mapped land use and biomass distribution and was executed in three phases. The objective of Phase I (1989 to 1992) was to provide a detailed overview of the woody biomass situation in nine areas (totalling 14 000 km2) that were biomass deficient and representative of the country. The analysis was based on interpretation of 1:25 000 aerial photos combined with extensive ground truthing and field data collection:
Within each aerial photo model, five 50 x 50 m2 plots were subject to ground measurements. The plots were placed subjectively within each aerial photo model so that they would be representative and at the same time physically possible to visit and measure. Phase II (1992 to 1996) developed a land cover and land use stratification for the whole country (1:50 000), estimating woody and non-woody biomass. The stratification was based on manually interpreted satellite imagery acquired from 1989 to 1993 covering 92.5 percent of the country, with 1995 Landsat images and aerial photographs to fill in the gaps, combined with field observations. Dynamic monitoring of woody biomass was initiated through remeasurement of approximately 1 000 field plots from Phase I. Phase II also developed a digital Environmental Information System (1:50 000). In Phase III (1996 to 2000), a framework for monitoring land use, land cover and woody biomass was established by setting up as many as 4 500 field plots in a systematic grid covering the whole country. The plots were measured between 1995 and 1998 and remeasured in 1999. They generate information on standing stock including bushes and crop residues, change and composition of biomass and annual increment, and they provide indications on the rate and direction of land cover and land use changes. In Phase III the data sets of the Environmental Information System were maintained and updated, with work towards the transfer of responsibility. Phase III also involved collaboration with other professional groups to maximize the use of the biomass data sets. |
|
Two independent data sets in the Lao People's Democratic Republic 
The Nationwide Reconnaissance Survey of Land Use and Forest Cover (NRS) was initiated in 1987 under the Lao-Swedish Forestry Cooperation Programme. This survey, conducted by the Lao Forest Inventory and Planning Centre, updated the previous forest cover map of 1973/1974 to 1982 through interpretation of aerial photographs from 1982 with nearly complete national coverage (missing some border areas). Change estimates and projection of the area data to 1989 were made with the aid of satellite images from between 1987 and 1991. The survey thereby provided area data for 1982 and 1989. Field checks were carried out by the photo interpreters in accessible areas throughout the NRS period. The main objective of the NRS has been to develop a feasible inventory method, to provide information on the status and change of forest cover and to upgrade and develop the capacity of the Department of Forestry to carry out inventory work. To provide more detailed information, a national forest inventory (NFI) based on ground survey was inititiated in 1991. The objectives of the NFI were:
The inventory has produced land use and forest type maps (1:50 000, 1:100 000 [standard topographic map grid] and 1:250 000 [provincial maps]). It has also developed a field manual for the inventory work, databases for data management, volume functions and volume estimation models for Laotian tree species and a compilation of regional and provincial statistics on land use, forest types, topography and accessibility of forested areas. The design of the NFI is a two-phased, stratified, systematic cluster sampling. The sampling units consist of L-shaped tracts (clusters) of sample plots, laid out across the country in a systematic manner, aligned with the map grid. The NRS/NFI was used as the government-validated information source for the Global Forest Resources Assessment 1990 (FRA 1990) and FRA 2000. However, another project, the Mekong River Commission/German Agency for Technical Cooperation (GTZ) Forest Cover Monitoring Project (FCMP), has also mapped the forest resources of the Lao People's Democratic Republic at the national level at two points in time. The mapping was based on 1992/1993 and 1996/1997 Landsat TM satellite images. FCMP has established a geographic information system (GIS) with mapping and database components for information on natural resources and forest cover monitoring and trend analysis. The FCMP and the NRS/NFI are performed independently by different institutions and result in two independent sets of forest cover information for the Lao People's Democratic Republic, each providing information for two points in time. Differences between the two sets of information may be attributed to the use of different definitions of forest, in addition to subjectivity in interpretation, effects of time, differences in classification systems and differences in scales of source data. |
1 The shorter summaries of national forest inventory experiences were adapted from national forest inventory profiles prepared by Soren Dalsgaard, Consultant, FAO Forest Resources Assessment Programme.
