![]()
![]()
![]()
Faisal Dilrosun
Department of Agriculture and
Fisheries
Klein Kwartier 33
Curacao
Tel: 599 9 737 0288
Fax: 599 9
737 0723
During the first three months of the fishery monitoring a frame survey was conducted to detect the landing practices and to count the number of landing sites, the number of fishing vessels, the number of gear types, and the number of fishers involved. Because of the great diversity in the artisanal fishing vessels, the vessels were grouped in the following 5 length categories (Table 1). Length categories 1 to 4 consist of artisanal fishing vessels. Gasoline outboard engines usually propel the artisanal vessels up to 7 meters, while the vessels between 7-12 meters are predominantly equipped with Diesel inboard engines. The vessels larger than 12 meters are primarily semi-industrial fishing vessels.
Table 1. Different length categories Curacao fishing vessels
|
Length categories |
Length (m) |
|
1 |
<5 |
|
2 |
5-7 |
|
3 |
7-9 |
|
4 |
9-12 |
|
5 |
>12 |
Trolling lines and hand lines are the gear types most commonly used in the artisanal fishery, but certain species are also targeted using beach seines, fish traps, spear guns, and gill nets. The semi-industrial fishing vessels use drift longlines and/or bottom drop longlines.
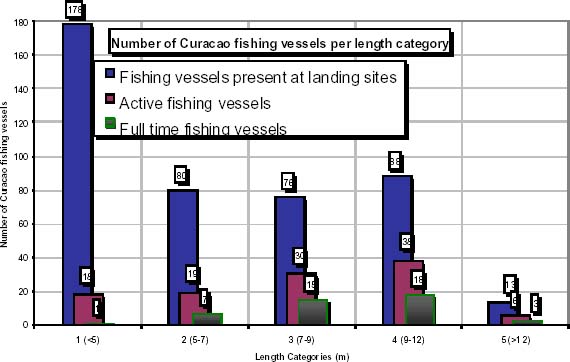
There are currently 435 fishing vessels present at the fishing harbours in Curacao, but only 111 (25.5%) of these vessels are active in the fishery. Active vessels are those that were observed fishing. The vast majority of the fishing vessels remain unused due to mechanical- and/or financial problems, migration of the owner or other reasons*. The number of full time fishing vessels, i.e. between 100-200 fishing days a year, is 44. This is 10.1% of the total number of existing fishing vessels and 39.6% of the active vessels. The remnant, 67 fishing vessels or 60.4% of the active vessels, operate on a part time basis (less than 100 days a year).
*During the last few years import duties on engines, spare parts and other needed production items have risen markedly. The price of Diesel fuel also increased considerably. On the other hand low import duties (5.5%) are paid on imported fish in order to protect the customer. The price of local fish, which is generally of higher quality than the imported fish, is usually somewhat higher than that of the imported fish, but cannot rise very high above it. Thus the rising costs for the fishers could be passed to the customer only partly. This is one of the main causes of the financial difficulties fishers experience nowadays and the main reason why many fishers migrated to the Netherlands, and many boats remain unused.
Fishers also frequently report that the targeted fish species have become scarce. One has to go further and fish longer and increase fishing effort in order to equal the catch of years ago. This could be due to natural fluctuations in abundance of pelagic stocks, which may be related to El Niño and la Niña oscillations. It can also be related to a general decline of pelagic stocks as a result of overfishing in the Atlantic Ocean and the Caribbean Sea.
Figure 1. The total number of Curacao fishing vessels, the number of active Fishing vessels, and the number of full time fishing vessels
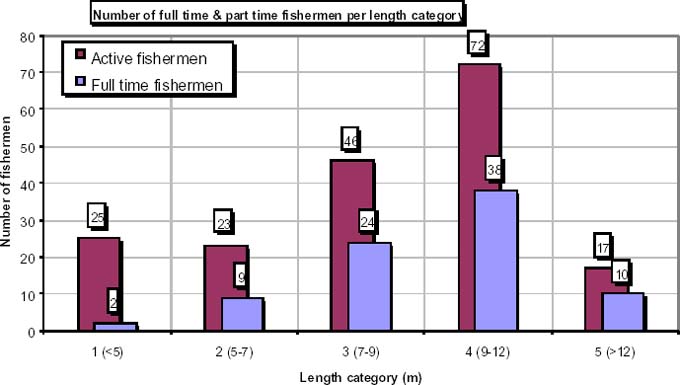
The boats are commonly operated by 1 or 2 fishers and the trip duration is usually one day, although some fishers sometime venture out the Klein Curacao and Bonaire where they stay over for several days. The total number of fishers is 183 of which 83 can be considered full time (Figure II). On occasion fishers from Bonaire visit the Island to sell their surplus of fish. In general the full time fishers operate the larger vessels. It is likely that the number of part time fishers, especially for the small vessels, is much larger, but continued monitoring at the landing sites, which also covers the weekends, is needed to determine this number.
Figure 2. Number of active fishers and full time fishers in Curacao
Due to the vast diversity of landing sites and a shortage of qualified data collectors. There is also a shortage of transportation, so the landing sites were monitored proportionally, i.e. landing sites were not visited based on the number of fishing units, but based on total fishing effort per landing site. Rather sites were monitored based on the frequency of the fishing trips and size of the fishing vessels.
Target species and by-catch
The Curacao artisanal fishers engage in different types of fisheries targeting pelagic and demersal species. There is no clear distinction between target species and by-catch. Fish species with the highest market value include wahoo, dorado, red-snappers and groupers (14-18 Nafl/kg). Less desired fish species such as shark, marlin and tuna are still sold at relative high market prices (7.50-11.00 Nafl/kg) compared to prices of chicken (4.14 Nafl/kg) and pork meat (5.53 Nafl/kg).
The longline vessels target predominantly pelagic fish species such as bigeye tuna, yellowfin tuna and swordfish. Other pelagic species such as dorado, jacks, sharks, escolar, and marlin are considered by-catch.
Catch and Effort Data
Catch and effort data were collected from the landing sites on a daily basis, including also the fishing method, fishing grounds and catch composition. The data were entered on a data form, and later in an MS-Access database program. The required information included also date, boat category, fishing hours, number of fishing gear, weight of catch and by-catch.
During the monitoring period a catch of 10,505.3 kilograms was recorded. In order to obtain the approximate total catch a multiplying factor has to be used. The following table (Table II.) shows the recorded catch and fishing effort per length category. Taking the relative high CPUE (catch per unit of effort) of spear fishing into account, it is evident why spear fishing is still being practised in Curacao, although the law prohibits it. It is a major cause of over-fishing. It is also clear that there is a correlation between boat length and CPUE.
Table 2. Catch, fishing effort, catch per unit of effort and the number of samples taken per length category from February to July 2000
|
Length Category |
Catch (kg) |
Fishing Effort (hrs) |
CPUE (kg/hr) |
# samples |
|
1 (<5) |
221.3 |
235.6 |
0.940 |
42 |
|
2 (5-7) |
625.3 |
436.3 |
1.433 |
61 |
|
3 (7-9) |
1185.1 |
747.4 |
1.586 |
85 |
|
4 (9-12) |
3459.0 |
1091.4 |
3.169 |
72 |
|
5 (>12) |
4964.6 |
493 |
10.070 |
8 |
|
Spear gun |
50 |
8 |
6.250 |
2 |
|
Total: |
10505.3 |
3011.7 |
|
270 |
The table below (Table III) shows the landing sites monitored in this survey. Total catch and fishing effort are shown per landing site per length category. It is remarkable that the catches of 1 long line vessel, operating from the Motetwerf in Otrabanda, in 6 fishing trips almost equal the catch of 264 fishing trips of the artisanal fishing vessels. To get an idea of the relative economic performance of the vessels, the CPUE per length category has to be compared to the relative cost per trip. The costs per trip are of course much higher for the longliners. Nevertheless in general the catches of the artisanal fishing fleet, irrespective to the gear type used, can be considered marginal.
Table 3. Catch and effort per length category per landing site from February 2001 to July 2001
Sint Michiel
|
Length Category |
Catch (kg) |
Fishing Effort (hrs) |
CPUE (kg/hr) |
# samples |
|
1 (<5) |
52.8 |
88.8 |
0.595 |
16 |
|
2 (5-7) |
42.5 |
47.0 |
0.904 |
8 |
|
3 (7-9) |
16.0 |
15.8 |
1.016 |
2 |
|
4 (9-12) |
45.0 |
72.3 |
0.623 |
10 |
|
Total: |
156.3 |
223.8 |
|
36 |
Caracasbaai Vissershaven LVV
|
Length Category |
Catch (kg) |
Fishing Effort (hrs) |
CPUE (kg/hr) |
# samples |
|
1 (<5) |
9.5 |
8.3 |
1.145 |
1 |
|
2 (5-7) |
189 |
90 |
2.100 |
6 |
|
3 (7-9) |
597.0 |
450.2 |
1.326 |
52 |
|
4 (9-12) |
3244.5 |
934.9 |
3.470 |
50 |
|
5 (>12) |
31.0 |
13.0 |
2.385 |
2 |
|
Total: |
3872.5 |
1398.1 |
|
111 |
Oude Vissershaven Caracasbaai
|
Length Category |
Catch (kg) |
Fishing Effort (hrs) |
CPUE (kg/hr) |
# samples |
|
1 (<5) |
0.0 |
11.0 |
0 |
2 |
|
2 (5-7) |
88.5 |
48.9 |
1.810 |
5 |
|
3 (7-9) |
133.0 |
119.0 |
1.118 |
3 |
|
4 (9-12) |
0.0 |
28.0 |
0.000 |
5 |
|
5 (>12) |
|
|
|
|
|
Total: |
221.5 |
206.9 |
|
15 |
Westpunt
|
Length Category |
Catch (kg) |
Fishing Effort (hrs) |
CPUE (kg/hr) |
# samples |
|
1 (<5) |
144.0 |
123.5 |
1.166 |
22 |
|
2 (5-7) |
305.3 |
250.4 |
1.219 |
42 |
|
3 (7-9) |
439.1 |
162.4 |
2.704 |
28 |
|
4 (9-12) |
169.5 |
56.3 |
3.011 |
9 |
|
5 (>12) |
|
|
|
|
|
Spear Gun |
50 |
8 |
6.250 |
2 |
|
Total: |
1107.9 |
600.6 |
|
103 |
Santa Cruz
|
Length Category |
Catch (kg) |
Fishing Effort (hrs) |
CPUE (kg/hr) |
# samples |
|
1 (<5) |
15.0 |
4.0 |
3.75 |
1 |
|
2 (5-7) |
|
|
|
|
|
3 (7-9) |
|
|
|
|
|
4 (9-12) |
|
|
|
|
|
5 (>12) |
|
|
|
|
|
Total: |
15.0 |
4.0 |
|
1 |
Motetwerf, Otrabanda
|
Length Category |
Catch (kg) |
Total number hooks |
Catch/100 hooks (kg) |
# samples |
|
1 (<5) |
|
|
|
|
|
2 (5-7) |
|
|
|
|
|
3 (7-9) |
|
|
|
|
|
4 (9-12) |
|
|
|
|
|
5 (>12) |
4965 |
8810 |
56.4 |
6 |
|
Total: |
4965.0 |
8810.0 |
|
6 |
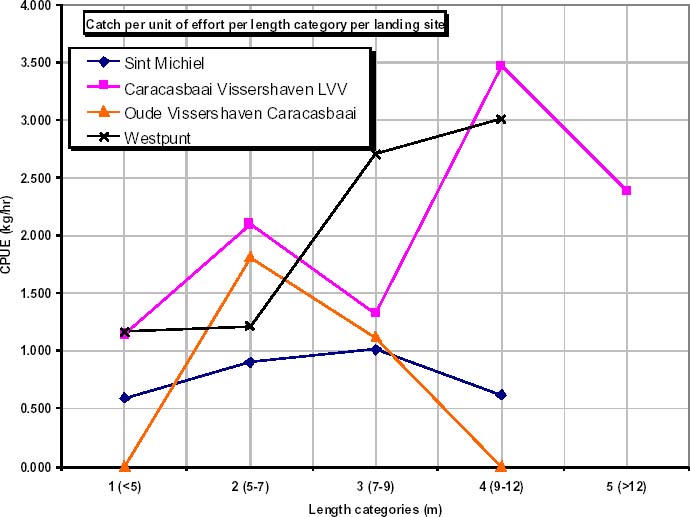
The CPUE fluctuates per length category and per landing site. This can be explained by the fact that some landing sites are situated closer to the main fishing areas (Figure III). Figure VI shows the CPUE per length category per fishing area. The CPUE of length category 1 and 4 of the Oude Vissershaven Caracasbaai can be considered outliners, since the vessels sampled had no catch those particular days. The low CPUE of St Michiel can be explained by the fact that this particular landing site is situated at a relatively long distance from the main fishing areas. The main fishing areas are situated at the northern coastline, the eastern coastline and on the Western parts of the island and around the island of Klein Curacao.
Figure 3. Map of the landing sites and fishing grounds around the island of Curacao
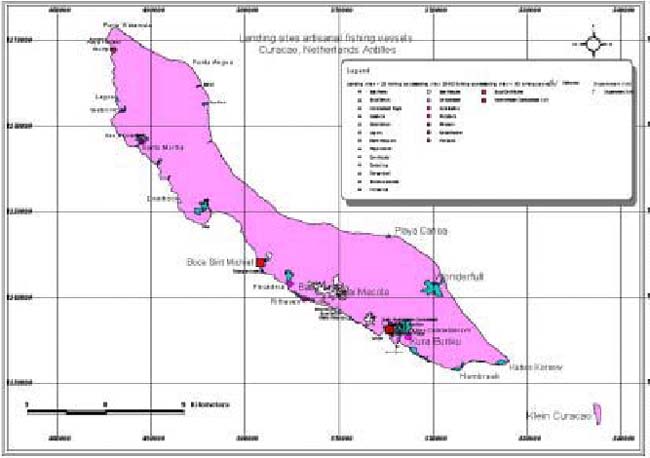
Figure 4. CPUE per length category per landing site from February 2001, to July 2001
The next figure (Figure V) displays the catch per unit of effort (CPUE) and average fishing effort per trip. The figure shows a clear correlation between these two entities, which can be explained by the fact that small vessels are restricted to the vicinity of their fishing harbour, while larger vessels can go to the richer fishing areas, which results in a higher CPUE. However to get an idea of the relative economic performance of these vessels, the costs per trip should also be compared.
Figure 5. Catch per unit of effort and average fishing effort per trip per length category from February, to July 2001
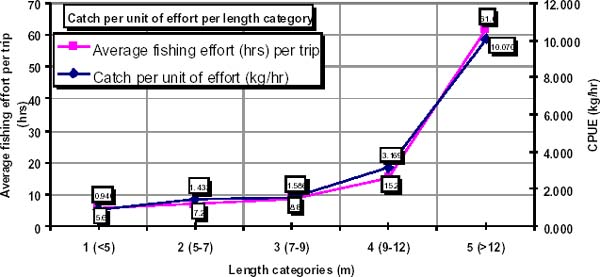
Figure 6. CPUE per month per length category from February to June 2001 Catch Composition
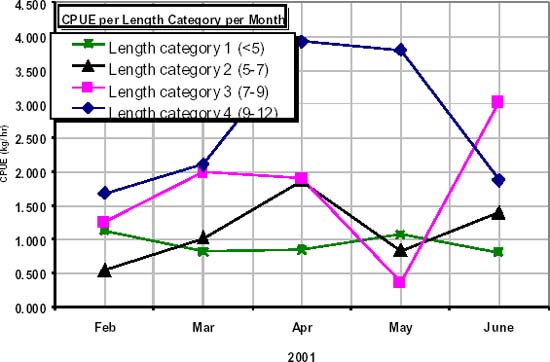
Figure VI shows the CPUE per month per length category. One can see the steep fluctuations in monthly CPUE in length categories 2,3 and 4 characteristic for a fishery targeting pelagic species. In general pelagic species are highly seasonal because of their migratory patterns. In category 1, the smallest vessels, show a more even monthly CPUE, which can be explained by the fact that a large part of their daily catch consists of demersal species.
Fishers with vessels from length category 1, target both demersal and pelagic species. The following tables (Table IV) show the total catch and catch composition of all length categories.
Table 4. Total catch and catch composition of fishing vessels sampled (n=42) of length category 1 from February to July 2001
|
Total Catch and Catch Composition Category 1 |
|||
|
English Name |
Papiamento name |
Catch (kg) |
Percentage of total (%) |
|
Pelagic species: |
Piská di lamán grandi: |
|
|
|
Flying Fish |
Buladó |
26.0 |
11.7 |
|
Tuna's |
Buní |
24.5 |
11.1 |
|
Rainbow Runner |
Grastèlchi lamán |
14.0 |
6.3 |
|
Wahoo |
Mulá |
29.0 |
13.1 |
|
Dorado |
Dradu |
8.0 |
3.6 |
|
Marlins |
Balaú |
0.0 |
0.0 |
|
Needlefish |
Gepi |
9.5 |
4.3 |
|
Sub Total: |
|
111.0 |
50.2 |
|
Demersal species: |
Piská di fondu: |
|
|
|
Snappers |
Korá |
10.3 |
4.7 |
|
Great Barracuda |
Pikú |
20.0 |
9.0 |
|
Round Scad |
Moulo |
6.5 |
2.9 |
|
Pot fish |
Piská di kanaster |
73.5 |
33.2 |
|
Sub-total: |
|
110.3 |
49.8 |
Table 5. Total catch and catch composition of fishing vessels sampled (n=61) of length category 2 from February to July 2001
|
English Name |
Papiamento name |
Catch (kg) |
Percentage of total (%) |
|
Pelagic species: |
Piská di lamán grandi: |
|
|
|
Flying Fish |
Buladó |
71.0 |
11.3 |
|
Tuna's |
Buní |
258.5 |
41.3 |
|
Rainbow Runner |
Grastèlchi lamán |
11.5 |
1.8 |
|
Wahoo |
Mulá |
165.8 |
26.5 |
|
Dorado |
Dradu |
20.0 |
3.2 |
|
Marlins |
Balaú |
0.0 |
0.0 |
|
Needlefish |
Gepi |
15.0 |
2.4 |
|
Sub Total: |
|
541.8 |
86.5 |
|
Demersal species: |
Piská di fondu |
|
|
|
Snappers |
Korá |
8.0 |
1.3 |
|
Great Barracuda |
Pikú |
24.0 |
3.8 |
|
Round Scad |
Moulo |
7.0 |
1.1 |
|
Pot fish |
Piská di kanaster |
46.0 |
7.3 |
|
Sub-total: |
|
85.0 |
13.6 |
|
Total Catch (kg): |
|
626.0 |
100.0 |
Table 6. Total catch and catch composition of fishing vessels sampled (n=85) of length category 3. From February to July 2001
|
Dorado |
Dradu |
164.5 |
13.9 |
|
Marlins |
Balaú |
15.5 |
1.3 |
|
Needlefish |
Gepi |
0.0 |
0.0 |
|
Sub Total: |
|
991.1 |
83.6 |
|
Demersal species: |
Piská di fondu: |
|
|
|
Snappers |
Korá |
10.0 |
0.8 |
|
Great Barracuda |
Pikú |
36.5 |
3.1 |
|
Round Scad |
Moulo |
21.5 |
1.8 |
|
Pot fish |
Piská di kanaster |
126.0 |
10.6 |
|
Sub-total: |
|
194.0 |
16.4 |
|
Total Catch (kg): |
|
1185.1 |
100.0 |
Table 7. Total catch and catch composition of fishing vessels sampled (n=72) of length category 4. From February to July 2001
|
English Name |
Papiamento name |
Catch (kg) |
Percentage of total (%) |
|
Pelagic species: |
Piská di lamán grandi: |
|
|
|
Flying Fish |
Buladó |
0,0 |
0,0 |
|
Tuna's |
Buní |
1457,0 |
42,1 |
|
Rainbow Runner |
Grastèlchi |
82,0 |
2,4 |
|
Wahoo |
Mulá |
799,0 |
23,1 |
|
Dorado |
Dradu |
863,0 |
24,9 |
|
Marlins |
Balaú |
152,0 |
4,4 |
|
Needlefish |
Gepi |
8,0 |
0,2 |
|
Sub Total: |
|
3361,0 |
97,2 |
|
Demersal species: |
Piska di fondu: |
|
|
|
Snappers |
Korá |
26 |
0,8 |
|
Great Barracuda |
Pikú |
17,0 |
0,5 |
|
Round Scad |
Moulo |
15,0 |
0,4 |
|
Pot fish |
Piská di kanaster |
40,0 |
1,2 |
|
Sub-total: |
|
98,0 |
2,8 |
|
Total Catch (kg): |
|
3459,0 |
100,0 |
Drift Longline Vessels
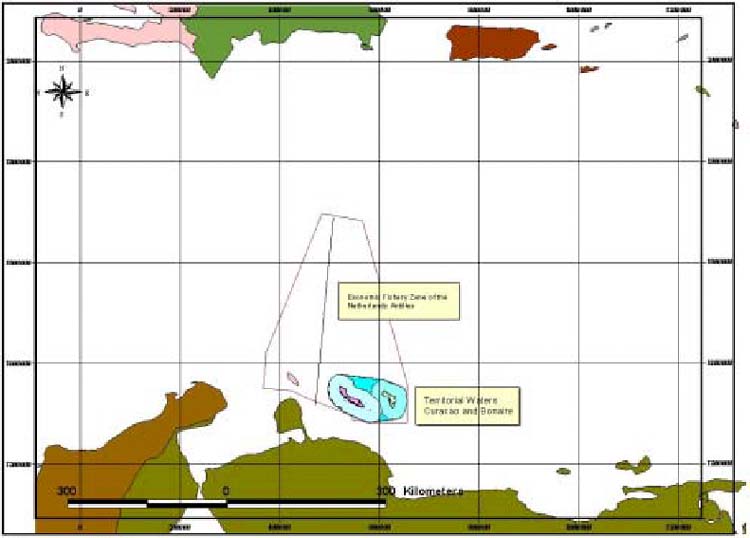
The longline vessels operate in the Southern economic fishery zone (EFZ) of the Netherlands Antilles, i.e. north of the islands of Curacao and Bonaire (Figure VII).
Figure 7. Economic Fishery Zone (EFZ) around the islands of Curacao and Bonaire
The longline vessel catch is predominantly exported to the U.S. and the targeted species in the fishery are bigeye tuna’s, yellowfin tuna’s and swordfish. The by-catch in this fishery consists of under-sized swordfish (mini swordfish) (16.9%), and sharks and shark fins (10.9%), small tuna’s (9.2%), and other pelagic species (Table VIII).
Table 8. Total catch and catch composition Curacao long line vessels sampled (n=6) from February, to July 2001
|
English Name |
Papiamento name |
Export Catch (kg) |
Percentage of grand total (%) |
|
Bigeye tuna |
Buní wowo grandi |
530,2 |
10,7 |
|
Yellowfin tuna |
Buní alfashi |
180,5 |
3,7 |
|
Swordfish |
Balaú tonini |
1638,1 |
33,2 |
|
Sub Total: |
|
2348,8 |
47,6 |
|
|
|
By-Catch (kg) |
|
|
Dorado |
Dradu |
127,2 |
2,6 |
|
Escolar |
Kaka sin sintí |
406,4 |
8,2 |
|
Mini swordfish |
Balaú tonini chikí |
832,1 |
16,9 |
|
Mini tuna |
Buní chikí |
452,0 |
9,2 |
|
Sharks |
Tribón |
527,5 |
10,7 |
|
Rainbow runner |
Grastèlchi lamán |
6,5 |
0,1 |
|
Sharkfins |
Ala di Tribón |
12,0 |
0,2 |
|
Jacks |
Korkobá |
59,5 |
1,2 |
|
Rays |
Chu-Chu di lamán grandi |
19,7 |
0,4 |
|
Marlins |
Balaú |
146,3 |
3,0 |
|
Sub Total: |
|
2589,2 |
52,4 |
|
Total Catch (kg): |
|
4938,0 |
100,0 |
Conclusions and recommendations
During the last 6 months it has become evident that the Curacao fishery sector is of importance to the island economy of Curacao. The sector provides employment to a relative large number of people, while relative large groups of people find part-time employment and so generate additional income in the fishery sector. Of a total labour force of 52.236 people (DEZ, 2001), 183 people (0.35%) find employment in the fishery sector.
The added value and the savings of foreign currency to the island economy are high.
It is evident that it is a necessity to continue monitoring the fishery. In order to show annual trends at least two full years should be monitored. The conclusions drawn from the collected data will help improve management of the fishery resources and formulate sensible regulations that will result in the improvement of the fishery sector as a whole.
The collected data also function as a basis for a future fishery island ordinance.
The collected data allows us to better understand the seasonality (migration patterns) of the pelagic target species. The accumulated data can allow us to understand how to improve fishing methods and catch of the artisanal fishing vessels.
It is clear that there is a strong correlation between boat length and catch per unit of effort. It is advisable to expand the number of larger vessels of the artisanal fishing fleet, and to increase the number of longline vessels in order to exploit the fishery resources of the economic fishery zone around Bonaire and Curacao to their full potential, taking care to avoid over-fishing.
It is important to present the results of the collected data during a meeting with the fishers in order to give the necessary feedback, while there will also be an opportunity to discuss the draft fishery ordinance with the resource users.
![]()
![]()
![]()