![]()
![]()
![]()
The global trends in the fishery industry are more thoroughly described elsewhere, such as in the GLOBEFISH publications noted in Chapter 1. Here some general comments will be made on production, export and import.
Figure 1. Global production from marine and fresh water sources (million tonnes)
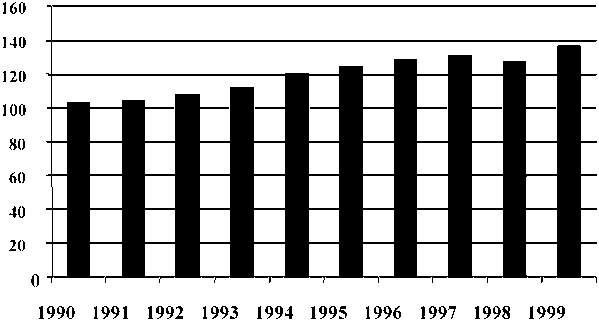
During the 1990s, global production increased by some 33 million tonnes. Of this, 25.9 million tonnes came from aquaculture, while about 6 million tonnes were from increased marine catches.
Table 1. Total production 1990-1999 (Yearbook commodity groups; quantity in ‘000 tonnes)
|
|
1990 |
1991 |
1992 |
1993 |
1994 |
1995 |
1996 |
1997 |
1998 |
1999 |
|
Total (world) |
98 627 |
98 285 |
100 845 |
104 423 |
112 350 |
116 364 |
120 278 |
122 495 |
117 727 |
126 177 |
|
Brazil |
802 |
790 |
771 |
747 |
771 |
753 |
793 |
832 |
811 |
775 |
|
India |
3 795 |
4 045 |
4 233 |
4 546 |
4 738 |
4 906 |
5 258 |
5 379 |
5 245 |
5 352 |
|
Korea, Rep. of |
2 843 |
2 514 |
2 697 |
2 649 |
2 701 |
2 688 |
2 772 |
2 596 |
2 354 |
2 423 |
|
Mexico |
1 383 |
1 398 |
1 184 |
1 131 |
1 223 |
1 355 |
1 495 |
1 529 |
1 216 |
1 251 |
|
New Zealand |
372 |
417 |
503 |
471 |
493 |
615 |
496 |
673 |
730 |
686 |
|
Norway |
1 754 |
2 173 |
2 562 |
2 580 |
2 585 |
2 802 |
2 970 |
3 224 |
3 259 |
3 086 |
|
Poland |
473 |
457 |
506 |
423 |
462 |
451 |
369 |
382 |
268 |
269 |
|
South Africa |
538 |
501 |
697 |
566 |
528 |
579 |
443 |
519 |
564 |
592 |
Figure 2. Changes in production 1990-1999 among the eight countries (quantity; ‘000 tonnes)
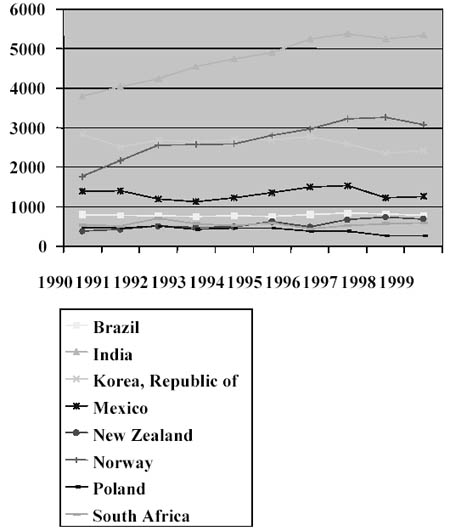
Figure 2 shows the development of production for the eight target countries, with only Indian and Norwegian production increasing significantly. Further, the Indian production is substantially higher than the other countries. This might signify a level of sufficient domestic supplies.
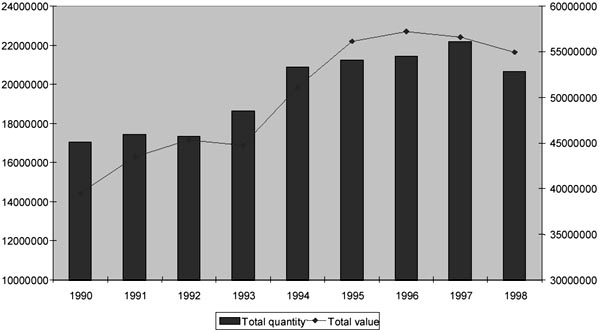
Global exports increased during the period 1990 to 1998, but total exports in 1998 were, however, lower than in 1999, probably due to the el Niño effect on Peru and the other Latin American countries.
Table 2. Global exports and imports of fishery products, 1990-1998
|
|
1990 |
1991 |
1992 |
1993 |
1994 |
1995 |
1996 |
1997 |
1998 |
|
Global exports |
|||||||||
|
Quantity (tonnes) |
16 755 745 |
16 943 584 |
17 141 707 |
19 348 246 |
22 006 601 |
21 901 151 |
22 594 008 |
23 507 567 |
21 724 150 |
|
Value (US$ ‘000s) |
35 485 808 |
38 698 464 |
40 209 355 |
41 312 887 |
47 396 084 |
51 718 734 |
52 827 835 |
53 285 187 |
51 272 197 |
|
Global imports |
|||||||||
|
Quantity (tonnes) |
17 069 461 |
17 438 896 |
17 357 548 |
18 655 323 |
20 898 829 |
21 266 757 |
21 470 444 |
22 176 416 |
20 663 465 |
|
Value US$ ‘000s |
39 476 466 |
43 470 866 |
45 355 495 |
44 712 025 |
51 115 425 |
56 118 640 |
57 229 020 |
56 590 668 |
54 987 702 |
Table 3 indicates the share of exports in global production, which is indicative of the fishery production available for domestic use. Total production increased from 103 million tonnes in 1990 to 127 million tonnes in 1998, and the quantity exported increased from 16.7 million tonnes to 22.7 million tonnes. Exports as a share of total production rose from 17% in the early 1990s to 19% in the period 1994-97, declining again to 18% in 1998. The increase in higher relative export nevertheless left the domestic markets with increased supplies, as can be seen from Table 3.
Table 3. Food supply for domestic use after export, 1990-1998 (quantity; ‘000 t)
|
|
1990 |
1991 |
1992 |
1993 |
1994 |
1995 |
1996 |
1997 |
1998 |
|
Total Production |
98 626.9 |
98 284.7 |
100 845.5 |
104 423.4 |
112 349.8 |
116 364.3 |
120 278.4 |
122 494.5 |
117 726.6 |
|
Export |
16 755.7 |
16 943.6 |
17 141.7 |
19 348.2 |
22 006.6 |
21 901.2 |
22 594.0 |
23 507.6 |
21 724.2 |
|
Export as % of total prod. |
17.0 |
17.2 |
17.0 |
18.5 |
19.6 |
18.8 |
18.8 |
19.2 |
18.5 |
|
Quantity left after export |
81 871.1 |
81 341.1 |
83 703.8 |
85 075.1 |
90 343.2 |
94 463.2 |
97 684.4 |
98 986.9 |
96 002.5 |
During the 1990s, there were few changes among the ten largest exporting countries. Table 4 shows the ten largest exporting countries, ranked by 1998 values. It also includes the eight target countries, even though the exports of some of these countries is on a much smaller scale.
The ranking for 1998 in quantity shows that Norway was the largest exporter, with exports of 1.74 million tonnes. The republic of Korea was the 17th-largest exporter, with an export quantity of 561 000 t. For the other six countries, the figures were India, at No. 21, export quantity of 384 000 t; New Zealand, No. 23, 322 000 t; Mexico, No. 30, 168 000 t; Poland, No. 32, 157 000 t; South Africa, No. 34, 128 000 t; and Brazil, at No. 62, with an export quantity of 34 000 t.
The values in Table 4 are the basis for the analysis of the export (quantity) part for each country. They will not be repeated in the separate sections.
The ranking for 1998 in value terms (see Table 5) shows that Norway was the 2nd-largest exporter, with an export value of US$ 3 660 million, The Republic of Korea was the 14th-largest exporter, with an export value of US$ 1 250 million. The other six countries of the group were: India at No. 17 with exports worth US$ 1 130 million, Mexico at No. 24 with US$ 716 million, New Zealand at No. 25 with US$ 663 million, Poland at No. 38 with US$ 275 million, South Africa at No. 41 with US$ 244 million, and Brazil at No. 52 with an export value of US$ 123 million.
The values in Table 5 are the basis for the analysis of the export (value) part for each country. They will not be repeated in the separate sections.
Table 4. The ten largest exporting countries for fishery produce, and the eight target countries, ranked by 1998 values (quantity; tonnes)
|
|
1990 |
1991 |
1992 |
1993 |
1994 |
1995 |
1996 |
1997 |
1998 |
|
Norway |
807 037 |
1 016 607 |
1 073 498 |
1 255 893 |
1 392 540 |
1 505 028 |
1 670 470 |
1 809 473 |
1 738 300 |
|
Thailand |
764 665 |
913 771 |
953 376 |
944 333 |
1 052 841 |
1 019 112 |
971 336 |
1 012 962 |
1 159 309 |
|
Denmark |
721 659 |
869 280 |
905 504 |
909 972 |
972 091 |
1 046 322 |
1 099 016 |
1 082 112 |
1 079 673 |
|
Chile |
1 262 354 |
1 296 907 |
1 336 490 |
1 259 171 |
1 564 265 |
1 746 963 |
1 475 105 |
1 345 423 |
1 045 204 |
|
Russia |
|
|
531 734 |
1 137 955 |
1 444 211 |
1 240 063 |
1 271 316 |
1 183 760 |
973 205 |
|
China |
369 952 |
380 198 |
470 469 |
500 900 |
626 744 |
678 073 |
740 217 |
849 049 |
936 595 |
|
USA |
1 417 163 |
1 199 205 |
1 142 102 |
1 082 479 |
1 077 098 |
1 109 685 |
1 119 677 |
1 105 425 |
932 843 |
|
Peru |
1 171 737 |
1 220 082 |
1 134 620 |
1 749 137 |
2 684 265 |
2 030 351 |
1 961 144 |
2 232 102 |
800 772 |
|
United Kingdom |
469 099 |
548 635 |
596 962 |
595 493 |
583 175 |
572 692 |
578 792 |
603 713 |
752 500 |
|
Iceland |
610 647 |
464 180 |
571 607 |
632 815 |
644 879 |
610 691 |
783 060 |
792 660 |
695 218 |
|
Korea, Rep. of |
413 354 |
457 162 |
404 357 |
334 439 |
325 750 |
405 357 |
422 255 |
475 285 |
561 235 |
|
India |
133 572 |
190 288 |
209 557 |
254 859 |
318 757 |
305 923 |
393 325 |
374 644 |
384 474 |
|
New Zealand |
192 043 |
258 665 |
289 955 |
303 151 |
288 726 |
322 575 |
312 430 |
331 484 |
322 051 |
|
Mexico |
97 562 |
90 517 |
64 431 |
67 032 |
60 320 |
162 367 |
212 637 |
205 936 |
168 719 |
|
Poland |
129 444 |
123 867 |
213 320 |
157 951 |
201 116 |
179 087 |
206 024 |
198 757 |
157 206 |
|
South Africa |
60 362 |
73 870 |
150 568 |
122 671 |
177 993 |
95 913 |
85 420 |
97 200 |
128 882 |
|
Brazil |
36 269 |
48 199 |
49 201 |
54 760 |
43 904 |
28 770 |
26 494 |
31 125 |
34 611 |
NOTE: Shading indicates one of the eight countries covered in this report.
SOURCE: FAO Fishstat
Table 5. The ten largest exporting countries and the eight target countries, ranked by 1998 values (value in US$ ‘000s)
|
|
1990 |
1991 |
1992 |
1993 |
1994 |
1995 |
1996 |
1997 |
1998 |
|
Thailand |
2 264 937 |
2 901 360 |
3 071 780 |
3 404 268 |
4 190 036 |
4 449 457 |
4 117 865 |
4 329 541 |
4 031 279 |
|
Norway |
2 059 784 |
2 282 247 |
2 436 832 |
2 302 346 |
2 718 132 |
3 122 662 |
3 415 696 |
3 399 229 |
3 661 174 |
|
Denmark |
2 165 497 |
2 302 299 |
2 319 917 |
2 150 665 |
2 359 034 |
2 459 629 |
2 698 976 |
2 648 911 |
2 897 707 |
|
China |
1 301 690 |
1 181 989 |
1 559 977 |
1 542 429 |
2 320 125 |
2 835 021 |
2 856 986 |
2 937 281 |
2 656 117 |
|
USA |
3 019 861 |
3 281 746 |
3 582 545 |
3 179 474 |
3 229 585 |
3 383 589 |
3 147 858 |
2 850 311 |
2 400 338 |
|
Canada |
2 269 802 |
2 168 121 |
2 085 494 |
2 055 438 |
2 182 078 |
2 314 413 |
2 291 261 |
2 270 725 |
2 265 236 |
|
Indonesia |
978 650 |
1 186 062 |
1 178 552 |
1 419 492 |
1 583 416 |
1 666 752 |
1 678 222 |
1 620 628 |
1 628 494 |
|
Chile |
866 397 |
1 066 925 |
1 252 364 |
1 124 679 |
1 303 974 |
1 704 260 |
1 697 211 |
1 781 805 |
1 596 800 |
|
Taiwan, Pr. China |
1 274 576 |
1 329 660 |
1 626 125 |
2 148 421 |
1 804 050 |
1 809 166 |
1 762 136 |
1 779 800 |
1 579 836 |
|
Korea, Rep. of |
1 361 231 |
1 490 127 |
1 358 143 |
1 334 207 |
1 409 933 |
1 564 380 |
1 509 062 |
1 376 152 |
1 245 858 |
|
India |
467 354 |
647 652 |
673 369 |
835 980 |
1 125 440 |
1 040 671 |
1 115 963 |
1 127 733 |
1 134 635 |
|
Mexico |
359 829 |
396 896 |
316 799 |
430 774 |
480 872 |
707 748 |
738 980 |
825 133 |
715 955 |
|
New Zealand |
438 834 |
556 218 |
654 533 |
648 253 |
691 926 |
813 897 |
815 649 |
830 470 |
663 614 |
|
Poland |
184 851 |
189 938 |
249 397 |
203 158 |
251 654 |
260 518 |
271 079 |
228 574 |
274 573 |
|
South Africa |
117 393 |
154 559 |
181 239 |
199 030 |
255 996 |
242 284 |
201 620 |
219 054 |
244 248 |
|
Brazil |
140 099 |
157 328 |
170 808 |
191 633 |
178 548 |
160 133 |
133 876 |
126 477 |
122 831 |
SOURCE: FAO Fishstat
The values for imports naturally reflect those for exports, but the major countries are different.
Among the largest import countries we find, not surprisingly, Japan followed by the United States of America and Spain. The next most important importer countries are all members of the European Union, which makes the EU the single largest import area, with imports worth US$ 21 000 million, for a quantity of 722 million tonnes.
Figure 3. Total global seafood imports, 1990-1998
As the figures suggest, there has been an increase in the trade in fish and fish products in the last half of the decade. The rise began in 1994, before the WTO agreements came into effect.
As with the tables for export figures, these numbers are the basis for the analyses in the country sections, but will not be repeated in those chapters.
Table 6. Ten largest importers and the eight target countries, ranked by 1998 values (quantity; tonnes)
|
|
1990 |
1991 |
1992 |
1993 |
1994 |
1995 |
1996 |
1997 |
1998 |
|
Japan |
2 441 769 |
2 755 729 |
2 881 477 |
3 031 250 |
3 193 683 |
3 481 081 |
3 351 603 |
3 308 233 |
2 998 964 |
|
USA |
1 387 319 |
1 407 614 |
1 338 242 |
1 647 885 |
1 580 694 |
1 409 202 |
1 446 378 |
1 531 029 |
1 653 080 |
|
Spain |
845 482 |
908 440 |
813 936 |
1 026 543 |
991 867 |
1 006 637 |
1 048 622 |
1 114 998 |
1 251 614 |
|
China |
365 439 |
783 703 |
1 032 381 |
936 362 |
1 253 766 |
1 324 825 |
1 367 078 |
1 484 020 |
1 108 308 |
|
Germany |
1 099 929 |
1 014 611 |
1 010 467 |
941 259 |
1 119 992 |
1 066 284 |
1 070 021 |
1 100 749 |
1 091 244 |
|
France |
840 028 |
842 343 |
867 396 |
848 608 |
887 452 |
887 220 |
918 664 |
919 414 |
983 333 |
|
UK |
934 540 |
883 752 |
838 696 |
828 037 |
892 270 |
836 646 |
841 452 |
881 797 |
825 666 |
|
Italy |
722 871 |
758 992 |
724 457 |
696 642 |
714 249 |
683 713 |
720 931 |
737 444 |
754 668 |
|
Denmark |
492 375 |
490 514 |
499 834 |
531 594 |
606 520 |
605 026 |
644 263 |
687 648 |
748 983 |
|
Thailand |
513 431 |
722 520 |
707 978 |
757 368 |
964 024 |
915 850 |
786 785 |
698 139 |
714 188 |
|
Norway |
192 710 |
280 764 |
303 371 |
365 839 |
399 712 |
533 131 |
566 426 |
638 592 |
594 509 |
|
Korea, Rep. of |
282 175 |
358 640 |
319 170 |
351 695 |
375 623 |
407 320 |
515 943 |
508 467 |
360 462 |
|
Poland |
159 353 |
100 154 |
164 739 |
177 888 |
208 429 |
196 770 |
221 994 |
247 067 |
274 286 |
|
Brazil |
172 763 |
143 596 |
87 357 |
160 723 |
163 742 |
214 421 |
297 890 |
212 089 |
197 542 |
|
Mexico |
87 299 |
77 389 |
71 258 |
130 622 |
143 808 |
107 859 |
95 153 |
97 706 |
66 868 |
|
South Africa |
212 240 |
225 839 |
177 440 |
140 417 |
275 917 |
324 569 |
148 324 |
213 432 |
52 577 |
|
New Zealand |
14 520 |
15 673 |
17 025 |
16 356 |
16 771 |
23 989 |
27 452 |
11 742 |
21 430 |
|
India |
187 |
1 173 |
1 509 |
3 428 |
7 555 |
11 649 |
10 237 |
15 205 |
17 418 |
SOURCE: FAO Fishstat
Table 7. Ten largest importers and the eight target countries, ranked by 1998 values (value in US$ ‘000s)
|
|
1990 |
1991 |
1992 |
1993 |
1994 |
1995 |
1996 |
1997 |
1998 |
|
Japan |
10 668 291 |
12 085 125 |
12 831 760 |
14 187 149 |
16 140 465 |
17 853 481 |
17 023 945 |
15 539 507 |
12 826 543 |
|
USA |
5 573 241 |
5 999 580 |
6 024 064 |
6 290 233 |
7 043 431 |
7 141 428 |
7 080 411 |
8 138 840 |
8 578 766 |
|
Spain |
2 360 653 |
2 748 304 |
2 898 232 |
2 629 799 |
2 638 737 |
3 105 684 |
3 134 893 |
3 069 601 |
3 545 751 |
|
France |
2 809 033 |
2 925 994 |
2 934 588 |
2 556 151 |
2 796 719 |
3 221 298 |
3 194 133 |
3 062 051 |
3 505 333 |
|
Italy |
2 458 086 |
2 689 639 |
2 643 440 |
2 131 181 |
2 257 462 |
2 281 316 |
2 590 985 |
2 571 868 |
2 808 587 |
|
Germany |
1 899 729 |
2 114 720 |
2 190 892 |
1 884 301 |
2 316 449 |
2 478 817 |
2 542 957 |
2 362 914 |
2 623 741 |
|
UK |
1 911 161 |
1 911 905 |
1 906 861 |
1 628 852 |
1 880 350 |
1 910 091 |
2 065 025 |
2 141 619 |
2 384 028 |
|
Denmark |
1 116 108 |
1 148 255 |
1 197 370 |
1 094 253 |
1 415 239 |
1 573 732 |
1 618 669 |
1 521 062 |
1 704 234 |
|
China (Hong Kong SAR) |
1 111 938 |
1 232 075 |
1 398 180 |
1 376 856 |
1 647 106 |
1 831 511 |
1 928 143 |
2 096 894 |
1 611 747 |
|
Netherlands |
769 525 |
867 511 |
888 606 |
791 608 |
1 017 635 |
1 191 857 |
1 141 647 |
1 107 443 |
1 230 199 |
|
Norway |
237 376 |
307 051 |
346 048 |
310 352 |
322 087 |
490 383 |
535 642 |
562 133 |
674 766 |
|
Korea, Rep. of |
364 738 |
568 229 |
498 036 |
537 346 |
718 451 |
824 817 |
1 054 095 |
1 017 873 |
562 208 |
|
Brazil |
194 614 |
192 783 |
133 508 |
200 567 |
261 453 |
397 574 |
481 550 |
483 598 |
455 250 |
|
Poland |
42 418 |
39 100 |
102 455 |
128 633 |
170 956 |
183 965 |
240 180 |
262 209 |
322 730 |
|
Mexico |
62 954 |
53 245 |
73 646 |
128 026 |
158 627 |
89 832 |
81 720 |
113 596 |
98 216 |
|
South Africa |
130 815 |
141 433 |
115 443 |
90 197 |
134 565 |
155 406 |
126 823 |
153 457 |
76 505 |
|
New Zealand |
35 567 |
38 356 |
34 684 |
35 515 |
40 315 |
57 537 |
58 763 |
26 182 |
52 106 |
|
India |
270 |
1 439 |
1 897 |
4 638 |
6 618 |
13 744 |
10 614 |
18 412 |
17 692 |
SOURCE: FAO Fishstat
![]()
![]()
![]()