![]()
![]()
![]()
India's economy encompasses traditional village farming, modern agriculture, handicrafts, a wide range of modern industries, and a multitude of support services. More than one-third of the population is too poor to be able to afford an adequate diet, and market surveys indicate that fewer than 5% of all households had an annual income equivalent to US$ 2 300 or more in 1995-96. India's international payments position remained strong in 1999, with adequate foreign exchange reserves, reasonably stable exchange rates, and booming exports of software services. Lower production of some non-foodgrain crops offset recovery in industrial production. Strong demand for India's high-technology exports was expected to bolster growth in 2000.
In June 1991, the then newly elected government recognized that India’s budget deficit, balance of payments problems and structural imbalances would require re-evaluation of past economic policies and financial institutions. As part of its economic reform since that time, the Indian government has taken consistent steps towards a more open and transparent trade regime. The average bound tariff for fish products is 68.6%. There are also taxes of 4% and 10% to be added to most products.
Despite reforms, Indian tariffs are still among the highest in the world, especially for goods that are also produced domestically. In the Uruguay Round, India undertook a two-tiered commitment on industrial products, binding at 40% tariffs on items in excess of 40% percent, and binding at 25% items with tariffs below 40%.
India has an import licensing system. Even though the system was liberalized, there are a number of goods that are subject to strict licensing rules, among them seafood products.
The opening of India’s tax regime has reduced tariff levels, but it has not eased some of the most burdensome aspects of the customs procedures. Documentation requirements are extensive and delays are frequent. There have also been private sector reports of misclassifications and incorrect valuation of goods for the purpose of duty assessments, as well as alleged corruption.
India is a member of the South Asian Preferential Trade Agreement (SAPTA). The other members are Bangladesh, Bhutan, Maldives, Nepal, Pakistan and Sri Lanka. The SAPTA agreement came into force in 1995, and was notified by the Committee on Regional Trade Agreements in 1997 under the enabling clause.
Commodity Balance (1997-98)
| |
Production |
Imports |
Exports |
Total food supply |
Per capita supply |
|
‘000 t live weight |
kg |
||||
|
Fish for direct human consumption |
5 378 |
Negligible |
385 |
4 670 |
4.8 |
|
Non food uses |
780 |
- |
- |
- |
- |
Estimated employment (1997):
|
Primary sector: |
Full time fisherfolk: |
2.40 million |
|
|
Part time: |
1.45 million |
|
|
Occasional: |
2.11 million |
|
|
Total |
5.96 million |
|
Secondary sector: |
N/A. |
|
Gross value of fisheries output (1997-98) (at ex-vessel prices, estimate): US$ 4 845 million (= 1.47% of GDP)
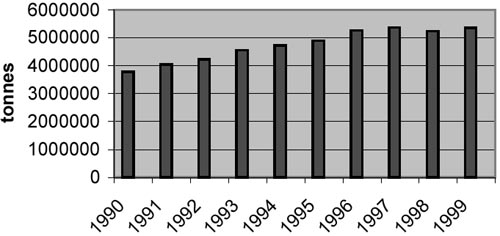
Indian fish production increased from 3.7 million tonnes in 1990 to 5.3 million tonnes in 1999. Most of the production in 1999 consisted of carp, barbel and other cyprinids (2.2 million tonnes), followed by redfishes, etc. (0.7 million tonnes), miscellaneous fresh water fish (0.4 million tonnes), marine fish and shrimps/prawns (0.3 million tonnes).
Figure 8. Seafood production in India, 1990-1999 (quantity; tonnes)
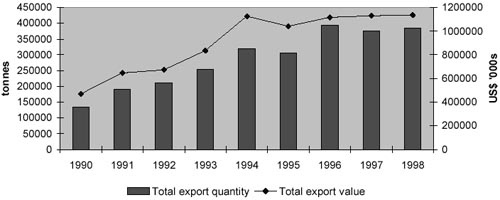
In 1998 India was the 20th-largest exporter of fish and fish products, when ranked by value, with a total export of 384 474 t, worth US$ 1 100 million. Exports showed a steady increase during the 1990s, improving from 133 572 t in 1990, to 384 474 t in 1998, while value went from US$ 467 million to US$ 1 134 million. With regard to export, there was no significant change around the time of the launch of the Uruguay Round agreements.
Figure 9. Seafood exports from India, 1990-1998
Most of Indian exports have gone to Japan, followed by the United Arab Emirates, USA and EU. However, Southeast Asian countries, such as, Thailand, Singapore, China (Hong Kong SAR) and Malaysia, are also important markets for Indian seafood. The increase in exports has mainly been stimulated by higher demand in the Japanese market, but also USA and the United Arab Emirates import more fish from India. The EU has been a more unstable market, as imports from India have fluctuated, but after years of decline, the exports here seemed to be on the rise again in 1999.
Figure 10. Seafood exports from India (1994-1998; value in Indian rupees)
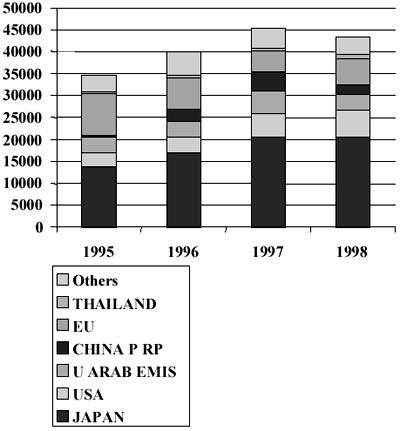
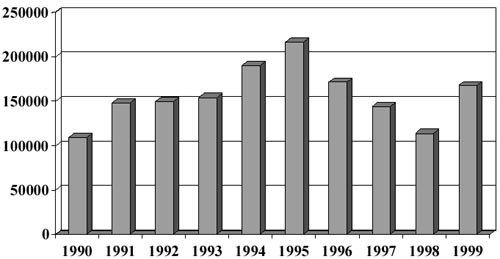
Figure 11. Seafood exports from India to the EU, 1990-1999 (value; € 000s)
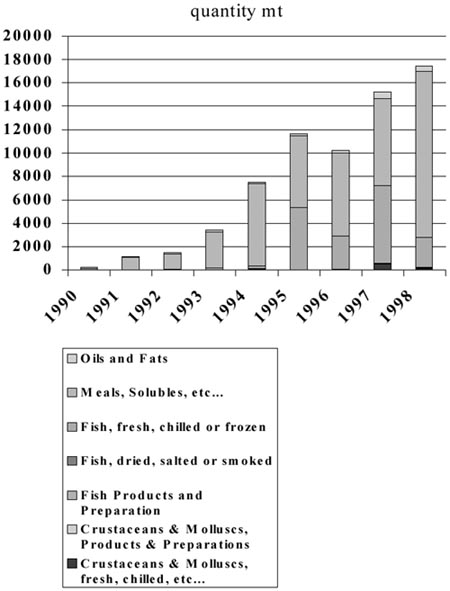
The situation for imports is quite different. From being a country where no imports were allowed, imports quickly increased when the borders were opened, though the level of imports is still very low. India’s imports consist primarily of fishmeal. The one other product India has been importing is hilsa from Bangladesh. In 1998, 97% of the imports of fresh and frozen fish came from Bangladesh.
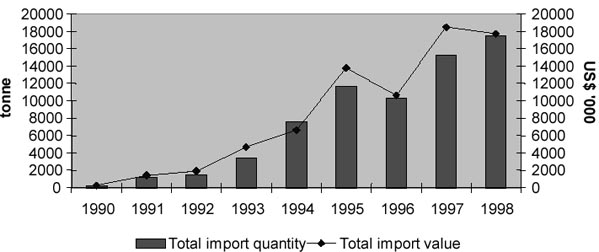
Figure 12. Total seafood imports by India, 1990-1998 (quantity in tonnes; value in US$ ‘000s)
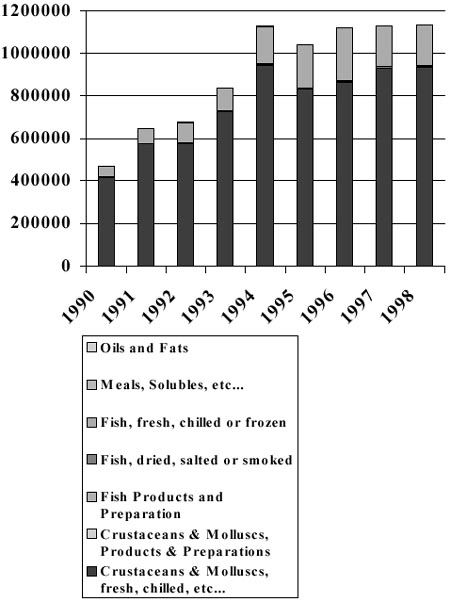
In 1998, 82% of India’s export were fresh or frozen crustaceans and molluscs, and 17% were dried or salted fish. These two commodity groups have been the major groups during the whole decade, though the export of fresh and frozen crustaceans and molluscs have increased the most in value.
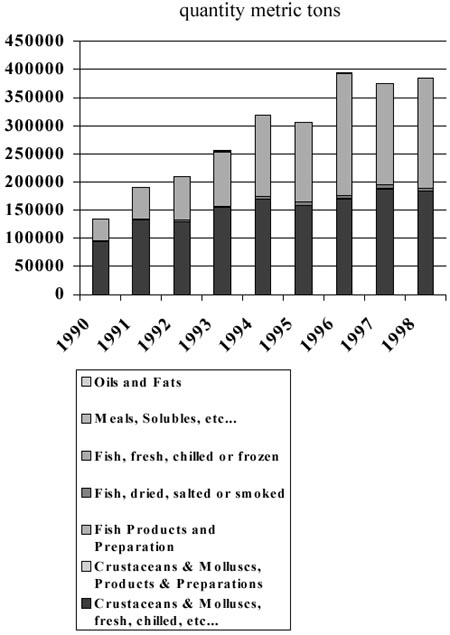
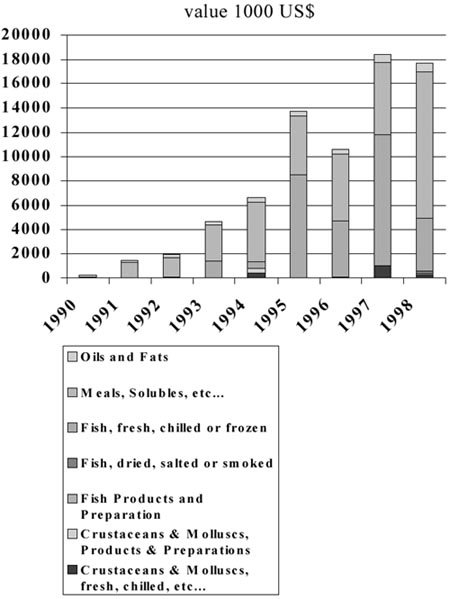
As India for a long time in reality exercised an import ban, through high tariffs and complicated licensing schemes, the level of imports was very low. There has been an increase from 1994 onwards, but the quantity is still very low. Most of the import consists of fishmeal and fish oil, with a significant quantity of fresh hilsa imported from neighbouring Bangladesh.
Figure 13. Overview of exports of seafood from India, 1990-1998
India export commodity groups 1990 - 1998 - a
India export commodity groups 1990 - 1998 - b
|
Export value |
1990 |
1991 |
1992 |
1993 |
1994 |
1995 |
1996 |
1997 |
1998 |
|
Crustaceans & Molluscs, fresh, chilled, etc... |
417783 |
573162 |
576967 |
724852 |
943349 |
829591 |
861854 |
929649 |
933964 |
|
Crustaceans & Molluscs, Products & Preparations |
45 |
532 |
223 |
2420 |
3778 |
2276 |
5479 |
823 |
953 |
|
Fish Products and Preparation |
|
523 |
301 |
26 |
455 |
9 |
1167 |
12 |
|
|
Fish, dried, salted or smoked |
2885 |
2736 |
1917 |
1978 |
3966 |
4635 |
4596 |
9839 |
6781 |
|
Fish, fresh, chilled or frozen |
46458 |
70383 |
93554 |
106143 |
173506 |
203880 |
242654 |
187407 |
192564 |
|
Meals, Solubles, etc... |
1 |
75 |
113 |
413 |
73 |
277 |
50 |
3 |
370 |
|
Oils and Fats |
182 |
241 |
294 |
148 |
313 |
3 |
163 |
|
3 |
|
Export Quantity |
1990 |
1991 |
1992 |
1993 |
1994 |
1995 |
1996 |
1997 |
1998 |
|
Crustaceans & Molluscs, fresh, chilled, etc... |
93816 |
132030 |
130402 |
154387 |
168908 |
158033 |
168957 |
187723 |
183316 |
|
Crustaceans & Molluscs, Products & Preparations |
12 |
44 |
28 |
164 |
325 |
200 |
800 |
344 |
440 |
|
Fish Products and Preparation |
|
118 |
60 |
7 |
46 |
1 |
366 |
4 |
|
|
Fish, dried, salted or smoked |
1645 |
3005 |
2317 |
2237 |
4861 |
6293 |
5545 |
7149 |
4299 |
|
Fish, fresh, chilled or frozen |
37847 |
54581 |
75993 |
96579 |
144184 |
141394 |
217489 |
179419 |
196140 |
|
Meals, Solubles, etc... |
|
214 |
605 |
1404 |
342 |
2 |
126 |
5 |
275 |
|
Oils and Fats |
252 |
296 |
152 |
81 |
91 |
|
42 |
|
4 |
Figure 14. Overview of imports of seafood into India, by commodity, 1990-1998
India import commodity groups 1990 - 1998 - a
India import commodity groups 1990 - 1998 - b
|
Import Quantity |
1990 |
1991 |
1992 |
1993 |
1994 |
1995 |
1996 |
1997 |
1998 |
|
Crustaceans & Molluscs, fresh, chilled, etc... |
|
|
|
14 |
67 |
|
39 |
544 |
120 |
|
Crustaceans & Molluscs, Products & Preparations |
|
|
|
|
50 |
|
1 |
26 |
5 |
|
Fish Products and Preparation |
|
2 |
2 |
|
|
|
2 |
|
33 |
|
Fish, dried, salted or smoked |
|
|
|
|
|
|
|
|
32 |
|
Fish, fresh, chilled or frozen |
|
1 |
28 |
171 |
280 |
5378 |
2859 |
6670 |
2635 |
|
Meals, Solubles, etc... |
116 |
1072 |
1365 |
3069 |
6954 |
6077 |
7066 |
7425 |
14166 |
|
Oils and Fats |
71 |
98 |
114 |
174 |
204 |
194 |
270 |
540 |
427 |
|
Import Value |
1990 |
1991 |
1992 |
1993 |
1994 |
1995 |
1996 |
1997 |
1998 |
|
Crustaceans & Molluscs, fresh, chilled, etc... |
|
|
22 |
36 |
426 |
|
115 |
996 |
253 |
|
Crustaceans & Molluscs, Products & Preparations |
|
|
|
|
361 |
|
1 |
29 |
23 |
|
Fish Products and Preparation |
4 |
12 |
9 |
2 |
|
|
6 |
|
111 |
|
Fish, dried, salted or smoked |
10 |
5 |
|
|
1 |
|
6 |
|
201 |
|
Fish, fresh, chilled or frozen |
|
9 |
89 |
1347 |
560 |
8469 |
4609 |
10734 |
4365 |
|
Meals, Solubles, etc... |
115 |
1226 |
1550 |
2981 |
4890 |
4919 |
5423 |
5949 |
12006 |
|
Oils and Fats |
141 |
187 |
227 |
272 |
380 |
356 |
454 |
704 |
733 |
![]()
![]()
![]()