![]()
![]()
![]()
The fisheries of the region are very various, ranging from those based on the relatively abundant resources of the Atlantic coast of Morocco, often exploited by fleets of large industrial vessels, to fisheries based on relatively poor resources and often exploited by individuals with low cost vessels and simple gear, working from the beach or on inland waters. In certain localities, fisheries provide an important source of employment and income.
However, no country in the region depends substantially on fish and fish products as a mainstay of its economy. It is only in Morocco that a substantial industry has been built up using marine fish as the main resource for large-scale industrial processing and export of fish products (FAO, 1996a). In 1999, Morocco dominated, with 47% of the total marine and inland fisheries catch, followed by Egypt (38%), Algeria (7%), Tunisia (6%) and the Libyan Arab Jamahiriya (2%).
In 1999, total capture and aquaculture production of the five countries, considered as a group, was around 1 600 000 t, a growth of 11% compared to the previous year and 48% compared to the beginning of the data series (in 1988). In the period 1988-1999, fishery production in this area increased by an average of 4% annually.
The most evident increase (Figure 1) is that for Egypt, where fishery production had a growth rate of 21% compared to 1998, and 113% compared to the first year of the series (1988). Even if more modest and with a wider variability, Moroccan fishery production shows an upward trend: from 550 000 t in 1988, to a peak of about 860 000 t in 1995, falling back to 760 000 t in 1999, while Algerian, Libyan and Tunisian production has remained quite stable.
Figure 1. Capture and aquaculture production, North African Mediterranean countries, 1988-1999 (quantity; metric tonnes)
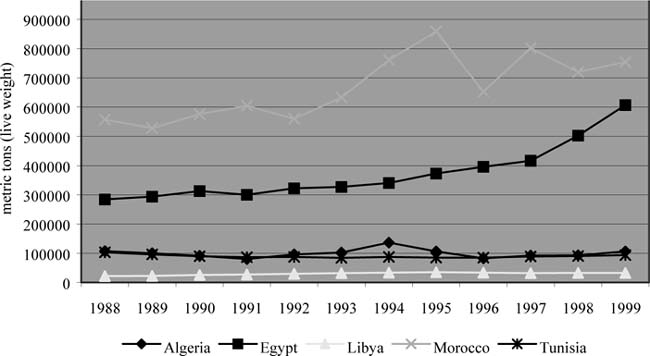
(SOURCE: FAO FishStat, 2001)
Regarding processed fishery products, in 1999, these five countries had an output of 362 000 t, consisting mainly of canned fish (28% of the total) and of crustaceans and molluscs (together forming 27%). These two commodity groups represent the bulk of the fishery products that these countries exported. Fresh, chilled and frozen fish accounted for 21%, whereas fish meal production was 16% of the total.
Morocco is the principal processor of fish products, with 79% of the total; Egypt and Tunisia follow with, respectively, 13% and 6%; Algeria and the Libyan Arab Jamahiriya both represent about 1% of total production.
Regarding fish trade with foreign countries, the five countries, considered as a group, had, in 1999, a negative trade balance in the fishery sector, equal to -8 000 t (Figure 2, based on Table A1.11). However, Figure 2 shows that the negative fishery trade balance (in quantity terms) is only a feature of the most recent years of the series, with the exception of 1997.
Figure 2. Fish trade balance of North African Mediterranean countries, by weight, 1988-1999
(SOURCE: FAO FishStat, 2001)
Figure 3. Fish trade balance of North African Mediterranean countries, by value (US$), 1988-1999.
SOURCE: FAO FishStat, 2001
In financial terms, the trade balance is positive for all the years of the series and in 1999 was about US$ 700 million (Figure 3, based on Table A1.11). This is due to the great difference between the unit values of items exported and imported. In fact, in 1999, while the average export price was US$ 3 255/t (ranging from a minimum of US$ 1 722/t for Egypt to a maximum of US$ 7 183/t for Tunisia), imports averaged US$ 717/t (from a minimum of US$ 623/t for Egypt to a maximum of US$ 3 359/t for the Libyan Arab Jamahiriya). This reflects principally the composition of exports. Thus fish (canned), crustaceans and molluscs (the bulk of export production of the North African Mediterranean Countries and mainly destined for foreign markets) had higher unit values than the imported products. This directly influenced the overall one, shown in Figure 4.
Within the group, Morocco represents, on total exports, almost the only processor (93% of the total), while Egypt is the principal importer, with 83% of total imports of fish products to the area (Table A1.11).
Figure 4. Export and import prices per tonne of fish products of North African Mediterranean countries, 1988-1999.
SOURCE: FAO FishStat, 2001
Exports of these five countries, considered together, represent around 26% of overall African exports of fish products; the percentage grows to 35% if we consider exports by value. This means that, on average, fish product exports originating in the North African area have a higher value than those originating from the African continent as a whole. Fish product imports to the area account for around 20% of the overall value of African imports (22% by value).
In 1997, 67% of the total fish supply (internal production plus imports) was destined for food, with 21% used for non-food uses, mainly as feed. The equivalent percentage was 45% for Morocco, where the great bulk of internal production and fish imports is destined for poultry feed (Table A1.12).
The total fish food supply of the five countries in 1997 was equivalent to 1 076 000 t live weight. With a population of 135 million, the area had an annual seafood supply of about 8 kg per capita, from a maximum of 10 kg for Egypt to a minimum of 3.5 kg for Algeria (Table A1.12).
An overview of seafood supply and consumption for the five countries shows a great range in the fish food consumption among the countries of the group. Clearly, fish products have greater importance in the diet of Egyptians, Moroccans and Tunisians. The preference for seafood is certainly and directly influenced by the role of tourism in these three countries, which is of great economic importance, as demonstrated by the data in Tables A1.13 - 17, which give both the balance of foreign travel, more empirical indicators related to local tourist infrastructure, such as the number of hotel beds, and the number of tourists arriving. These are summarized in Table 1, based on the data in Tables A1.13 - 17.
Fish protein provides 2.1 g per capita per day, equal to 11.6% of the overall contribution of animal protein to the daily per capita food share in the region. At the same time, fish protein represents 2.6% of the total protein in the daily food share (Table A1.12).
Detailed data on fishery production and the fish trade (import-export) of the five countries are given in Appendix 1, with Appendix 5 providing an overview of the fishery sector for each country.
Table 1. Summary of tourism-related data for the North African Mediterranean countries in 1997
|
|
No. of tourists(1) |
No. of hotel beds(2) |
Balance of foreign travel (3) |
|
Algeria |
635 000 |
65 704 |
US$ (20 million) |
|
Egypt |
3 961 000 |
150 986 |
US$ 2 380 million |
|
Libya |
850 000 |
15 267 |
US$ (125 million) |
|
Morocco |
3 203 000 |
125 091 |
US$ 1 133 million |
|
Tunisia |
4 392 000 |
178 176 |
US$ 1 179 million |
NOTES: (1) Number of tourists,i.e. international inbound tourism, is the number of visitor arrivals. A person who makes several trips to a given country during a given period will be counted each time as a new arrival. (2) Number of hotel beds refers to the capacity of establishments offering accommodation available during the peak period of the tourist season. (3) Balance of foreign travel is calculated by subtracting “Tourism Expenditures” from “Tourism Receipts.”
SOURCE: From the SESRTIC [Statistical, Economic and Social Research and Training Centre for Islamic Countries] website (www.sesrtic.org)
![]()
![]()
![]()