![]()
![]()
![]()
Fish trade between North African Mediterranean countries and EU countries has been, since the beginning of the period analysed in this report, quite interesting. Import and export flows to and from EU countries represent a large part, in some case the great bulk, of total fish trade.
Table 7 indicates the trend in imports and exports of fish products to and from all the World and EU countries. A general increasing trend for overall exchange trade is evident, although exchange flows in the fishery sector with EU countries have gradually increased relative to the total.
Table 7. Fish trade (quantity) between North African Mediterranean countries and the world and the EU
|
|
1988 |
1989 |
1990 |
1991 |
1992 |
1993 |
1994 |
1995 |
1996 |
1997 |
1998 |
1999 |
|
Imports (thousands of metric tonnes of product weight) |
||||||||||||
|
From world (1) |
189 |
162 |
159 |
120 |
162 |
132 |
188 |
168 |
231 |
160 |
257 |
284 |
|
From EU (2) |
39 |
41 |
47 |
43 |
35 |
61 |
77 |
94 |
87 |
94 |
183 |
172 |
|
EU/world (%) |
21 |
26 |
29 |
36 |
22 |
46 |
41 |
56 |
38 |
59 |
71 |
61 |
|
Exports (thousands of metric tonnes of product weight) |
||||||||||||
|
To world (1) |
202 |
190 |
202 |
231 |
200 |
214 |
226 |
254 |
218 |
219 |
252 |
276 |
|
To EU (2) |
98 |
99 |
116 |
133 |
120 |
113 |
130 |
122 |
132 |
147 |
149 |
156 |
|
EU/world (%) |
49 |
52 |
57 |
58 |
60 |
53 |
58 |
48 |
61 |
67 |
59 |
56 |
NOTES: (1) Data from FAO FishStat, 2001. (2) Data from Comext-Eurostat
The ratio of imports of fish products from EU to imports of fish products from all the world was 21% in 1988, whereas it was 71% a decade later. An increasing importance for fish trade flows can also be noted for outward flows, even if more moderate. Fish exports to the EU from the North African Mediterranean area represented 49% of their total fish exports in 1988, and gradually increased to become 56% in 1999.
From the above few words on the fish trade relationship between the EU and Algeria, Egypt, the Libyan Arab Jamahiriya, Morocco and Tunisia, considered here as a unique area and market, it is clear that there has been increased fish trade relations. This is directly linked to the steady effort made to create an area of free trade involving all the Mediterranean countries, to both north and the south. To this must be added that countries of the Mediterranean coast of Africa and countries of southern Europe (namely France, Greece, Italy and Spain) have common features reflecting geographic closeness and similar food preferences.
Detailed data for fish trade among North African Mediterranean countries and the EU are given in tables in Appendix Tables A1.18 - 39.
During 2000, fish products originating from Algeria, Egypt, the Libyan Arab Jamahiriya, Morocco and Tunisia and destined for the EU market amounted to 200 000 t for a value of around € 631 million[2]. Figure 5 shows, for the period 1988-2000, an increasing trend in exports to the EU of fish products originating in the area analysed in this paper. The amounts range from a minimum value of 98 000 t (1988) to a maximum of around 200 000 t (2000).
Figure 5. Exports of fish products from North African Mediterranean countries to the EU, 1988-2000
SOURCE: Comext-Eurostat
The increase in the volume of exports has been mainly due to increases in Moroccan fish exports. In fact, of the five countries, Morocco is the major exporter to the EU; in 2000, 93% of fish products (in quantity terms) exported to the EU from this area originated in Morocco. As can be seen in Figure 6, the role of Morocco as the main exporter to the EU became more marked during the second half of the period 1988-2000. Tunisia follows, with a smaller share.
Figure 6. Exports of fish products from North African Mediterranean countries to the EU, 1988, 1994 and 2000
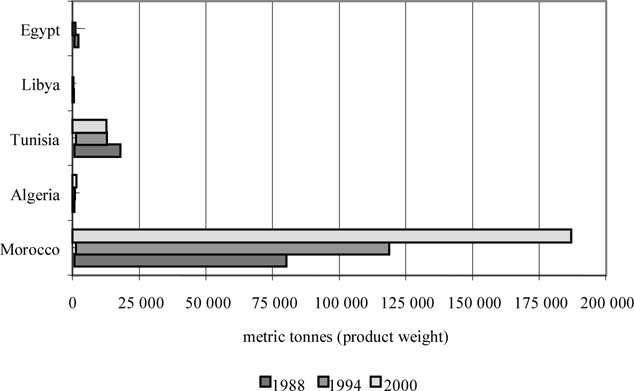
SOURCE: Comext-Eurostat
In contrast, in 2000 the five countries as a group imported about 173 000 t of fish and fish products from their EU partners, with a value of € 130 million. As for exports, imports from the EU tended to increase, even if more slowly and erratically. After have being quite stable in the first five years of the period, they grew steadily between 1992 and 1997, with a jump in 1998, almost doubling (from 94 000 t to 185 000 t) the 1997 figure. In the last two years of the historical data series (1999-2000) they were quite stable at about 173 000 t (see Figure 7).
Egypt was the largest importer of fish commodities from the other side of the Mediterranean, buying 81% in terms of quantity (63% in value terms). Morocco followed with a much smaller share, equal to 13% (24% in value terms) (see Figure 8).
Figure 7. Imports of fish products into the North African Mediteranean countries from the EU, 1988-2000
SOURCE: Comext-Eurostat
Figure 8. Imports of fish products into North African Mediterranean countries from the EU, 1988, 1994 and 2000
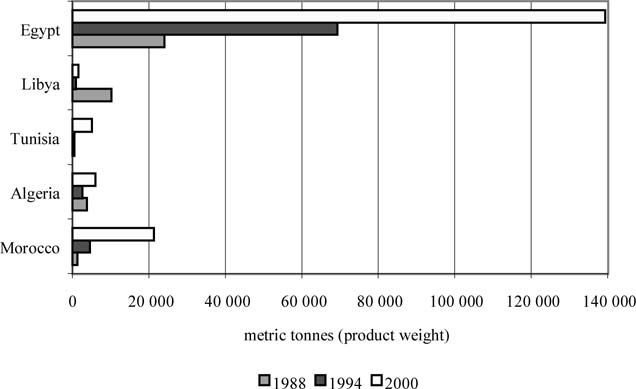
SOURCE: Comext-Eurostat
For the period 1988-2000, Morocco showed good performance. During all the period, both export and import flows were characterized by an increasing trend. As Figure 9 shows, Morocco has been a net exporter: the fish trade balance, in terms of quantity, has been always positive, with a maximum value of around 170 000 t in 2000. With the exception of the first year of the data series, fish trade balance in terms of value was always positive, peaking at € 500 million in 2000, when Morocco exported 190 000 t of fish and fish products to the EU for a value € 540 million.
The major buyer of Moroccan fish products was Spain, importing around 60% of fish products coming to the EU from Morocco. Italy and France followed, taking 14% and 8%, respectively, of total Moroccan fish exports. In terms of quantity, the main customers were Spain (107 945 t), Italy (26 411 t), France (15 452 t), the Netherlands (9 441 t), Germany (9 172 t), the United Kingdom (8 330 t), Greece (4 258 t), and Belgium and Luxembourg (1 363 t).
In contrast, in 2000, Morocco imported around 22 000 t of fish commodities, worth € 31 million. Moroccan fish imports came primarily (86%) from the Netherlands, with some from Spain (8%) and from Belgium and Luxembourg (considered together).
Figure 9. Fish trade balance between Morocco and the EU (quantity; 1988-2000)
SOURCE: Comext-Eurostat
The great bulk of exports, 40% of the total, consists of molluscs (live, fresh, chilled, frozen, dried, salted or in brine) and of meal and pellets obtained by processing of aquatic invertebrates (Combined Nomenclature (CN) code 0307 - for a list of the CN codes, see Appendix 2).
In contrast, imports from the EU (mainly coming from the Netherlands) are made up, almost totally (90%) of crustaceans (live, fresh, chilled, frozen, dried, salted or in brine, and also crustaceans in shell, cooked by steaming or by boiling in water) (CN code 0306).
In terms of trade exchange with the EU, Algeria has been for the whole 1988-2000 period a net importer. In fact, with the exception of a limited surplus in the early 1990s, the fish trade balance, in terms of quantity, was in deficit for all the period (Figure 10). This applied also to trade in terms of value.
Figure 10. Balance of fish trade between Algeria and the EU (quantity; 1988-2000)
SOURCE: Comext-Eurostat
In the whole period under consideration, Algeria has had fish exchange trade principally with only three EU countries, namely Spain, Italy and France, with some imports from the Netherlands in the period 1994-98.
Spain is the major, and almost only, fish trade partner; for example, in 2000, 84% of Algerian fish products went to the Spanish market, and nearly all supply of EU origin came from Spain. Imports in 2000 were from Spain (5 596 t), France (215 t) and Italy (34 t), while exports were to Spain (1 003 t), France (108 t) and Italy (77 t).
Algerian exports of fish products to the EU in 2000 consisted (some 65%) of live and processed crustaceans (CN code 0306), while another 24% was molluscs (live and processed; CN code 0307).
The main fish products imported into Algeria in 2000 were frozen fish, not including frozen fish fillets (CN code 0303).
Even if positive for all the period 1988-2000, Tunisian exchange trade with EU countries has been characterized by a decreasing trend in the fish trade balance. From a surplus (exports to EU minus imports from EU) of around 17 000 t at the beginning of the period, this difference had dropped to less than 8 000 t in 2000 (Figure 11). In fact, overall, there has been a decrease in exports of fish commodities and an increasing dependence on supplies of fish products from EU sources.
Figure 11. Evolution of fish trade between Tunisia and the EU (quantity; 1988-2000)
SOURCE: Comext-Eurostat
In 2000, Tunisia exported 12 487 t of fish and fish products to the EU, worth around € 4.5 million, mostly to Italy (55%) and Spain (37%). Export destinationas in the EU for Tunisian products in 2000 were Italy (6 869 t), Spain (4 582 t), France (705 t), Greece (212 t), Germany (42 t), Portugal (31 t), the United Kingdom (23 t), and Belgium and Luxembourg (23 t).
In comparison, Tunisia imports in 2000 came only from three EU countries. France was the main supplier (2 888 t), with 58% of fish products originating in the EU, followed by Spain (1 205 t; 24%) and Italy (907 t; 18%). In the past, in the early 1990s, Tunisia’s fish market was also supplied by the Netherlands for crustaceans (live and processed).
Tunisian exports of fish products to EU destinations in 2000 were live and processed crustaceans (CN code 0306) (60%) and another 37% made up of molluscs (live and processed; CN code 0307).
The imports from France, Italy and Spain in 2000 consisted almost totally of frozen fish, excluding frozen fish fillets (CN code 0303).
For all the period under consideration, Libyan imports of fish products from EU sources were higher than exports. In fact, as shown in Figure 12, the fish trade balance, in terms of quantity, from 1998 to 2000 was always in deficit. This applies also to trade in terms of value. In 1998, it peaked, with imports exceeding exports by 11 000 t, a deficit of around -€ 33 million.
Figure 12. Fish trade balance between the Libyan Arab Jamahiriya and EU countries (quantity; 1988-2000)
SOURCE: Comext-Eurostat
The almost sole EU buyers of Libyan exports in 2000 were the United Kingdom and Greece, which both took 50%, in quantity terms, of total exports to the EU, comprising equally live fish and fresh or chilled fish, excluding fillets (CN codes 0301 and 0302).
Spain was the major source in 2000, supplying 92% (1 250 t) of fish products from the EU, with small quantities from the Netherlands (82 t), Italy (32 t) and the United Kingdom (2 t). The most imported fish commodities in 2000 were prepared and preserved fish and caviar or its substitutes (CN code 1604).
Of the five countries considered in this paper, Egypt is the major importer of fish products originating from EU sources. At the same time, for all the period 1988-2000, imports were very much higher than exports; as a result, the fish trade balance showed a deficit that, starting from a value of -22 000 t (corresponding to € 0.6 million) at the beginning of the period, deteriorated progressively until in the last three years it peaked, in 1998, at -145 000 t (equivalent to a trade deficit of € 55 million (see Figure 13).
Egypt’s exports of seafood destined for the EU in 2000 went primarily to Italy, Greece and Spain, buying 37%, 30% and 22%, respectively. The quantities involved were small: Italy, 32 t; Greece, 26 t; Spain, 19 t; France, 6 t; and others, 3 t.
As for imports of fish products, Egypt was mainly supplied by the Netherlands, which, in 2000, provided around 50% of total fish products imported from EU sources. Ireland, Denmark and the United Kingdom followed, with around 25%, 12% and 10% of the EU supply, respectively. In quantity terms, the EU sources of Egypt’s imports of seafood products were the Netherlands (65 201 t), Ireland (36 849 t), Denmark (16 154 t), the United Kingdom (13 735 t), Germany (6 089 t), Spain (1 204 t), and others (240 t).
Figure 13. Fish trade balance between Egypt and the EU (quantity; 1988-2000)
SOURCE: Comext-Eurostat
Egyptian exports of fish products to EU destinations in 2000 were 65% molluscs (live and processed; CN code 0307), while imports were principally frozen fish, excluding frozen fish fillets (CN code 0303).
In 2000, EU consumption of seafood was supplied by a total amount of fish and fish products coming from Algeria, Egypt, the Libyan Arab Jamahiriya, Morocco and Tunisia, as a group, equal to around 200 000 t, with a value of about € 631 million. The principal importer was Spain, taking 57% of total EU imports from the North African Mediterranean area. Italy, France and the Netherlands bought, respectively, 17%, 8% and 5% of the total. Overall, exports from the five countries to EU countries were to Spain (113 549 t), Italy (33 389 t), France (16 271 t), the Netherlands (9 441 t), Germany (9 214 t), the United Kingdom (8 364 t), Greece (4 505 t), Portugal (3 941 t), and Belgium and Luxembourg (1 387 t).
It is interesting to note that, during the period under consideration (1988-2000), there was a change in the distribution of import market shares among the main EU importers of fish products from the North African Mediterranean area. Spanish and Dutch imports became more marked, while Italy and France became less dependent on North African fish supplies (see Figure 14).
In 2000, EU exports of fish and fish products to the North African Mediterranean countries were equal to around 173 000 t, with a value of about € 130 million.
The main suppliers of the whole fish market of Algeria, Egypt, the Libyan Arab Jamahiriya, Morocco and Tunisia, considered together, were principally north European countries, namely the Netherlands, Ireland, Denmark and the United Kingdom, with, respectively, 48%, 21%, 9% and 8% of the seafood demand met by European supply. Supplies to the North African Mediterranean area as a whole in 2000 were from the Netherlands (83 448 t), Ireland, 36 851 t), Denmark (16 160 t) the United Kingdom (13 950 t), Spain (10 970 t), Germany (6 120 t), France (3 310 t), Italy (1 246 t), and Belgium and Luxembourg (611 t).
In Figure 15, it is interesting to note that, during the period 1988-2000, Italian seafood supply to the North African Mediterranean countries gradually reduced; in fact, while in 1988 Italian exports of fish products represented 14% of total EU fish exports to the area, in 1994 this share had dropped to 3% and in 2000 to 1%. Also, Denmark lost export market share whereas the United Kingdom gained.
For all the last decade, the average import prices of fish products originating in the North African area and entering the EU were higher than export prices. Import prices ranged from € 2 700/t to € 3 300/t, whereas prices of fish products coming from EU sources and destined for the North African market had a lower value, about € 400/t in 1990, and a maximum value of € 750/t in 2000.
This great gap between the inward and outward prices reflects the composition of the two fish trade flows. Imports to the EU comprise, for the most part, fish (fresh or chilled), molluscs and prepared or preserved fish, like caviar and substitutes.
These commodities have, undoubtedly, a higher market value than frozen fish (excluding fillets) and flours, meals and pellets that constitute the greater part of EU seafood exports to the countries covered in this paper. It is no coincidence that the major exporters are the northern EU countries that specialize in the processing of fish for the production of frozen seafood and fish meals and pellets.
Figure 14. Changes in market share over time for EU importers of seafood products to the North African Mediterranean countries.
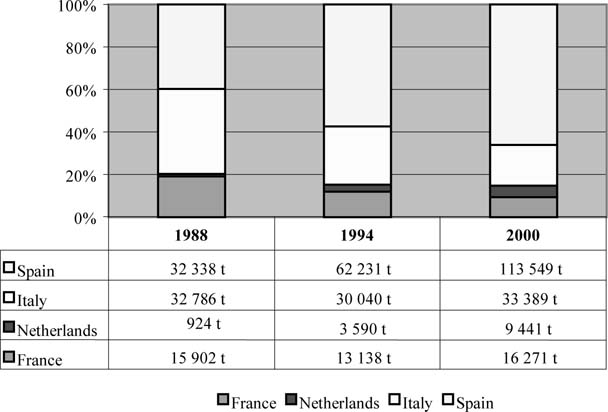
SOURCE: Comext-Eurostat
Figure 15. Changes in market share over time for EU exporters of seafood products to the North African Mediterranean countries.
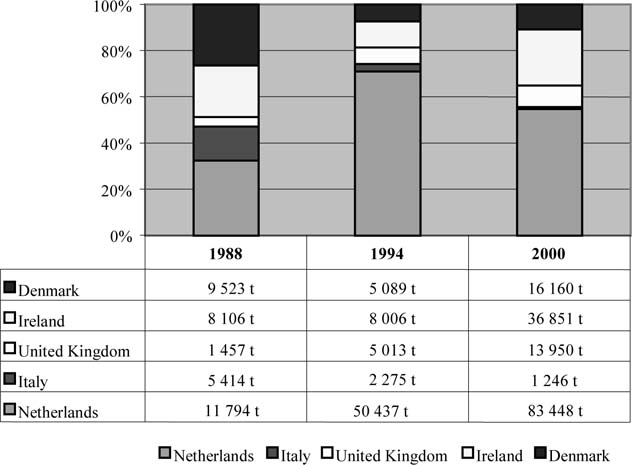
SOURCE: Comext-Eurostat
|
[2] Import and export data in
the Eurostat-Comext databank are expressed in metric tonnes for quantity, and in
ECU ‘000s for values. With the advent of European Monetary Union and the
introduction of the Euro, the official ECU basket ceased to exist and the
specific name “Euro” substituted the generic term “ECU.” The
substitution by the Euro has been made at par, as stated in the Maastricht
Treaty. This implies that, since 1 January 1999, all the Eurostat-Comext data
are expressed in Euros (€) even if, for reasons of homogeneity, the
databank still uses the term ECU. |
![]()
![]()
![]()