Once S. Enteritidis-contaminated eggs are produced, they undergo multiple stages of handling and storage before they are finally consumed. After the eggs are collected in the hen house, they may be processed, transported and stored for varying times under variable environmental conditions. The distribution and storage stage covers the period after the eggs are laid until the eggs arrive at a point where they are prepared, possibly cooked, and consumed.
Generally, the distribution and storage stage is concerned with two things: (1) the effect of time and temperature on the S. Enteritidis within contaminated eggs, and (2) the fraction of eggs that are marketed as fresh table eggs versus the fraction marketed in some other form. For example, some shell eggs may be sent to a pasteurization plant or cooked before sale.
Important inputs to include in this part of the exposure assessment model are algorithms for predicting the microbial dynamics within eggs; time and temperature distributions; and marketing fractions. Egg thermodynamics may also be explicitly modelled to simulate internal egg temperature as a function of ambient temperature.
The output of the distribution and storage stage should consist of a frequency distribution for the contamination levels in eggs just before preparation, cooking and consumption. Changing concentration of bacteria in eggs depends on the lag period before S. Enteritidis growth. Lag period is the period during which bacteria adjust to environmental conditions. Lag period inside an egg is a complex function of nutrient availability, pH, time and temperature (Humphrey, 1999).
In Monte Carlo simulations, the modelling of the paired occurrence of concentration and lag period requires that individual eggs are, to some extent, kept track of as they move through the various stages of distribution and storage. These individual eggs can then be carried over to the preparation and consumption stage for further consideration. In this manner, the attributes of organisms per egg and lag period remaining are paired at the individual egg.
Marketing fractions
As eggs move from the farm to table, there are two general users to consider: homes and food service institutions. Home users of eggs generally purchase their eggs from retail settings, while institutional users of eggs (e.g. restaurants and hospitals) get their eggs from wholesale distributors or directly from the producer.
If it is assumed that on average eggs are handled differently by these different users, then at least two growth pathways should be included in any S. Enteritidis exposure assessment model. In this case, the marketing route categorizes the outputs of the distribution and storage stage.
Shell eggs will also be marketed either as table eggs or as eggs to be broken and sold as processed egg products. It is likely that the marketing route influences the period (and possibly temperatures) that eggs experience in the distribution and storage stage. For example, some eggs are diverted to egg products processors following grading. These eggs may have a distribution of transport time post-processing that is different from eggs destined for table egg markets. Another example might be eggs that are directly marketed for egg products. Such eggs will probably spend less time in processing because they do not undergo candling or grading or sorting (so-called "nest run" eggs).
Marketing fractions are path probabilities that determine what fraction of contaminated eggs experience the time and temperature conditions of specific pathways. These are important inputs to an exposure assessment.
Data
Both the Health Canada and US SE RA exposure assessments determined that about 25% of all table eggs consumed were marketed to institutional users. These users consumed 18% of all eggs produced in the United States of America, but after adjusting for the 28% of eggs that are marketed as processed egg products, institutional users consume 25% of the table eggs (Table 4.6). The Whiting and Buchanan (1997) exposure assessment was not concerned with table eggs, so user fractions were not considered.
Table 4.6. Distribution of eggs by market outlet, as estimated for USA production
|
Egg market |
Million cases(1) of eggs |
Proportion of all eggs |
|
Retail |
94 |
53% |
|
Egg products processing |
49 |
28% |
|
Food service |
31 |
18% |
|
Exported |
3 |
2% |
NOTE: (1) A standard USA case of eggs contains 360 eggs (30 dozen).
SOURCE: US SE RA
Time and temperature
Eggs may be stored before and after they are sold. They may be transported to and from wholesale or retail distributors. Times and temperatures during storage and transportation vary. Given the low frequency of contaminated eggs, it is reasonable to consider these eggs as independent from each other regarding the times and temperatures they experience.
An exposure assessment model must consider the different times and temperatures that contaminated eggs experience. Therefore, distributions of time and temperature must be included in the model. Such distributions should, for example, describe the proportion of eggs that experience different temperature at a given stage. Furthermore, a different distribution for the same stage must describe the proportion of eggs that are maintained in that stage for different times. It might be assumed that there is some negative correlation between time and temperature within a particular stage. It seems reasonable to expect that eggs held at higher temperatures are held for shorter times, but there is no evidence available to estimate such a correlation and it is possible that the correlation is only applicable over a portion of the temperature and time distribution.
For convenience, models of distribution and storage typically describe the passage of time in discrete steps. Clearly, an egg can experience a constantly changing environment from the point of lay until consumption. Describing distributions for ambient temperature within a discrete stage is nearly impossible without continual data collection. Using expert opinion and available evidence, however, it is possible to estimate a distribution for the length of time that eggs are stored (e.g. on the farm), and a distribution of average ambient temperatures that apply to that storage period.
Data
Times and temperatures for various stages of the farm-to-table continuum are not readily available from the published literature. An exposure assessment portrays the variability in times and temperatures that individual eggs experience between lay and consumption. Not all eggs are handled in the same way, and it is the combination of inordinately high temperatures and times that result in large amounts of S. Enteritidis growth in contaminated eggs.
In the absence of survey or sampling data, other types of information can be used. For instance, the recommended shelf life of eggs can serve as a surrogate for retail storage time. Such a measure has the added advantage of allowing measurement of mitigation effects by adjusting the level of compliance with recommended procedures.
Methods
Table 4.7 summarizes the time and ambient temperature inputs to the Health Canada and US SE RA exposure assessments. The averages portrayed here suggest that the underlying assumptions are similar between the models. In general, the stages modelled are the same between the models, with the exceptions that the Health Canada exposure assessment explicitly delineates pre-collection and wholesale storage stages, and the US SE RA explicitly delineates a post-cooking storage stage. The average cumulative time for an egg to pass through these stages is 429 hours (17.9 days) for the Health Canada and 565 hours (23.5 days) for the US SE RA. The average ambient temperature, weighted for time, is 9°C for the Health Canada and 8°C for the US SE RA. The scope of the Whiting and Buchanan (1997) exposure assessment was limited to pasteurized liquid whole egg, so farm-to-table stages were not modelled explicitly.
Table 4.7. Summary of average input times and ambient temperatures used to model farm-to-table pathways in exposure assessments. Probability distributions are used in these models and the central tendency of each distribution is presented here.
|
Stage |
Health Canada |
US SE RA |
||
|
Av. temp. |
Av. Time |
Av. Temp. |
Av. Time |
|
|
Pre-collection of eggs |
26 |
7 |
N.A. |
N.A. |
|
Storage before transport from farm |
13 |
35 |
13 |
48 |
|
Transport to grading or processing |
13 |
3 |
13 |
1 |
|
Storage before grading or processing |
13 |
13 |
20 |
5 |
|
Grading or processing |
20 |
0.2 |
18 |
1 |
|
Storage after processing or grading |
13 |
62 |
8 |
48 |
|
Transport to wholesale or retail |
13 |
3 |
10 |
6 |
|
Wholesale storage |
4 |
0 |
N.A. |
N.A. |
|
Retail storage |
7 |
142 |
7 |
168 |
|
Consumer storage |
7 |
164 |
7 |
288 |
|
Post-cooking storage |
N.A. |
N.A. |
18 |
1 |
Note: N.A. = not available.
Growth is a function of time and temperature inputs to the exposure assessment models. These inputs can vary by pathway (e.g. home vs institution) as well as within the pathway. The average predicted temperature is greater for the US SE RA model (11°C) than for the Health Canada model (9°C) (Figure 4.14). The temperatures captured in this analysis are ambient temperature in the Health Canada model, and internal egg temperature in the US SE RA model. These parameters determine lag time and growth rates in the respective models. It is noteworthy that the average ambient temperature is actually lower in the US SE RA model (7°C). Nevertheless, accounting for cooling rates in eggs results in higher average internal egg temperatures.
As shown in Figure 4.14, there is much more variability in average temperature per egg for the US SE RA output. Increased variability implies that greater extremes in temperature are possible in this model when compared with the Health Canada model. Sustained higher temperatures result in shorter lag periods and faster growth rates (Humphrey, 1999).
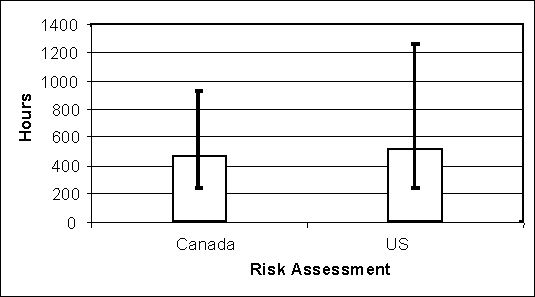
The average time between lay and consumption is longer in the USDA model than in the Health Canada model. Figure 4.15 illustrates that this time is also more variable in the USDA model. Therefore individual contaminated eggs may spend longer in going from the producer to a prepared meal. As with higher temperatures, longer times can be associated with shorter lag periods and greater growth rates within contaminated eggs.
Figure 4.14. Average temperature between lay and consumption for all eggs in two exposure assessment models. In the US SE RA, temperature is internal egg temperature. Error bars depict 95% of the variability in each model.
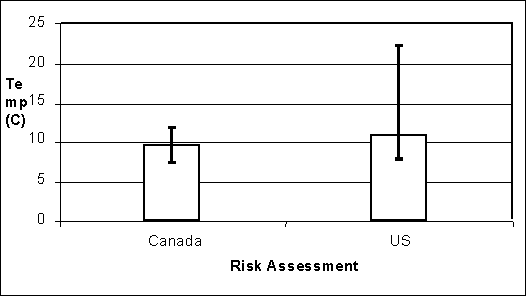
Figure 4.15. Average total time between lay and consumption for all eggs in two exposure assessment models. Error bars depict 95% of the variability in each model.
Microbial growth dynamics
Considering only S. Enteritidis bacteria that are inside the egg soon after lay, available evidence suggests that growth of the bacteria depends on an increase in the permeability of the vitelline (yolk) membrane. This increase allows the bacteria access to critical growth nutrients. However, the change in permeability of the yolk membrane is time and temperature dependent. The process may take three weeks or longer, depending on the temperature at which eggs are held. Until this process is complete, there is little or no growth of S. Enteritidis bacteria within the egg. Essentially, this period represents a lag phase for the bacteria.
Once there is yolk membrane permeability sufficient for S. Enteritidis to grow, multiplication of the bacteria can occur in the egg. The rate of growth of bacteria is also a function of time and temperature. Therefore, as the egg moves from the point of lay to the point of consumption, yolk membrane permeability and growth must be monitored continually with respect to temperature and time. In the US SE RA, the relevant temperature for yolk membrane permeability and microbial growth is the internal egg temperature. Therefore the thermodynamics of temperature equilibration between ambient and internal temperature must also be included in the model.
It has been argued the lag period in a discrete stage model should be modelled cumulatively (Zwietering et al., 1994). Therefore the fraction of lag period remaining for an individual egg should be monitored for each stage and accumulated across successive stages. For example, if 50% of an egg’s lag period is expended during one step of the processing stage (e.g. pre-processing storage), then this should be subtracted from the available abuse time in the next step. Therefore, if the next step results in the use of 75% of an egg’s lag period, there would actually be 25% of the time in that step when active growth of S. Enteritidis could occur.
Eggs produced in commercial flocks in many countries are usually processed. Processing can include candling, grading and sorting, washing, sanitizing and packaging. In general, egg processing does not result in any reduction in the number of bacteria present in contaminated eggs. Instead, processing either increases the number of bacteria in a contaminated egg or leaves the concentration unchanged.
Processing may detect some contaminated eggs, thereby preventing these eggs from reaching the table egg market. Candling and grading of eggs are activities that evaluate quality characteristics of eggs. Candling will identify blood spots and defective shells. Grading eggs involves valuing the qualities of the eggs based on the outcome of candling. Sorting eggs basically groups the eggs dependent on their grades. There is reportedly an association between blood spot defects and the likelihood of these eggs being internally contaminated with S. Enteritidis (Schlosser et al., 1999), so, if blood-spot eggs are less likely to be marketed as table eggs, then sorting of eggs may result in a lower proportion of contaminated eggs in that market.
Data
To model the growth of S. Enteritidis in eggs, mathematical models are used to account for the lag and growth dynamics of this product and pathogen. Ideally, studies are conducted that closely mimic the range of conditions that commercially contaminated eggs experience. Such studies should provide sufficient statistical rigour to estimate the length of time before S. Enteritidis begins to grow at a given temperature, and the rate it grows once multiplication commences. Furthermore, evidence would ideally explain the effect of dynamic ambient temperatures on the time until yolk membrane permeability is sufficient for S. Enteritidis growth, as well as the effect of varying temperature before growth on the subsequent growth rate.
Research on S. Enteritidis growth has focused on the effects of storage time and temperature. This research varies in methodology but, in most cases, eggs are artificially inoculated with S. Enteritidis bacteria. In some cases, the inoculum is very high (Hammack et al., 1993; Schoeni et al., 1995). In other cases, the inoculum is placed into the yolk. The most relevant research involves inoculation of numbers of S. Enteritidis consistent with those observed in naturally contaminated eggs (Humphrey, 1999), and placement of the inoculum outside of the yolk (Humphrey, 1993). Nevertheless, incorporation of these research findings into an exposure assessment should account for uncertainties that result from the experimental (versus field observational) nature of this research.
In the US SE RA, lag period duration and exponential growth rate equations were estimated from data provided by Dr T. Humphrey (Exeter, UK, personal communication), as well as from published reports (e.g. Schoeni et al., 1995). The lag period duration was denoted as yolk membrane breakdown time (YMT) and estimated as;
log10 YMT = 2.0872 - 0.04257T
where the YMT is in days and the temperature T is in degrees Celsius. The exponential growth rate (EGR) applies once yolk membrane breakdown is complete. EGR is estimated as:

where EGR is in logs/hour and T in degrees Celsius.
In the Health Canada exposure assessment, YMT and EGR equations were estimated using essentially the same data as analysed in the USDA model. Nevertheless, the following slightly different equations were estimated.
log10 YMT = 2.07 - 0.04T

where EGR is in generations per hour and T in degrees Celsius. To convert from generations per hour to logs per hour, generations per hour is multiplied by log(2).
In the Whiting and Buchanan (1997) exposure assessment, growth in shell eggs was modelled as part of the distribution for initial numbers of S. Enteritidis in eggs (see Section 4.2.2 - Production). In this model, growth only occurred following breaking, mixing, pasteurization and storage of eggs. Yolk membrane breakdown was not a consideration. The growth model used was from a published study (Gibson, Bratchell and Roberts, 1988). A series of equations based on a Gompertz function are estimated for EGR as follows: the Gompertz equation is
L(t) = A + Ce(-exp[-B(t-M])
where L(t) is the log count of bacteria at time t (in hours), A is the starting log count of bacteria at t = 0 hours, C is the maximum logs of growth achievable, M is time when maximum growth rate is achieved and B is the maximum log growth rate at time M. From the Gompertz function, the EGR is calculable as:
EGR = BC/e
where ln(B) = -23.5 + 1.496s + 0.487t +
4.29p - 0.0608s2 - 0.00563t2 -
0.293p2
and C is a constant, e is the base of
the natural logarithm, s is the salt concentration (%), p is pH,
and t is temperature in Celsius.
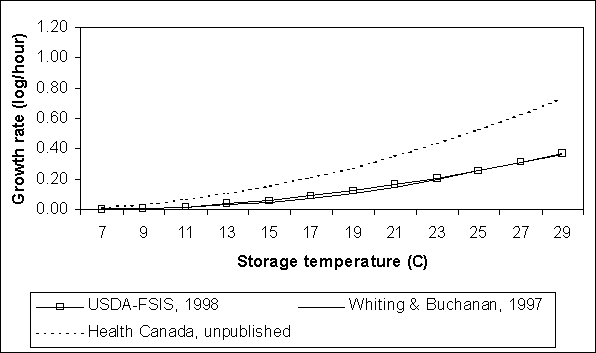
A comparison of the EGR predicted for the three exposure assessment models is shown in Figure 4.16. The USDA equation predicts the slowest growth rates across all temperatures shown. The Whiting and Buchanan (1997) equation predicts slightly slower rates than the Health Canada equation at lower temperatures, but faster rates at higher temperatures. All three equations predict no growth below 7°C.
Comparisons between the Health Canada and US SE RA exposure assessments for EGR are not direct. In the USDA model, growth rate is dependent on the internal egg temperature, not ambient temperature, while the Health Canada model uses the ambient temperature. Generally, internal egg temperature is greater than ambient temperature. Therefore, for a given ambient temperature, the EGR for the USDA model is, on average, a function of a slightly higher internal egg temperature.
In the US SE RA, microbial growth dynamics for S. Enteritidis in eggs are dependent on the internal temperature in the egg. Yet, available data on storage and handling usually reflect the ambient temperature surrounding eggs. Furthermore, the ambient temperature influences internal egg temperature in a variable manner depending on how eggs are stored and packaged. Therefore, equations are needed to predict the change in internal egg temperature across time as the ambient temperature changes.
The internal temperature of eggs shortly after lay is approximately 99ºF (37ºC). The interactions of initial internal egg temperature, ambient temperature and egg packaging conditions are used to predict the future internal egg temperature via a simple non-steady-state heat transfer equation.
Log[(T - T0)/(TI - T0)] = -kt
where T is the internal egg temperature in Fahrenheit at a specific time t (in hours), Ti is the initial internal egg temperature, and T0 is the ambient air temperature.
Figure 4.16. Comparison of Salmonella Enteritidis growth rates in eggs where yolk membrane permeability is complete, as predicted by three exposure assessments. Growth rate is shown as an increasing function of storage temperature.
The parameter k is a cooling constant (cooling rate per hour) that is estimated from available data using different packaging materials, methods and air flow in storage rooms (Table 4.8). The parameter values range from 0.008 for an egg in a box in the centre of a pallet, to 0.1 for eggs in a box, to 0.5 for individual eggs exposed to circulating air.
Table 4.8. Cooling constants estimated from available literature that describe rates of cooling for various storage situations
|
Situation |
k (hours) |
Reference |
|
Pallet, cardboard and fibre flats, in-line |
0.0075 |
Anderson, Jones and Curtis, 1992 |
|
Pallet, cardboard boxes |
0.008 |
Czarik and Savage, 1992 |
|
Pallet, cardboard boxes, styrofoam |
0.013 |
Czarik and Savage, 1992 |
|
Pallet, cardboard, off-line |
0.035 |
Anderson, Jones and Curtis, 1992 |
|
Single cardboard case |
0.052 |
Czarik and Savage, 1992 |
|
Flats, closed |
0.07 |
Bell and Curley, 1966 |
|
Flats, folded shut |
0.08-0.014 |
Bell and Curley, 1966 |
|
Pallet, plastic baskets, styrofoam |
0.11 |
Czarik and Savage, 1992 |
|
Open stack |
0.2-0.4 |
Bell and Curley, 1966 |
|
Fibre case, foam cartons with and without slots, moving air |
0.24 |
Stadelman and Rhorer, 1987 |
|
Open stack, forced air |
0.4-1.0 |
Bell and Curley, 1966 |
|
Cryogenic cooling |
11 |
Curtis, Anderson and Jones, 1995 |
Among the population of shell eggs, k is a variability distribution for each storage period modelled. The values in Table 4.8 were estimated from the cooling characteristics of an egg in the centre of a pallet or box. Because these central eggs would be the warmest eggs in storage, these k values are thought to be conservative. Furthermore, these estimates varied between experimental replicates.
To reflect the natural egg-to-egg variability in the cooling rate, midpoint values were selected based on the expected storage conditions within a stage. The midpoint values were the modal values in a PERT(min, mode, max) distribution. Minimum and maximum values were assumed to be one-third lower or higher than the model. In the US SE RA model, uncertainty about these parameters was not explicitly considered.
In general, storage stages before egg processing reflect situations in which eggs are stored in boxes or flats and the modal k value is about 0.08. The variability in k is modelled as PERT(0.053 0.08 0.107) for storage before processing in the US SE RA model. During processing, eggs are exposed on all surfaces to the ambient air and k values tend to be higher (modal k about 0.5). During transportation, eggs are typically stored on pallets or in styrofoam containers and the modal k value is about 0.1. When eggs reach retail, wholesale and home storage conditions, they are usually in fibre cases or foam cartons, with some air movement around them. In the US SE RA model, it was assumed that k was non-variant for these stages and equalled 0.24.
Time and temperature distributions feed into the microbial growth equations via Monte Carlo simulation to determine a distribution for total logs of growth within contaminated eggs. Operationally, growth modelling considers the temperatures and periods each egg experiences in each of the stages listed in Table 4.7. The YMT is evaluated for a given temperature and compared with the time in each stage. If the YMT is exceeded, then the amount of growth is predicted at the current temperature.
Methods
To model S. Enteritidis growth during the distribution and storage of eggs, the inputs described above are needed. For each of the stages listed in Table 4.7, growth of S. Enteritidis in an egg is based on the period and temperature in the stage. Growth is accumulated across stages, so that the total number of organisms in each egg modelled through all stages represents the cumulative effect of the environmental conditions experienced by that egg between lay and consumption. Therefore, modelling of growth within each stage is a function of:
X = the number of organisms inside the egg at the start of the stage (logs per egg),
Y = the amount of YMT expended for that egg at the start of the stage (%),
T = the ambient temperature in that stage (Celsius), and
t = the time the egg spends in that stage (hours).
In the Health Canada exposure assessment, the following Excel® (Microsoft, Redmond, Washington) spreadsheet functions are executed to model growth in a stage:
|
|
1. |
YMT for the stage is calculated as: 24 (hours/day) * 10(2.07-0.04T) = YMT (in hours) |
|
|
|
|
|
|
2. |
The fraction of YMT used in the stage is calculated
as: |
|
|
|
|
|
|
3. |
The % of YMT used in the stage is added to the amount
remaining at the start of the stage: |
|
|
|
|
|
|
4. |
A statement of logic determines if the YMT has been expended
so that growth may take place: |
|
|
|
|
|
|
5. |
If the logic of 4 (above) is false (=0), then no growth takes place in the stage and the next stage in the model is considered. If the logic of 4(above) is true (=1), then growth is modelled. |
|
|
|
|
|
|
6. |
If growth is modelled, then the growth rate is calculated
as: |
|
|
|
|
|
|
7. |
To determine the time available for growth, a statement of
logic is used: |
|
|
|
|
|
|
8. |
If the logic of 7 (above) is true (=1), then the YMT was
already expended in the preceding stage(s). In this case, the time available for
growth is the time spent in the stage, t. Therefore, growth in the stage
is modelled as: Then logs per egg at the end of the stage equals logs of growth in stage plus X. If the logic of 7 (above) is false (=0), then the time
available for growth is some fraction of the total time spent in the stage. One
method for calculating this is: Then, logs of growth in the stage is calculated
as: |
An alternative method for calculating time for growth is best explained using an example. Assume that t equals 20 hours and YMT for the stage is calculated to be 80 hours. If Y equals 85% (i.e. 85% of the YMT was expended in previous stages) and the %YMT used in the stage equals 25% (i.e. 20 ÷ 80), then the Cumulative %YMT used in the stage equals 110%. Therefore, there was an excess of 10% of YMT used in the stage. This stage accounts for 25% of the cumulative YMT for the egg, and 10% of this time was not needed before growth could occur. So, 40% (10% ÷ 25%) of the time in the stage the YMT exceeded 100% and growth could occur. To determine the time for growth in this case, 40% is multiplied by t (time in stage). If t equals 20 hours, then the time for growth equals 8 hours. This contrasts with the previous method, where the time for growth is a function of YMT (in hours). Using the previous method, however, results in the same estimated time for growth (i.e. (110% - 100%) * 80 = 8 hours).
In the US SE RA, growth is modelled as described above, except that internal temperature is calculated as a function of ambient temperature in the stage and the growth equations are slightly different. Modelling internal egg temperature complicates this model. Given the internal egg temperature at the beginning of a stage (Ti) the ambient temperature in the stage (T0), and the time in the stage (t), the average internal egg temperature (T) is predicted as:
T= exp(-kt/2) * (Ti - T0)+ T0
where k is a cooling constant reflecting the storage practices in the stage. The average internal egg temperature is selected using the midpoint of the cooling curve. This average internal temperature then predicts the YMT for the stage. Subsequent calculations are similar to those described above.
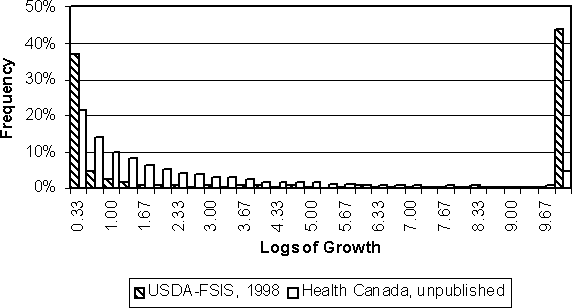
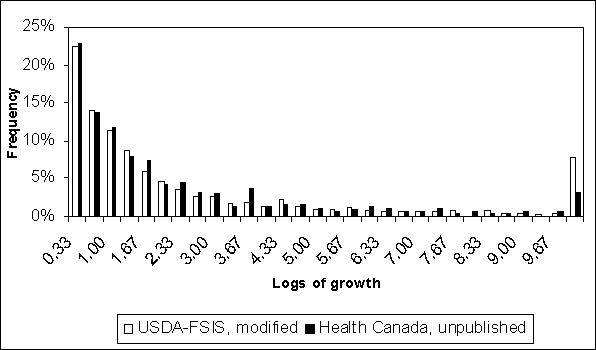
Figure 4.17 shows the predicted logs of growth for the Health Canada and US SE RA exposure assessments. Most contaminated eggs have no growth between lay and consumption. The Health Canada model predicts that 96% of contaminated eggs do not grow S. Enteritidis bacteria. The US SE RA model predicts 90% of contaminated eggs do not grow S. Enteritidis bacteria. The expected values of the distributions in Figure 4.17 are 0.09 and 0.53 logs of growth for the Health Canada and US SE RA models, respectively.
Figure 4.18 illustrates the predicted level of growth for just those contaminated eggs in which growth occurs. In the US SE RA model, most of these eggs experience very low levels of growth, but a substantial fraction also experience the maximum possible growth of 10 logs. The Health Canada model predicts moderate growth (i.e. 1 or 2 logs) more frequently than the US SE RA model. The higher frequency of contaminated eggs with the maximum possible growth in the latter model results in a larger expected value.
The differences in growth between the USDA and Health Canada models are substantial. These differences result from differences in the time and temperature distributions modelled. These differences affect the time until yolk membrane breakdown, as well as the growth following yolk membrane breakdown.
Figure 4.17. Comparison of predicted logs of growth in all Salmonella Enteritidis-contaminated eggs for two exposure assessment models.
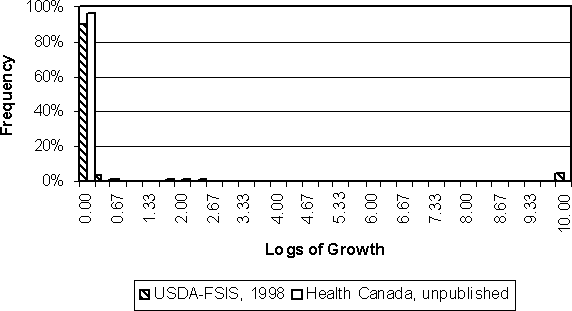
Figure 4.18. Distributions of logs of growth for those contaminated eggs in which growth occurs. In this case, frequency represents the proportion of those contaminated in which growth occurred.
The yolk membrane breakdown concept in eggs represents a complete threshold to multiplication of S. Enteritidis in eggs. For growth to occur, an egg must typically experience elevated temperatures over a sustained period. For example, either model predicts that yolk membrane breakdown requires about 18 days if the eggs are stored at room temperature (20°C). This time increases to about 46 days if the storage temperature is 10°C (50°F). The average time between lay and consumption in either model is less than 25 days. A contaminated egg in which growth occurs represents a situation where extraordinarily high temperatures or times existed. Consequently, it is reasonable for no - or very little - growth to occur if yolk membrane breakdown is not achieved, or for considerable growth to occur if yolk membrane breakdown is complete.
There are 16 growth pathways explicitly modelled in US SE RA. These pathways include branches for home or institutional egg users, pooling or not pooling of eggs, and cooking or not cooking of egg meals. These pathways are explained in Section 4.2.5 - Preparation and Consumption. In general, the amount of growth is primarily a function of whether the eggs are consumed in homes or institutions. In contrast, growth is modelled for all eggs in the Health Canada exposure assessment, without capturing growth for any specific path.
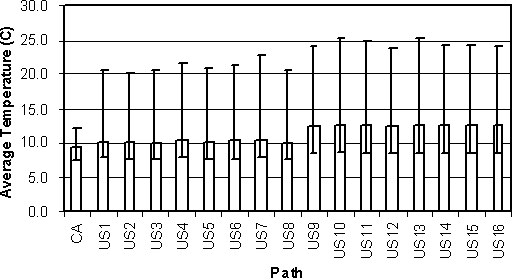
Sixteen average internal egg temperatures are summarized for the US SE RA model and compared with the average of all eggs in the Health Canada model (Figure 4.19). Pathways US1-US8 are those paths where eggs are marketed to home consumers. The average internal egg temperatures for these paths are nearly uniform across these different pathways, and only slightly different from the average ambient temperature of eggs in the Health Canada model. In contrast, pathways US9-US16 are those paths where eggs are sold to food service institutions. Average internal temperatures are also very similar among these pathways, but are higher than the average temperature in the Health Canada model. The variability in average temperature per egg is also consistently large for all of the USDA pathways.
Figure 4.19. Comparison of average temperature between lay and consumption for all eggs in the Health Canada exposure assessment model (CA) and average internal egg temperature for 16 pathways in the US SE RA (US) exposure assessment model. Pathways US1-US8 model eggs consumed at home, and pathways US9-US16 model eggs consumed at food service institutions.
A different pattern in the 16 US SE RA pathways is noted for the time between lay and consumption (Figure 4.20). The home pathways (US1-US8) are associated with longer times than the food service institutional pathways (US9-US16). The food service pathways are shorter in time than, but have nearly the same variability as, the average time for the Health Canada model.
The inverse relationship between time and temperature noted for the 16 pathways in Figures 4.19 and 4.20 is expected. Because cooling of the internal contents of eggs is time dependent in the US SE RA model, longer times, on average, allow the internal temperature of eggs to fall farther than shorter times.
Because consumer storage represents the longest period during which eggs are held (on average), the storage temperature in this stage is responsible for much of the difference in growth between the USDA and Health Canada models. Figure 4.21 shows differences in the frequency of consumer storage temperatures above 7°C between these models. In both models, 7°C was the most likely temperature. Health Canada modelled consumer storage that included both home and institutional user behaviours. The maximum storage temperature in the Health Canada model is 25°C, but most temperatures are less than 11°C. US SE RA modelled storage in the home and at institutions. In that model, the same storage temperature distribution applied to both home and institution users, but home storage was longer than institutional storage. Ten percent of all eggs were modelled as experiencing temperatures above 7°C and the maximum temperature modelled was 32°C. Temperatures between 7°C and 32°C were equally frequent in the US SE RA model.
Figure 4.20. Comparison of average total time between lay and consumption for all eggs in Health Canada exposure assessment model (CA) and for the 16 pathways in the US SE RA. Pathways US1-US8 model eggs consumed at home, and pathways US9-US16 model eggs consumed at food service institutions.
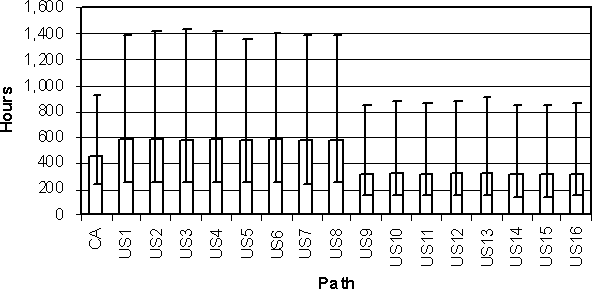
Figure 4.21. Frequency distributions storage used in USDA and Health Canada models for temperature during consumer. Distributions shown here only describe the frequency of eggs experiencing temperatures above 7°C (i.e. refrigeration temperature). The Health Canada distribution is skewed towards lower temperatures, but the FSIS-USDA distribution is uniformly distributed between 8°C and 32°C.
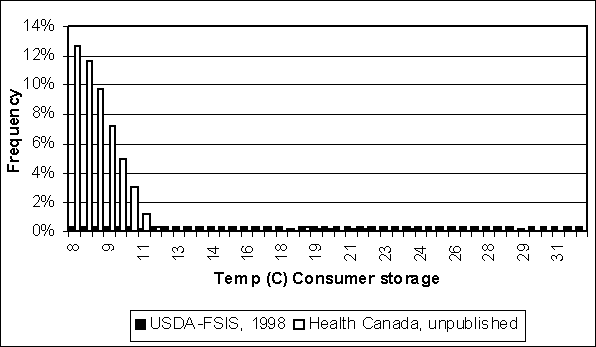
Because consumer storage temperature is important when predicting the total logs of growth, the results of a survey on United States of America refrigeration practices (Audits International, 1999) were examined. This survey found that for several perishable products examined in home refrigerators, 8% were above 7°C, with a maximum observed temperature of 21°C. Neither the USDA nor Health Canada models’ distributions precisely reflect the Audits International findings. The US SE RA assumes 10% of temperatures above 7°C, but allows for temperatures up to 32°C. The Health Canada model assumes 51% of eggs above 7°C and the maximum temperature is 25°C. Nevertheless, the Audits International survey did not specifically address eggs. Eggs are possibly more prone to abuse by retailers and consumers than the products included in the survey. It is therefore difficult to determine which of the two models more correctly reflects consumer storage behaviour. Furthermore, it is likely that consumer behaviour in Canada and the United States of America is different.
To demonstrate the importance of consumer storage temperatures in predicting S. Enteritidis growth in eggs, the two models’ predictions were compared when similar inputs were specified (Figure 4.22). In this case, the USDA model was modified by using Health Canada’s consumer storage temperature distribution as the input for both homes and institutions. The resulting distributions are very similar (Figure 4.22). The modified USDA model predictions are slightly different because that model uses internal egg temperature and the modified input distributions are ambient temperature. On average, the USDA model predicts that internal egg temperature is greater than ambient temperature. Besides consumer storage, the other step where eggs are stored for longer times is retail storage. Retail storage temperature is more truncated in the Health Canada model than the USDA model. Nevertheless, Figure 4.22 shows that the underlying mathematics of modelling S. Enteritidis growth in eggs are similar in the two assessment models. Furthermore, the contrast between Figures 4.18 and 4.22 demonstrate the dramatic effect that differences in input temperature distributions can have on predicted S. Enteritidis growth. Therefore, evidence concerning these distributions is critical to improving model accuracy.
Figure 4.22. Comparison of distributions for logs of growth in contaminated eggs when growth occurs. In this case, the USDA-FSIS model is modified such that the consumer storage temperature distribution is the same as that used in the Health Canada model.
Summary
Time and temperature inputs are important in modelling the distribution and storage of S. Enteritidis-contaminated eggs, but there is a lack of reliable data to describe these distributions. Therefore, time and temperature data specifically addressing eggs is needed.
In neither exposure assessment was variability explicitly separated from uncertainty. For instance, eggs are exposed to a variety of temperatures during each stage listed in Table 4.7. The Health Canada exposure assessment models this as if we knew - with certainty - that most eggs in wholesale storage are stored at 4°C, with some eggs stored at temperatures as low as 2°C or as high as 7°C, but with no eggs exceeding those extremes. A PERT distribution was used here to model a symmetrical frequency distribution with a mode of 4°C. In contrast, the US SE RA assumes that consumer storage at 32°C is just as likely as consumer storage at 8°C. In this case, a uniform distribution was used that extended from 8°C to 32°C. A better approach to the ones used previously is to model a number of different frequency distributions that describe time and temperature of storage and handling. This requires running a series of simulations in which each simulation uses one frequency distribution for all iterations in that simulation. The results of different simulations describe the uncertainty in the model’s predictions. Such an approach has been termed second-order modelling and its intent is to separate variability from uncertainty in modelling results.
The differences in average times and temperatures for the home and institutional pathways of the US SE RA highlight the need to explicitly model complete pathways to consumption. In the Health Canada exposure assessment, all end users are modelled as drawing from the same growth distribution, but the USDA analysis shows that there can be different times and temperatures for eggs between these end users. These differences can result in differences in growth of S. Enteritidis between eggs consumed at homes and in institutions. It is therefore recommended that S. Enteritidis exposure assessments model growth and preparation-consumption pathways jointly, rather than as independent predictions.
Predictive microbiology should be a common component of any exposure assessment of S. Enteritidis in eggs. Because environmental conditions differ on an international level, time and temperature distributions may be different between analyses. However, microbial behaviour within eggs is expected to be consistent regardless of location. The equations estimated in the Health Canada and US SE RA assessments for lag period duration and growth rate were reasonably similar. These equations were estimated from relevant evidence concerning S. Enteritidis in eggs. The Whiting and Buchanan (1997) growth curve was actually estimated from experimental data using Salmonella in broth. Therefore, this equation is not preferred to either of the others. Lacking additional evidence of S. Enteritidis growth dynamics, its is recommended that either the USDA or Heath Canada equations be used in future exposure assessments.
The results and conclusions of these microbial growth models are dependent on conventional assumptions regarding mechanisms of egg contamination. These mechanisms imply that S. Enteritidis contamination in eggs is initially restricted to the albumen and that such contamination enters eggs during their formation inside the hen’s reproductive tissues. Additionally, the growth kinetics estimated for these models are assumed to be representative of all S. Enteritidis strains. Should these assumptions not hold (e.g. S. Enteritidis contamination might occasionally occur within the yolk at the time of lay), then the growth kinetics might differ from those presented.
Processing of eggs into egg products involves the commercial breaking of shell eggs and subsequent processing of their contents for a variety of uses. Egg products are used in the commercial food industry as ingredients in a myriad of products. Institutional users of bulk eggs frequently prepare pasteurized egg products. These products are also sold at retail for home use. In addition, some egg products have non-food uses, such as in the cosmetic and pharmaceutical industries.
In the United States of America, the egg products industry is large and complex. It processes nearly one-third of all eggs. There are numerous product lines and a variety of treatments applied in different processing plants. Generally, there are three intermediate products: liquid whole egg, liquid albumen and liquid yolk. USDA’s Food Safety and Inspection Service (FSIS) regulations exist to ensure that egg products are pasteurized or otherwise treated to reduce the risk of foodborne disease (9 CFR 590).
The inclusion of egg products processing in an exposure assessment of S. Enteritidis in eggs is controversial. Since the emergence of S. Enteritidis as an important food safety pathogen, little evidence has linked pasteurized egg products with human illness caused by S. Enteritidis. Because the products are pasteurized, it is generally assumed that they are safe. Although a large outbreak in the United States of America indirectly implicated raw liquid egg products, this was a case of cross-contamination and not a result of consuming pasteurized egg products (Hennessy et al., 1996). Nevertheless, pasteurization is not necessarily completely effective. Furthermore, implicating egg products as the source of S. Enteritidis in outbreak investigations would be difficult. As egg products are usually mixed with other ingredients, implicating an egg product as the source of an outbreak would typically require ruling out the other potential sources in a mixed food.
Because egg products are not thought to be a risk for S. Enteritidis illness in humans, little research exists outlining how, and to what extent, raw liquid egg is contaminated before pasteurization. The two exposure assessments that have modelled egg products processing (Whiting and Buchanan, 1997; USDA-FSIS, 1998) have concentrated on internally contaminated eggs as the source of S. Enteritidis in bulk volumes of liquid egg prior to pasteurization. Nevertheless, the US SE RA did discuss the implications of alternative sources of the S. Enteritidis in raw liquid egg.
Inputs to an exposure assessment of S. Enteritidis in egg products should include the concentration of S. Enteritidis in raw liquid product and the effectiveness of pasteurization. An output of this model would describe the distribution for number of S. Enteritidis bacteria surviving the pasteurization process. The prevalence of contaminated containers sold for preparation and consumption is another output, as is the prevalence and concentration of contaminated servings generated from these containers.
Contamination sources
Data
The Whiting and Buchanan (1997) and USDA exposure assessments both considered the likelihood of contamination of raw liquid egg products to be a function of the prevalence of infected flocks in the United States of America and the frequency of contaminated eggs produced by infected flocks. Contamination levels in raw liquid egg were predicted based on the number of bacteria within contaminated eggs. Average values for these inputs, discussed in Section 4.2.2, are summarized in Table 4.9. Whiting and Buchanan (1997) actually modelled two scenarios for flock prevalence (10% and 45%), but Table 4.9 summarizes flock prevalence in this case as the midpoint of these two prevalences. This midpoint was chosen to simplify the analysis. It should also be noted that the most likely contamination level in Whiting and Buchanan’s (1997) model was 30 S. Enteritidis bacteria per contaminated egg. Nevertheless, heavy contamination levels are also possible in this model, albeit at low frequencies, and the average number of bacteria per egg is much larger.
Table 4.9. Inputs used to model likelihood of contamination and contamination levels of raw liquid egg products in two exposure assessment models
|
Input |
Whiting and |
USDA-FSIS, 1998 |
|
Prevalence of infected flocks |
27.50% |
37.50% |
|
Egg contamination frequency in infected flocks |
2.00% |
0.02% |
|
Numbers of S. Enteritidis per contaminated egg |
987 |
152 |
Two additional sources of data concerning raw liquid egg were considered in the USDA model. First, a study by Garibaldi, Lineweaver and Ijichi (1969) reported the most probable number of Salmonella bacteria per millilitre measured in samples of raw liquid egg (Table 4.10). While these data pertain to Salmonella in general and not S. Enteritidis specifically, it provides another perspective on contamination levels in liquid egg. The expected value of the distribution reported in Table 4.10 is 0.8 (MPN) Salmonella per millilitre of raw liquid egg prior to pasteurization.
Table 4.10. Reported numbers of Salmonella in raw liquid egg prior to pasteurization
|
Number of samples |
MPN Salmonella |
Frequency |
|
187 |
0 |
65.2% |
|
86 |
0.5 |
30.0% |
|
10 |
2.25 |
3.5% |
|
1 |
5.3 |
0.3% |
|
2 |
24 |
0.7% |
|
1 |
110 |
0.3% |
SOURCE: Garibaldi, Lineweaver and Ijichi, 1969
Another source of data concerning the occurrence of S. Enteritidis in liquid egg is surveys completed by USDA in 1991 and 1995 (Hogue et al., 1997) (Table 4.11). These national surveys cultured 10-ml samples of liquid egg products over a period of one year each. Nevertheless, these surveys did not enumerate the bacteria per sample. About 50% (982 out of 1940) of liquid egg bulk tanks sampled were positive for Salmonella (any serotype) in these surveys. S. Enteritidis isolations were less frequent, but still substantial given the limited sample volume (10 ml).
Table 4.11. Results of national surveys of liquid whole egg prior to pasteurization in the United States of America
|
Year of survey |
Samples collected |
Salmonella sp.-positive |
S. Enteritidis-positive |
|
1991 |
1003 |
53% |
13% |
|
1995 |
937 |
48% |
19% |
SOURCE: Hogue et al., 1997
The Garibaldi, Lineweaver and Ijichi (1969) and Hogue et al. (1997) evidence were considered in the USDA modelling of contamination of raw egg product contamination from sources not limited to internally contaminated eggs. The implications of this analysis were not fully explored, however, because they were beyond the scope of that exposure assessment, which focused on the risk associated with internally contaminated eggs.
Methods
In the Whiting and Buchanan (1997) exposure assessment, the levels of S. Enteritidis per millilitre of liquid egg prior to pasteurization are modelled as the product of flock prevalence, egg contamination frequency in infected flocks, and levels of S. Enteritidis per millilitre of contaminated egg. Monte Carlo simulation calculates this product.
The US SE RA simulates the filling of a hypothetical 10 000-lb (~4 500 litre) bulk tank. This model also uses Monte Carlo simulation methods. Each randomly selected flock contributes its one-day production to a bulk tank and the total number of flocks contributing eggs to a bulk tank is determined iteratively until 10 000 lb are accumulated. For example, if each flock produces 20 000 eggs per day, this roughly equates to 2000 lbs (ca 900 kg) of liquid egg product per flock. Therefore a 10 000-lb bulk tank consists of eggs from five flocks in this example. Flock prevalence determines the probability of a flock being S. Enteritidis infected. Egg contamination frequency determines the number of contaminated eggs produced in a day of production by an infected flock. Similarly, the levels of S. Enteritidis per contaminated egg determines the total load of these bacteria in a 10 000-lb bulk tank when summed across all the flocks contributing to that bulk tank.
The resultant contamination levels predicted by the exposure assessments are shown in Figure 4.23. The Whiting and Buchanan (1997) distribution predicts generally greater levels of contamination per millilitre of liquid whole egg before pasteurization. Much of this difference results from the greater egg contamination frequencies modelled in that analysis. The mean log concentration is -2.1 for the Whiting and Buchanan (1997) distribution and -2.6 for the US SE RA distribution. If Whiting and Buchanan’s high and low flock prevalence scenarios were considered separately, the resulting distribution would be shifted to the right and left, respectively, of the distribution shown in Figure 4.23.
The US SE RA included a separate analysis modelling S. Enteritidis contamination of liquid egg from all sources (i.e. not strictly limited to internal egg contamination), with the data from Garibaldi, Lineweaver and Ijichi (1969) adapted to model the concentration of S. Enteritidis per millilitre in a 10 000-lb (~4500 litre) bulk tank. The modelling approach is illustrated in Figure 4.24. As shown in cell B48, the negative results of Garibaldi and co-workers are assumed to equal a concentration of 1 in 100 000 ml. This concentration was arbitrarily determined. The @Risk cumulative function is used to model the average concentration in a single bulk tank (in cell B57) and the Poisson distribution predicts the number of organisms in the bulk tank (where Conversions!B13 is the number of litres in a bulk tank).
As discussed in the US SE RA report, use of the Garibaldi, Lineweaver and Ijichi (1969) data is problematic. It does not directly address S. Enteritidis contamination levels, nor is it necessarily temporally relevant. Nevertheless, it is the only observational data available on concentration of Salmonella in liquid egg.
Figure 4.23. Comparison of predicted contamination distributions in liquid whole egg prior to pasteurization for two published exposure assessments. Contamination source is exclusively modelled as originating from the internal contents of shell eggs.
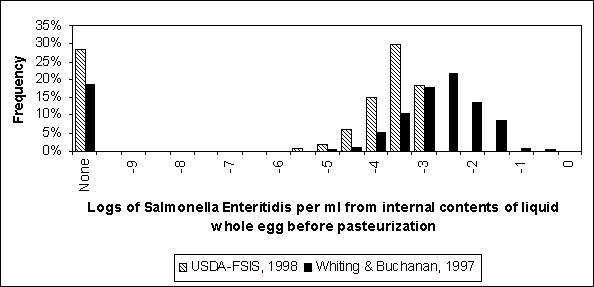
Figure 4.24. Spreadsheet used to model Salmonella Enteritidis contamination of whole liquid egg prior to pasteurization when the source of S. Enteritidis is not limited to just internally contaminated eggs.
| |
A |
B |
C |
D |
|
|
44 |
Input - Salmonella Enteritidis in a bulk tank (all sources) |
||||
|
45 |
|
Number of salmonellae in commercially broken eggs before pasteurization |
|||
|
46 |
|
||||
|
47 |
|
Number of samples |
MPN Salmonella |
Cumulative number of samples |
Cumulative probability |
|
48 |
|
187 |
0.00001 |
187 |
0.652 |
|
49 |
|
86 |
0.5 |
273 |
0.951 |
|
50 |
|
10 |
2.25 |
283 |
0.986 |
|
51 |
|
1 |
5.3 |
284 |
0.990 |
|
52 |
|
2 |
24 |
286 |
0.997 |
|
53 |
|
1 |
110 |
287 |
1.000 |
|
54 |
|
Garibaldi, Lineweaver and Ijichi, Poultry Science, p.1097, 1969 |
|||
|
55 |
|
|
|
|
|
|
56 |
|
|
|
|
|
|
57 |
Expected SE per ml of liquid egg |
=RiskCumul(0.000001,150,C48:C53,E48:E53) |
|||
|
58 |
Expected no. of SE in a bulk tank |
|
|
|
|
|
59 |
|
=RiskPoisson(Conversions!B13*1000*B57) |
|||
An alternative approach to estimating the underlying average concentration of S. Enteritidis bacteria in liquid egg is to use the USDA survey evidence to impute concentration (Table 4.11). These surveys estimate prevalence, but one can infer concentration using a few assumptions. First, assume that the samples of liquid egg generally came from the same population of bulk tanks. In other words, one might assume that all the bulk tanks were basically similar and were filled with eggs from flocks that were roughly similar. Furthermore, assume that there were no substantive differences between 1991 and 1995 surveys regarding the underlying prevalence and concentration of Salmonella and S. Enteritidis in the United States of America egg industry, and assume that if a sample contained S. Enteritidis, it was found positive (i.e. perfect test methods).
With these basic assumptions, one can model the prevalence of Salmonella-positive samples as:
@RISKBETA(982 + 1, 1940 - 982 + 1)
Furthermore, one can model the underlying average concentration as a Poisson process:
@RISKPOISSON(V * l)
where V is the volume of sample collected (10 ml) and l is the average concentration of Salmonella per millilitre in bulk tanks.
If the prevalence from the Beta distribution is known, then one knows the probability of a positive sample. Furthermore, if the average concentration is l, then the probability that a sample contains one or more organisms is 1 - e(-Vl) from the Poisson probability function (i.e. this is also the probability that the sample is positive). Therefore, the following relationship where is derived, all but one of the elements are known:
@RISKBETA(982 + 1, 1940 - 982 + 1) = 1 - e(-Vl)
Solving for l results in the following function:
l= - ln(1 - @RISKBETA(982 + 1, 1940 - 982 + 1))/V
Simulating this equation results in a distribution for l with a mean of 0.07 Salmonella per millilitre in liquid egg bulk tanks. Given the large number of samples upon which this estimate is based, there is little associated uncertainty about the mean.
To compare this estimate with the Garibaldi, Lineweaver and Ijichi (1969) data in Table 4.10, consider V = 1 ml. A Poisson distribution with a mean of 0.07 predicts that 93% of 1-ml samples will contain less than 1 organism, and 99.99% will contain less than 2.25 organisms per millilitre. Garibaldi and co-workers’ results show that 95% of samples contained less than 1 organism per millilitre, and 98.6% contained less than 2.25 organisms per millilitre. While not a perfect match, the imputed distribution from the USDA data is similar except for the very large concentrations detected infrequently by Garibaldi and colleagues.
Stipulating the above analysis, the estimate of S. Enteritidis contamination can be refined. In this case, by use of the S. Enteritidis prevalence data from Table 4.11, and the solution for l is 0.018. The probability of less than one S. Enteritidis organism in a 1-ml sample equals 98% for this mean.
Melding the estimated average S. Enteritidis concentration with the Garibaldi, Lineweaver and Ijichi (1969) data can be done by assuming that 98% of the time the concentration per millilitre of raw liquid egg follows a Poisson distribution, and the remaining 2% of the time it follows a cumulative distribution based on the non-zero data in Table 4.10. Furthermore, the Garibaldi data suggest that the variability in concentration per millilitre may be exponentially distributed. If one assumes that l is the mean concentration among 98% of the bulk tanks, then the exponential distribution can be used to model variability in the mean concentration from one bulk tank to another.
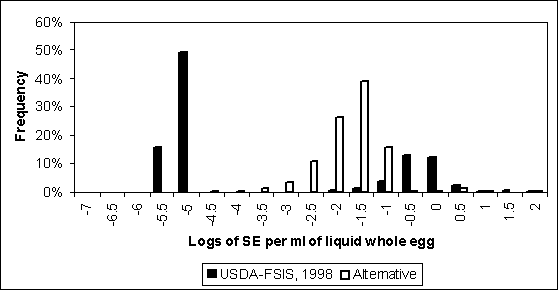
Figure 4.25 illustrates how the direct use of the Garibaldi, Lineweaver and Ijichi (1969) data compares with the method described above. Modelling the Garibaldi data using a cumulative distribution results in bimodal pattern with many observations at or below 1 in 100 000 ml, but another peak at just under one per millilitre. Using the alternative approach based on the data in Table 4.11 results in concentrations centred on 1 per 30 ml. The expected values of the USDA and alternative method distributions are 0.8 and 0.4 S. Enteritidis organisms per millilitre, respectively.
Either of the approaches used to model S. Enteritidis contamination from all sources seems plausible, but the differences in the distributions, although not dramatic, suggest the need for better data than is currently available.
Figure 4.25. Comparison of distributions predicted by the US SE RA model and alternative methods using Beta and Poisson distributions, for contamination levels per millilitre in liquid whole egg. All sources of Salmonella Enteritidis (SE) are considered in these predictions. The US SE RA distribution is based on data from Garibaldi, Lineweaver and Ijichi (1969).
Pasteurization
Data
In the Whiting and Buchanan (1997) exposure assessment, thermal inactivation was based on evidence of 17 S. Enteritidis strains in liquid whole eggs (Shah, Bradshaw and Peeler, 1991). In the USDA model, additional studies by Humphrey et al. (1990) were included with the Shah, Bradshaw and Peeler (1991) data.
The US SE RA separately evaluated the performance of pasteurization on liquid albumen. This evaluation considered two publications (Schuman and Sheldon, 1997; Palumbo et al., 1996) and one set of unpublished data (G. Froning, University of Nebraska) that examined different pH levels of the albumen. These studies showed that the pH of albumen was critical to the effectiveness of pasteurization of this product.
The US SE RA also evaluated pasteurization of egg yolk. There were three studies included in this evaluation (Humphrey et al., 1990; Palumbo et al., 1995; Schuman et al., 1997).
Methods
For comparison of methods used in the two exposure assessments, this discussion is limited to the effectiveness of pasteurization as applied to liquid whole egg. The Whiting and Buchanan (1997) exposure assessment only considered this product. In that model, a regression equation was estimated for log (D), where D is the time in seconds to achieve a one log reduction in S. Enteritidis organisms. The equation estimated was:
Log(D) = 19.104 - 0.2954T
where T is in degrees Celsius. A standard deviation for Log D in this equation was approximated as 0.25.
The USDA model estimated the following regression equation:
Log(D) = 13.027 - 0.2244T
where D is minutes to achieve a 1 log reduction. The standard deviation for Log D was estimated as 0.16.
To model the variability in pasteurization effectiveness for liquid whole egg, values of D were estimated for specific time and temperature combinations. The USDA-FSIS standards require the application of 60°C for 3.5 minutes for liquid whole egg. For this temperature, log(D) equals 1.4 seconds for the Whiting and Buchanan (1997) exposure assessment and -0.44 minutes for the US SE RA. In log space, the log of the log reduction for 3.5 minutes is calculated as log(3.5) - log(D). To determine the mean log reduction, the antilog is calculated as 10(log(3.5)-log(D)). Nevertheless, there is variability in this value and this variability is modelled using the lognormal distribution (i.e. 10(@RISKLOGNORM((log(3.5)-log(D)), s.d), where s.d. is the standard deviation estimated for each of the regression equations.
Figure 4.26 shows the predicted distributions for thermal inactivation of S. Enteritidis in whole liquid egg. The USDA distribution implies slightly greater reductions than the Whiting and Buchanan (1997) distribution, but both distributions imply substantial variability. The apparent improved effectiveness of the USDA curve reflects the incorporation of additional evidence not considered in the Whiting and Buchanan (1997) assessment. This additional evidence also slightly reduced the standard deviation of the estimated regression.
To model the concentration of S. Enteritidis remaining in a volume of liquid whole egg after pasteurization, both exposure assessments used Monte Carlo techniques. Given an initial log concentration in raw liquid whole egg (A), and the log reduction caused by pasteurization (B), the logs remaining equals A - B.
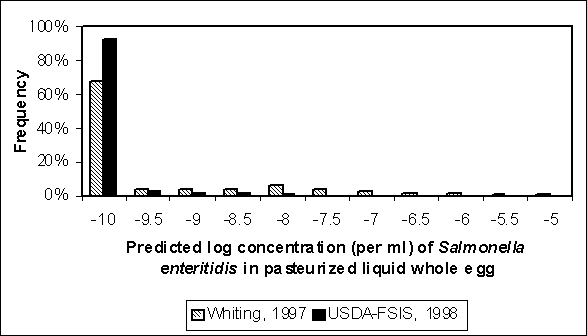
The distribution for level of contamination after pasteurization was simulated for both exposure assessments (Figure 4.27). The distributions in Figure 4.27 were estimated using initial contamination distributions representing S. Enteritidis that originated from internally contaminated eggs (i.e. Figure 4.23). Given that a typical 10 000-lb lot of liquid whole egg consists of about 4.4 million millilitres, or 6.6 logs, this graph suggest that S. Enteritidis bacteria surviving pasteurization is infrequent. For example, <0.1% of bulk tanks have concentrations greater than 1 in 10 million millilitres in the US SE RA. About 2% of bulk tanks have concentrations greater than 1 in 1 million millilitres in the Whiting and Buchanan (1997) assessment despite the greater incoming concentrations and less effective pasteurization estimated in that model.
Figure 4.26. Comparison of predicted effectiveness of a specific pasteurization protocol applied to liquid whole egg for two exposure assessments.
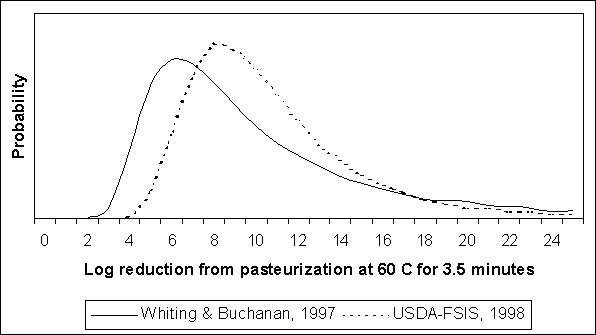
Figure 4.27. Comparison of residual concentration of Salmonella Enteritidis per millilitre of liquid whole egg following pasteurization for two completed exposure assessments. Contamination of liquid whole egg prior to pasteurization was modelled as only originating from internally contaminated eggs. Because of the extremely small likelihood of contamination remaining at low concentrations, the distributions were truncated at -10 logs.
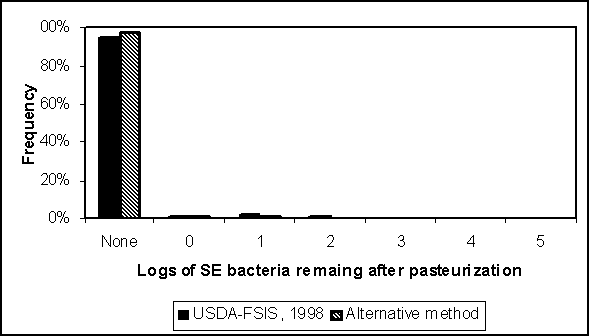
If one were to assume that all liquid whole egg product was collected and pasteurized in 10 000-lb units, then it is possible to estimate the frequency of bulk tanks in which one or more S. Enteritidis survive. Furthermore, this analysis can be conducted assuming the incoming concentration is based on all sources of S. Enteritidis (Figure 4.25). In this case, the number of S. Enteritidis in a bulk tank prior to pasteurization, X, is modelled as a Poisson(Vl) distributed variable where V is 4.4 million millilitres and l is the concentration of S. Enteritidis per millilitre based on the distributions in Figure 4.25.
Given X, the number of S. Enteritidis in a bulk tank, and P, the log reduction resulting from pasteurization, one can model the number of bacteria remaining after pasteurization as:
@RISKPOISSON(10(log(X)- P)).
This algorithm is applied using the two distributions in Figure 4.25, as well as the USDA pasteurization effectiveness distribution (Figure 4.28). Regardless of the initial contamination concentration assumed from Figure 4.25, more than 95% of the bulk tanks have no bacteria remaining after pasteurization. Of those with some residual S. Enteritidis after pasteurization, the most likely number is less than 10 organisms per 4.4 million millilitres of liquid whole egg. If we assume that a typical serving size is 100 ml of liquid whole egg, and the concentration in a particular bulk tank is 10 organisms per 4.4 million millilitres, then the likelihood of a serving containing one S. Enteritidis bacteria is 0.02%. The probability of a serving containing more than one organism is exceedingly small. Given that at least some liquid whole egg products will be further heat treated (i.e. cooked) before consumption, the risk is even less than suggested by this analysis.
Figure 4.28. Predicted numbers of Salmonella Enteritidis (SE) organisms remaining after pasteurization of 10 000-lb (~4500 litre) bulk tanks. Incoming concentrations are modelled using the distributions in Figure 4.25 for the US SE RA model and an alternative estimate. In both cases, it is presumed that S. Enteritidis originates from all sources, including but not limited to internally contaminated eggs.
Summary
The methodologies used by Whiting and Buchanan and US SE RA are similar. The differences in results between these models are mostly caused by differences in modelled concentrations before pasteurization. These differences originate in the respective production models as described Section 4.2.2 - Production. The methods described here are reasonable given the limited epidemiological information linking S. Enteritidis in egg products to adverse human health events. Furthermore, data concerning concentrations of S. Enteritidis prior to pasteurization are lacking. Therefore, much uncertainty attends the modelling of initial contamination. To predict the effectiveness of regulatory standards concerning egg products, there is a need for additional data concerning the concentration of S. Enteritidis in raw liquid egg before pasteurization. For validation purposes, it would also be useful to collect data on the concentration of S. Enteritidis post-pasteurization.
A dramatic result of these analyses is the implied variability in pasteurization effectiveness. This finding is supported by subsequent analysis (van Gerwen, 2000). The standard errors of the estimated regression equations are assumed to represent variability in log(D) at all temperatures. The assumption seems warranted given the stipulations of linear regression analysis. Nevertheless, the standard error term arguable represents variability only. The unknown effect of measurement error might contribute to the calculated standard error of a regression analysis. However, quantifying the effect of measurement error requires more information than is usually available from published studies.
Lacking evidence of the degree of measurement error, it seems reasonable to assume that the standard error term of a linear regression analysis represents variability in the system. To incorporate uncertainty into an exposure assessment, the linear regression itself can be re-estimated using bootstrapping or jackknifing techniques to explore the effect of different or fewer observations. Such techniques then allow the explicit separation of variability and uncertainty in this analysis.
Implicit in these models is the assumption that pasteurized egg products are contaminated because pasteurization fails to eliminate all the S. Enteritidis organisms. No consideration is given to possible re-contamination of egg products following pasteurization. If egg products are not hygienically handled after pasteurization, this limitation may be important.
This discussion of egg products processing has also assumed that commercially broken eggs will be pasteurized, but there may be situations where liquid egg is not pasteurized. In such cases, the estimation procedures discussed for raw liquid egg would serve as the starting point for an analysis of the risk that these products pose to consumers. While the risk seems high in the examples described here, other situations may predict different results.