In this section, the results from the exposure assessment are used within the hazard characterization to estimate two quantities: the risk per serving and the risk from cross-contamination as a result of preparing that serving. As before, for the exposure assessment, the risk characterization is not specific to any country and thus comparison with surveillance data is not appropriate. Following calculation of the baseline model, the effect of a number of mitigation strategies is investigated.
The risk estimate for probability of illness was first simulated using a set prevalence for the presence of Salmonella in chilled, raw broiler chickens. At a prevalence of 20% contaminated carcasses, and based on the other model parameters, including the probability that the product will be undercooked, approximately 2% of the broilers prepared for consumption in the home could potentially contain viable cells of Salmonella. Figure 7.1 shows the distribution of average doses (colony-forming units, CFUs) per serving for contaminated chicken that is subsequently undercooked.
Figure 7.1. Average dose (CFU Salmonella) per serving in meals prepared from contaminated broilers.
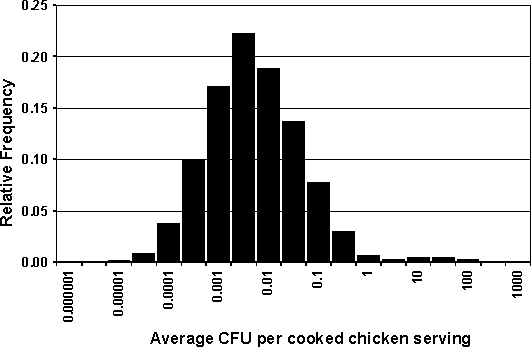
Note that in Figure 7.1 the interpretation of values of less than 1 CFU per serving is 1 CFU per multiple servings, e.g. an average dose of 0.01 cells per serving translates to one in 100 servings contains a single cell.
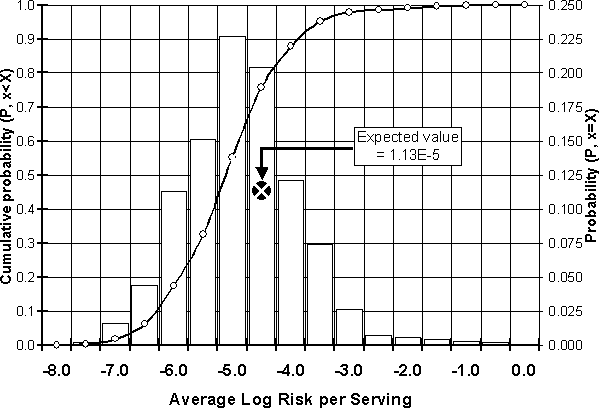
Assuming a 20% prevalence of contaminated broilers, the estimated frequency and cumulative distribution of average risk per serving are shown in Figure 7.2. The expected risk per serving is 1.13E-5, or 1.13 illnesses per 100 000 servings. This value represents the average risk for all individuals in the population that consume servings of chicken that are stored, transported and prepared in the manner described in the model, and also accounts for the probabilities that the serving was from a chicken contaminated with Salmonella, and that the meal was undercooked. It should be recognized that some individuals consuming a serving on certain occasions would experience a much higher risk than others who may be consuming servings with no salmonellosis risk at all, since the serving is free of the pathogen.
Figure 7.2. Distribution of average risk per serving.
The expected risk per serving can be extended to the expected risk over multiple servings, such as meals consumed in a year. If it is assumed that the risk posed by one exposure (serving) is statistically independent from any other exposure (serving), then the overall risk following a series of exposures can be estimated using Equation 7.1:
|
|
Equation 7.1 |
where PA is the risk of infection following a series of exposures (annual risk) and PDi is the risk of infection per exposure (daily or serving risk). In order to estimate the annual risk of infection, two pieces of information are required: the risk of infection per serving, and the number of servings consumed in a year. The calculation of annual risk based on the estimated average per serving risk and the assumptions for this baseline scenario are illustrated in Table 7.1.
Table 7.1. Calculation of expected annual risk.
|
Prevalence of contaminated carcasses |
20% |
|
|
Expected risk per serving |
1.13E-05 |
|
|
Number of servings in year |
26 |
|
|
Annual expected risk |
2.94E-04 |
|
|
Rate of illness per 100 000 |
29.38 |
|
|
Illustrative calculation for annual expected number of illnesses for a country or region with this annual expected risk: |
||
| |
Population |
20 000 000 |
|
Proportion of population that eats chicken |
0.75 |
|
|
Potentially exposed population |
15 000 000 |
|
|
Expected number of cases in the year |
4406 |
|
The assumption inherent in the calculation above for the expected annual risk is that each of the servings consumed during the year has the same expected risk per serving and that the risk from each exposure is independent of every other exposure. The number of servings used to estimate the annual risk is assumed to be 26 meals, or once every 2 weeks. For illustration, a population risk for 20 million individuals was assumed to be under consideration, with 75% of that population eating chicken. In this example, the total expected number of salmonellosis cases arising from the model assumptions is estimated to be 4400, equivalent to a rate of 29 cases per 100 000 population. Obviously, these statistics need to be tailored for a specific country or region.
In addition to estimating the risk per serving based on consumption of undercooked poultry, the assessment also modelled the risk from cross-contamination. The sequence and nature of events that need to occur in order for the bacteria on raw chicken to be disseminated and ingested via other pathways is complex and difficult to model completely. There is a lack of information to adequately describe cross-contamination, but it is acknowledged that this is an important route for food-borne illness. The following estimates offer an approximation for the magnitude of the problem, although not all potential pathways were modelled that could result in exposure and illness.
In the baseline scenario, the expected risk from cross-contamination (transfer from raw chicken to hands to non-cooked foods, or from raw chicken to cutting board to non-cooked foods) was estimated to be 6.8E-4, or 6.8 illnesses per 10 000 exposures to contaminated material. This is more than an order of magnitude higher than the expected risk from a serving. This estimate is a function of two factors (conditional probabilities) in the current model: first, the expected risk when the event occurs, and, second, the expected probability that the event occurs.
The expected probability that the event occurs is driven by the prevalence of contamination and the probability of undercooking in the case of consumption, versus the prevalence of contamination and the probability of not washing hands or not washing cutting boards in the case of cross-contamination. Given the assumptions made in the model, the expected risk from this cross-contamination pathway is equivalent to approximately 60 chicken consumption exposures. Although the frequency with which people do or do not wash their hands can be debated, the ultimate risk from cross-contamination could in fact be even higher than that estimated here since there are multiple cross-contamination opportunities that exist in the home preparation environment.
Validation of results derived from microbiological risk assessments (MRAs) is often difficult, primarily due to the large uncertainties that are commonly associated with predictions. Surveillance data can be used for this purpose, but such use should account for sensitivity of detection and reporting methods. Downstream validation can also be used. In this case, intermediate results can be compared with data not used for model development. For example, predictions for the prevalence of contaminated products at the point of retail can be validated using data from retail surveys. The recognized problems associated with validation strengthen the fact that other outputs from risk assessment, for example the identification of data gaps and the ranking of control strategies, are often more useful than the predicted values.
The model developed here does not estimate the risk for a specific country and therefore it was not possible to attempt to validate the predicted results.
In generating the model, some of the input parameters were modelled as variable while others inputs were considered uncertain, so uncertainty and variability were not explicitly separated. Variability is a property of the phenomenon and the variations that are described are a reflection of what could be expected in nature. Uncertainty is driven by the lack of knowledge about the nature and behaviour of a phenomenon. Inputs that are derived from large representative data sets generated by scientifically sound methods are less uncertain than inputs that are based on sparse data, small sample sizes, or poor scientific methods, or a combination. Good data sets can be regarded as representing the actual variability of phenomenon. In contrast, uncertainty arises when assumptions must be made to generate a distribution around a single data point that is reported in the scientific literature (e.g. when only a mean value is available), or when little or no data exist. Although it is recommended that uncertainty and variability should be explicitly separated within the MRA, this would lead to a complex model. For this reason, the effect of uncertainty was investigated by considering the uncertain parameters in a separate analysis.
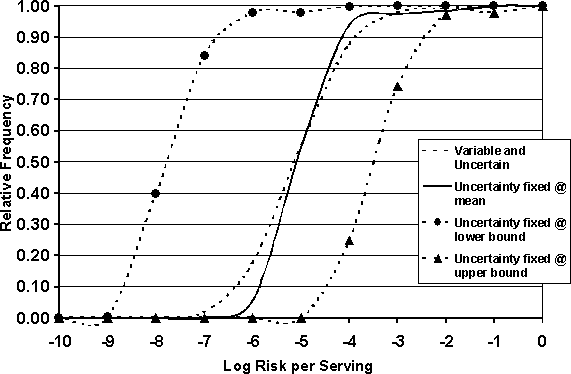
Several of the parameters in the cooking module were considered uncertain and are listed in Table 7.2. The impact of uncertainty in these parameters was investigated in order to evaluate their influence on the risk estimate. To do this, the model was re-simulated using a fixed single value for each of the uncertain parameters while allowing the other parameters of the model to vary within their defined distributions. Three simulations were performed: in the first, the parameters listed in Table 7.2 were set at their mean value. The fixed values used for the second simulation were those that would generate a "worst case" scenario, i.e. the maximum value for probability that the chicken was undercooked, the maximum value for proportion of cells in a protected region, the minimum heat exposure time, and the minimum value for the temperature reached in a protected region (0.15, 0.2, 0.5 minutes and 60°C, respectively). It is recognized that such a scenario may not occur in reality, but it gives an upper bound to the range of possible values. The third simulation used the values that would give a "best case" scenario, i.e. minimum value for probability undercooked, etc. This approach allowed the extremes in the risk distribution, driven by the uncertain parameters, to be highlighted. The results of performing the analysis on the uncertain parameters influencing consumption risk are shown in Figures 7.3 and 7.4.
Table 7.2. Uncertain parameters in the cooking module.
|
Consumption relationship |
Mean |
Min. |
Max. |
|
Probability not adequately cooked |
0.1000 |
0.0500 |
0.1500 |
|
Proportion in protected area |
0.1567 |
0.1000 |
0.2000 |
|
Exposure time to cooking temperature of cells in protected areas |
1.00 |
1.50 |
0.50 |
|
Cooking temperature reached in protected areas. |
63.50 |
65.00 |
60.00 |
Figure 7.3. Effects of uncertain parameters on per serving risk distribution.
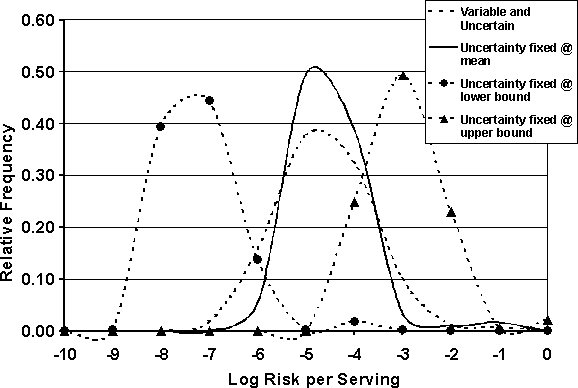
When the uncertain parameters were fixed at their mean values (Uncertainty fixed @ mean) and compared with the risk distribution generated by the model when all parameters were allowed to vary (Variable and Uncertain), it appears that within the range of uncertainty that was assumed to define the parameters, the impact of variation is not very large. The resulting risk distributions are similar and the tails of the currently defined uncertainty distributions do not have a dramatic impact on the overall risk uncertainty distribution. In other words, the range and shape of the distributions defining uncertainty do not influence the risk uncertainty significantly. Alternatively, if the assumptions made were incorrect and the uncertain parameters actually spanned a different range, e.g. if the true values are centred nearer to the min. or max. values rather than at the value assumed to be the mean, the distribution of risk would approach the extreme distributions shown. In these situations, the expected risk would be dramatically different. It should be noted that the extreme risk distributions shown in Figures 7.3 and 7.4 are truly bounds on the uncertainty range since the worst case or best case scenario has been compounded through the model. For example, the worst case scenario was defined by assuming that all of the uncertain parameters would simultaneously take on the values that give the worst outcome.
A complete quantitative uncertainty analysis of the model and all input parameters was beyond the scope of this work. This type of analysis is time consuming and not necessarily more informative for the purposes of this document. Many of the inputs are generic approximations in order to provide a representative risk scenario. Nevertheless, it is important to recognize these two characteristics - uncertainty and variability - in the probability distributions used in quantitative risk assessments. It is also readily recognizable that several input parameters in this model are both variable and uncertain, and, if the individual parameters are important in determining the magnitude of the risk estimate, it may be necessary to separate the uncertainty and variability in the quantitative analysis in order to understand their impacts and arrive at proper risk estimations (Nauta, 2000).
Figure 7.4. Effects of uncertain parameters on per serving cumulative risk distribution.
A change in the prevalence of contaminated raw product affects the risk to the consumer by altering the frequency of exposure to risk events, i.e. exposure to the pathogen. The change in risk as a result of a change in the prevalence of Salmonella-contaminated broilers was estimated by simulating the model using a range of initial prevalence levels. Seven different prevalence levels were investigated: 0.05%, 1%, 5%, 10%, 20%, 50% and 90%. If the prevalence of contaminated chickens leaving processing is altered, through some management practice either at the farm level or at the processing level, the expected risk per serving is altered. The magnitude of the changes in risk per serving and risk per cross-contamination event as a result of changes in prevalence are summarized in Table 7.3.
Table 7.3. Change in prevalence impact on risk.
| |
Prevalence |
||||||
|
0.05% |
1.0% |
5.0% |
10.0% |
20.0% |
50.0% |
90.0% |
|
|
Consumption |
|||||||
|
Expected risk per serving |
2.81E-08 |
5.63E-07 |
2.81E-06 |
5.63E-06 |
1.13E-05 |
2.81E-05 |
5.07E-05 |
|
Number of servings |
26 |
26 |
26 |
26 |
26 |
26 |
26 |
|
Annual expected risk |
7.32E-07 |
1.46E-05 |
7.32E-05 |
1.46E-04 |
2.93E-04 |
7.31E-04 |
1.32E-03 |
|
Rate of illness per 100 000 |
0.07 |
1.46 |
7.32 |
14.63 |
29.26 |
73.14 |
131.61 |
|
Calculation of expected number of cases in the year based on assumed population size and exposed population |
|||||||
|
Population |
20 000 000 |
||||||
|
Proportion of population that eats chicken |
0.75 |
||||||
|
Potentially exposed population |
15 000 000 |
||||||
|
Expected number of cases in the year |
11 |
219 |
1 097 |
2 195 |
4 389 |
10 970 |
19 741 |
|
Cross-contamination |
|||||||
|
Expected risk per event |
1.70E-06 |
3.41E-05 |
1.70E-04 |
3.41E-04 |
6.81E-04 |
1.70E-03 |
3.07E-03 |
A reduction of 50% in the number of cases of salmonellosis was estimated if a 20% contamination rate at the retail level was reduced to 10% contamination. The relationship between prevalence and expected risk is largely a linear one, specifically a percentage change in prevalence, assuming everything else remains constant, can be expected to reduce the expected risk by the same percentage.
The effectiveness of specific mitigations, either on-farm or treatments during processing, were not evaluated in the present risk model because of lack of representative data to analyse changes in either or both prevalence and level of contamination that might be attributable to a specific intervention. See Section 7.3.4 for a summary of poultry processing treatments. However, the influence of reducing prevalence can be interpreted, although with a high degree of uncertainty given our current state of knowledge, in the context of chlorine addition to the chill tanks during processing. There is little evidence that the addition of chlorine at levels of 50 ppm or less actually decreases the numbers of the pathogen attached to the skin of poultry carcasses. However, available data suggest that chlorine prevents an increase in the prevalence of contaminated carcasses, i.e. a reduction in cross-contamination (Table 7.4), although one study observed a substantial reduction in prevalence. The factor listed in the last column of the table is a ratio of the prevalence after chilling to the prevalence before chilling. A ratio greater than 1 indicates an increase in prevalence of contaminated carcasses.
Table 7.4. Experimental data for effects of chlorine on Salmonella prevalence after immersion chill tank.
|
Ref. |
Amount |
Prevalence before chilling |
Prevalence after chilling |
Ratio(1) |
||||||||
|
Total |
Positive |
Prevalence |
Total |
Positive |
Prevalence |
|
||||||
|
With Chlorine |
||||||||||||
|
[1] |
20-50 ppm (tank) |
48 |
48 |
100% |
103 |
60 |
58% |
0.58 |
||||
|
[2] |
4-9 ppm (overflow) |
50 |
21 |
42% |
50 |
23 |
46% |
1.10 |
||||
|
[3] |
1-5 ppm (overflow)? |
90 |
18 |
20% |
90 |
17 |
19% |
0.94 |
||||
|
[4] |
15-50 ppm (tank) |
48 |
4 |
8% |
96 |
7 |
7% |
0.88 |
||||
| |
0.87 |
|||||||||||
|
Without Chlorine |
||||||||||||
|
[5] |
- |
160 |
77 |
48% |
158 |
114 |
72% |
1.50 |
||||
|
[6] |
- |
99 |
28 |
28% |
49 |
24 |
49% |
1.73 |
||||
|
[7] |
- |
40 |
5 |
13% |
40 |
11 |
28% |
2.20 |
||||
|
[7] |
- |
40 |
4 |
10% |
40 |
15 |
38% |
3.75 |
||||
|
[7] |
- |
84 |
12 |
14% |
84 |
31 |
37% |
2.58 |
||||
|
[8] |
- |
60 |
2 |
3% |
120 |
18 |
15% |
4.50 |
||||
| |
2.71 |
|||||||||||
NOTES: (1) Ratio of prevalence after chilling to prevalence before chilling. A ratio >1 indicates an increase in prevalence of contaminated carcasses.
DATA SOURCES: [1] Izat et al., 1989. [2] James et al., 1992a. [3] Cason et al., 1997. [4] Campbell 1983. [5] James et al., 1992a. [6] James et al., 1992a. [7] Lillard, 1980. [8] Campbell, 1983.
The effect was assessed of reducing the numbers of Salmonella on poultry carcasses without changing the prevalence of contaminated carcasses. The values of the cumulative concentration distribution used in the baseline scenario were reduced by 50% (approximately 0.3 logCFU per carcass; Figure 7.5). The model was run using the reduced level of conta-mination while maintaining the prevalence at 20% and with no changes in any of the other parameters. Figure 7.6 shows a comparison of the per serving risk estimates for the modified simulation against the original data.
Figure 7.5. Original and post-intervention concentration distributions.
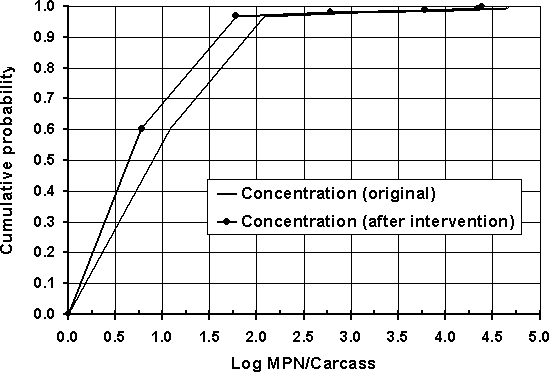
Figure 7.6. Risk per serving distribution before and after concentration-changing intervention.
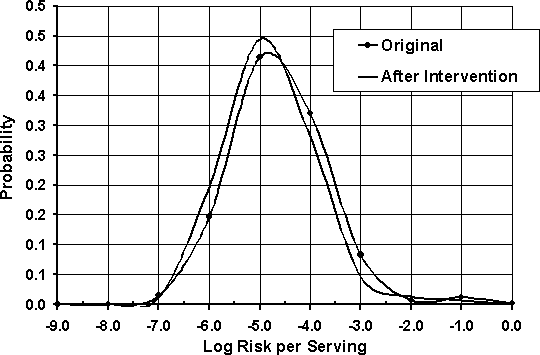
Unlike a change in prevalence, a change in concentration of the pathogen does not necessarily have a linear relationship with the risk outcome. The distribution of risk shown in Figure 7.6, similar to the distribution of risk per serving shown earlier, is the risk per serving when contaminated. The servings were estimated to be contaminated and potentially undercooked approximately 2% of the time. That statistic remains unchanged if the level of contamination is reduced.
The expected risk per serving, which incorporates the prevalence of contaminated servings and the probability of undercooking, was estimated to be 1.13E-5 (1.13 illnesses per 100 000 servings) in the original case, and 4.28E-6 (4.28 per 1 000 000 servings) in the situation when the level of contamination is reduced. The expected risk per serving is therefore reduced by approximately 62%. A summary of the results is shown in Table 7.5.
Table 7.5. Risk summary before and after intervention to change concentration.
|
|
Original |
After Intervention |
|
Prevalence |
20% |
20% |
|
Expected risk per serving |
1.13E-05 |
4.28E-06 |
|
Number of servings in year |
26 |
26 |
|
Annual expected risk |
2.94E-04 |
1.11E-04 |
|
Rate of illness per 100 000 |
29 |
11 |
|
Illustrative calculation for annual expected number of illnesses for a country/region with this annual expected risk |
||
|
Population |
20 000 000 |
20 000 000 |
|
Proportion of population that eats chicken |
0.75 |
0.75 |
|
Potentially exposed population |
15 000 000 |
15 000 |
|
Expected number of cases in the year |
4406 |
000 1670 |
The risk from cross-contamination events is also affected when the level of contamination is reduced.
Finally, a change in consumer practices can have an impact on risk. The consumer represents the final intervention in mitigating the risk. However, the effectiveness of strategies aimed at changing consumer behaviour is difficult to anticipate, and difficult to measure. For purposes of this assessment, the potential impact on risk by modifying food preparation practices was investigated by running the simulation assuming that a strategy is implemented which changes consumer behaviour. The assumed changes were as follows:
- probability that product is not adequately cooked:
|
|
(OLD): |
Min = 5%, |
Most likely = 10%, |
Max = 15% |
|
|
(NEW): |
Min = 0%, |
Most likely = 5%, |
Max = 10% |
- exposure time (minutes):
|
|
(OLD): |
Min = 0.5, |
Most likely = 1.0, |
Max = 1.5 |
|
|
(NEW): |
Min = 1.0, |
Most likely = 1.5, |
Max = 2.0 |
The changes are thus assumed to reduce the probability of the consumer not adequately cooking their food, and, for those that do tend to undercook, the degree of undercooking is less.
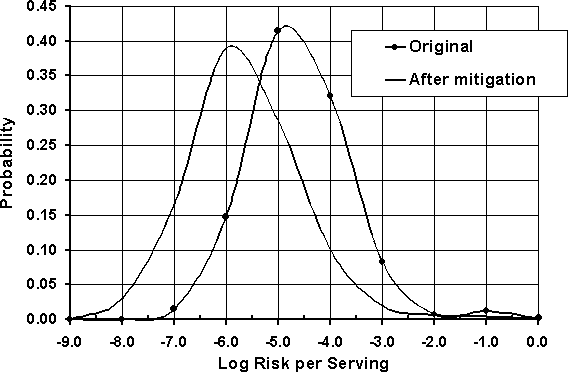
If the simulation model is re-run with these assumptions, the expected risk is reduced to 2.22E-6 (2.22 illnesses per 1 000 000 servings) from 1.13E-5 (1.13 illnesses per 100 000 servings). As a result, the changes in consumer practices reduce the expected risk per serving by almost 80%. The changes in consumer practices have an impact on the frequency with which a potentially contaminated product remains contaminated prior to consumption (probability of undercooking) and reduces the risk when the potentially contaminated product reaches the consumer as well (longer cooking time). The distribution of risk per serving before and after the intervention is shown in Figure 7.7.
It is important to note that the mitigation strategy to alter cooking practices does not address the cross-contamination risk. In the baseline scenario, the expected risk per cross-contamination event was shown to be much larger than the risk from consumption. As a result, the strategy to change the consumers cooking practices needs to be tempered by the fact that cross-contamination may in fact be the predominant source of risk and the nature of cross-contamination in the home is still a highly uncertain phenomenon.
Figure 7.7. Risk distribution per serving before and after consumer behaviour altering intervention.
|
SUBSTRATE |
CONTROL LEVEL |
REDUCTION REPORTED |
CONDITIONS |
REFERENCE |
|
|
CHEMICAL TREATMENT - Acetic acid |
|||||
|
Broiler carcasses |
0.6% |
Significant reduction: 96% of controls positive while treated carcasses were only 8% positive |
Used with air injection in a 10-minute pre-chill at 10°C |
Dickens and Whittemore, 1994 |
|
|
Chicken carcasses |
0.6% |
Reduction of 0.34 log10, darkened the carcasses and caused the feather follicles to protrude |
1 hour static ice slush in chill tank |
Dickens and Whittemore, 1995 |
|
|
Chicken carcasses |
0.6% |
Reduction of 0.62 log10, darkened the carcasses and caused the feather follicles to protrude |
1 hour static ice slush with air injection |
Dickens and Whittemore, 1995 |
|
|
Chicken carcasses |
0.6% |
Reduction of 1.16 log10, darkened the carcasses and caused the feather follicles to protrude |
1 hour with paddle chiller |
Dickens and Whittemore, 1995 |
|
|
Chicken breast skin |
5% |
2.5 log10 reduction on loosely attached S.Typhimurium populations |
Chiller for 60 minutes, 0°C |
Tamblyn and Conner, 1997 |
|
|
Chicken breast skin |
5% |
2.0 log10 reduction on firmly attached S. Typhimurium populations |
Scalder for 2 minutes, 50°C |
Tamblyn and Conner, 1997 |
|
|
CHEMICAL TREATMENT - Calcium hypochlorite |
|||||
|
Chicken carcasses |
20 ppm available chlorine |
No reduction |
15 minutes, 25°C |
Nassar et al., 1997 |
|
|
Chicken carcasses |
50 ppm available chlorine |
No reduction |
15 minutes, 25°C |
Nassar et al., 1997 |
|
|
Chicken carcasses |
100 ppm available chlorine |
3/10 inoculated (104CFU) carcasses negative after treatment, but yellow appearance and strong chlorine smell |
15 minutes, 25°C |
Nassar et al., 1997 |
|
|
Chicken carcasses |
200 ppm available chlorine |
7/10 inoculated (104CFU) carcasses negative after treatment, but yellow appearance and strong chlorine smell |
15 minutes, 25°C |
Nassar et al., 1997 |
|
|
CHEMICAL TREATMENT - Sodium hypochlorite |
|||||
|
Chicken carcasses |
200 ppm available chlorine |
99.9% reduction in Salmonella count; did not affect odour or flavour of the cooked meat |
15 minutes, 25°C |
Morrison and Fleet, 1985 |
|
|
Chicken breast skin |
400 ppm |
2.3 log10 reduction on loosely attached S. Typhimurium populations and 1.3 log10 reduction on firmly attached S. Typhimurium populations |
Chiller for 60 minutes, 0°C |
Tamblyn, Conner and Bilgili, 1997 |
|
|
Chicken breast skin |
800 ppm |
2.5 log10 reduction on loosely attached S. Typhimurium populations and 1.9 log10 reduction on firmly attached S. Typhimurium populations |
Chiller for 60 minutes, 0°C |
Tamblyn, Conner and Bilgili, 1997 |
|
|
CHEMICAL TREATMENT - Lactic acid |
|||||
|
Chicken carcasses |
0.75% |
4/10 inoculated (104CFU) carcasses negative after treatment, discoloration, slimy skin and tears in skin |
pH 2.78, 15 minutes, 25°C |
Nassar et al., 1997 |
|
|
Chicken carcasses |
0.75% |
5/10 inoculated (104CFU) carcasses negative after treatment, slimy skin and tears in skin |
pH 2.68, 15 minutes, 25°C |
Nassar et al., 1997 |
|
|
Chicken skin |
1% |
"Significant reduction" |
Inoculated skin washed by agitating solution for 30 minutes at 25°C |
Hwang and Beauchat, 1995 |
|
|
Chicken carcasses |
1.0% |
10/10 inoculated (104CFU) carcasses negative after treatment, slimy skin and tears in skin |
pH 2.47, 15 minutes, 25°C |
Nassar et al., 1997 |
|
|
Chicken skin |
1% |
2.2 log10 reduction |
Pre-chill spray to inoculated chicken skin for 30 seconds at 206 kPa and 20°C. |
Xiong et al., 1998 |
|
|
Chicken skin |
2% |
2.2 log10 reduction |
Pre-chill spray to inoculated chicken skin for 30 sec at 206 kPa and 20°C. |
Xiong et al., 1998 |
|
|
Chicken breast skins |
o4% |
2 log reduction of firmly attached cells, but bleaching and off odour |
Scalder for 2 minutes at 50°C |
Tamblyn and Conner, 1997 |
|
|
Chicken breast skins |
6% |
2 log reduction of loosely attached cells, but bleaching and off odour |
Chiller for 60 minutes, 0°C; scalder for 2 minutes at 50°C |
Tamblyn and Conner, 1997 |
|
|
CHEMICAL TREATMENT - Mandelic acid |
|||||
|
Chicken breast skins |
6% |
2 log reduction of loosely attached cells, but bleaching and off odour |
Chiller for 60 minutes, 0°C; scalder for 2 minutes at 50°C |
Tamblyn and Conner, 1997 |
|
|
Chicken breast skins |
4% |
2 log reduction of firmly attached cells, but bleaching and off odour |
Chiller for 60 minutes, 0°C |
Tamblyn and Conner, 1997 |
|
|
CHEMICAL TREATMENT - Malic acid |
|||||
|
Chicken breast skins |
4% |
2 log reduction of both loosely and firmly attached cells, but bleaching and off odour |
Chiller for 60 minutes, 0°C |
Tamblyn and Conner, 1997 |
|
|
CHEMICAL TREATMENT - Propionic acid |
|||||
|
Chicken breast skins |
4% |
2 log reduction of firmly attached cells, but bleaching and off odour |
Chiller for 60 minutes, 0°C |
Tamblyn and Conner, 1997 |
|
|
CHEMICAL TREATMENT - Tartaric acid |
|||||
|
Chicken breast skins |
6% |
2 log reduction of firmly attached cells, but bleaching and off odour |
Scalder for 2 minutes at 50°C |
Tamblyn and Conner, 1997 |
|
|
CHEMICAL TREATMENT - Peroxidase catalysed chemical dip (PC) |
|||||
|
Broilers |
0.1 M citric acid + 0.1 M sodium citrate, ratio 1:1.5 |
"Significant reduction" |
pH 5.0, 30 minutes |
Bianchi et al. 1994 |
|
|
CHEMICAL TREATMENT - Hydrogen peroxide |
|||||
|
Chicken carcasses |
2% |
3/10 (104CFU) carcasses negative after treatment, bleaching, bloating and brown spots on skin |
pH 4.40, 15 minutes, 25°C |
Nassar et al. 1997 |
|
|
Chicken carcasses |
3% |
7/10 (104CFU) carcasses negative after treatment, bleaching, bloating and brown spots on skin |
pH 4.77, 15 minutes, 25°C |
Nassar et al. 1997 |
|
|
CHEMICAL TREATMENT - Sodium metabisulphite |
|||||
|
Chicken breast skin |
1% |
No reduction. |
Three application methods: chiller for 60 minutes, 0°C; scalder for 2 minutes, 50°C; dip for 15 seconds, 23°C |
Tamblyn, Conner and Bilgili, 1997 |
|
|
CHEMICAL TREATMENT - NaOH |
|||||
|
Chicken skin |
0.05% |
"Significant reduction" |
Inoculated skin washed by agitating solution for 30 minutes at 25°C |
Hwang and Beauchat, 1995 |
|
|
CHEMICAL TREATMENT - AvGard® (TSP) |
|||||
|
Broiler carcasses |
100 g/kg w/w |
Greater than 2 log reduction |
Immersion tank for 15 seconds |
Coppen, Fenner and Salvat, 1998 |
|
|
CHEMICAL TREATMENT - Trisodium phosphate (TSP) |
|||||
|
Post-chill chicken carcasses |
10% |
Significant reduction (ca 1.6-1.8 logs) at both 1 and 6 days post-treatment. Although 50°C-TSP gave 0.4 log greater reduction than 10°C, the difference was not significant. |
Dipped in solution at 10°C or 50°C for 15 seconds. |
Kim et al., 1994 |
|
|
Chicken skin |
1% |
"Significant reduction" |
Inoculated skin washed by agitating solution for 30 minutes at 25°C |
Hwang and Beauchat, 1995 |
|
|
Chicken skin |
1% plus 5% Tween 80 |
Reduction improved from the use of 1% TSP alone |
Inoculated skin washed by agitating solution for 30 minutes at 25°C |
Hwang and Beauchat, 1995 |
|
|
Chicken skin |
5% |
2.1 log10 reduction |
Pre-chill spray to inoculated chicken skin for 30 seconds at 206 kPa + 20°C. |
Xiong et al., 1998 |
|
|
Chicken breast skin |
8% |
1.6 log10 reduction on loosely attached S. Typhimurium populations and 1.8 log10 reduction on firmly attached S. Typhimurium populations |
Chiller for 60 minutes, 0°C |
Tamblyn, Conner and Bilgili, 1997 |
|
|
Chicken breast skin |
8% |
1.8 log10 reduction on firmly attached S. Typhimurium populations |
Dip for 15 seconds, 23°C |
Tamblyn, Conner and Bilgili, 1997 |
|
|
Chicken breast skin |
8% |
1.5 log10 reduction on loosely attached S. Typhimurium populations |
Scalder for 2 minutes, 50°C |
Tamblyn, Conner and Bilgili, 1997 |
|
|
Chicken carcasses |
10% |
Salmonellae not detected on 25-g neck skin sample |
pH 12, 15 seconds, 20°C |
Whyte et al., 2001 |
|
|
Chicken skin |
10% |
2.2 log10 reduction |
Pre-chill spray to inoculated chicken skin for 30 second at 206 kPa and 20°C. |
Xiong et al., 1998 |
|
|
CHEMICAL TREATMENT - Cetylpyridinium chloride (CPC) |
|||||
|
Chicken skin |
0.1% |
CPC spraying reduced numbers by 0.9 to 1.7 log units (87 to 98%). Generally, 50°C spraying showed greater reduction than 15°C, but the difference was not always significant. |
Solution sprayed against inoculated skin samples at 15°C or 50°C for 1 minute, at 138 kPa. |
Kim and Slavik, 1996 |
|
|
Chicken skin |
0.1% |
Reduction ranged from 1.0 to 1.6 log units (90 to 97.5%). Longer immersion times were more effective. Based on amount of CPC used, immersion appears more cost effective than spraying CPC. |
Immersion of inoculated skin surface at room temperature for either 1 minute, 1 minute + 2 minutes holding without CPC, or 3 minutes |
Kim and Slavik, 1996 |
|
|
Chicken skin |
0.1% |
1.5 log10 reduction |
Pre-chill spray to inoculated chicken skin for 30 seconds at 206 kPa and 20 C. |
Xiong et al., 1998 |
|
|
Chicken skin |
0.5% |
1.9 log10 reduction |
Pre-chill spray to inoculated chicken skin for 30 seconds at 206 kPa and 20°C. |
Xiong et al., 1998 |
|
|
CHEMICAL TREATMENT - Grapefruit seed extract (DF-100) |
|||||
|
Chicken skin |
0.1% |
1.6 log10 reduction |
Pre-chill spray to inoculated chicken skin for 30 seconds at 206 kPa and 20°C. |
Xiong et al., 1998 |
|
|
Chicken skin |
0.5% |
1.8 log10 reduction |
Pre-chill spray to inoculated chicken skin for 30 seconds at 206 kPa and 20°C. |
Xiong et al., 1998 |
|
|
SCALD TREATMENTS |
|||||
|
Chicken carcasses |
Scald temperatures of 52 C, 56°C and 60°C |
Carcasses scalded at 52°C or 56°C showed ~0.3 to 0.5 log reduction greater than those at 60°C |
52°C for 2.0 minutes, 56°C for 1.5 minutes and 60°C for 1.0 minute |
Slavik, Kim and Walker, 1995 |
|
|
Chicken carcasses |
Countercurrent scalding and postscald spray |
Changes contributed to substantial improvement in the bacterial quality of carcasses, but additional interventions in the chilling process (such as chlorination of chill water) are necessary |
240 ml of 60°C water was sprayed on each carcass at a pressure of 40 lbs/sq inch (psi) |
James et al., 1992b |
|
|
CHILL WATER IMMERSION TANK TREATMENTS |
|||||
|
Chicken carcasses |
Chill water without chlorination |
Prevalence increased during immersion chilling |
I hour in typical drag-through chiller |
James et al., 1992a |
|
|
Chicken carcasses |
Chill water with 25 ppm chlorination |
Prevalence remained constant with chlorination |
I hour in typical drag-through chiller |
James et al., 1992a |
|
|
RADIATION - Cobalt 60 |
|||||
|
Chicken carcasses |
3 k gray |
5/10 inoculated (104CFU) carcasses negative after treatment, no effect on colour, appearance or smell |
57 minutes/kGy of radiation |
Nassar et al. 1997 |
|
|
Chicken carcasses |
4 k gray |
8/10 inoculated (104CFU) carcasses negative after treatment, no effect on colour, appearance or smell |
57 minutes/kGy of radiation |
Nassar et al. 1997 |
|
|
Chicken carcasses |
7 k gray |
10/10 inoculated (104CFU) carcasses negative after treatment, no effect on colour, appearance or smell |
57 minutes/kGy of radiation |
Nassar et al. 1997 |
|
|
RADIATION - Gamma radiation |
|||||
|
Mechanically de-boned chicken meat (MDCM) |
3.0 kGy |
Reduction of 6.38 logs |
Cesium-137 gamma radiation source, irradiated in air, at +20°C |
Thayer and Boyd, 1991 |
|
|
RADIATION - Ultraviolet |
|||||
|
Halved broiler breast with skin on |
2 000 lWs/cm2 |
80.5% reduction |
2 cm-2 skin pieces were inoculated with 50 ll of solution containing 7x10⁵ CFU/ml and the UV intensity was kept constant at 81.7 lWs/cm2 while the treatment times were 20, 40, 60, 90 and 120 seconds. |
Summer et al., 1996 |
|
|
Halved broiler breast with skin on |
82 560 to 86 400 lWs/cm2 |
61% reduction compared with untreated halves. No negative effect on colour or increased rancidity of the meat |
Halves were inoculated 5 minutes prior to exposure at a wavelength of 253.7 nm |
Wallner-Pendleton et al., 1994 |
|
|
AIR SCRUBBING |
|||||
|
Broiler carcasses |
Diffused air, 158.6 kPa in tap water |
Water only: 32/40 positive. Air scrubbed: 9/40 positive. |
30 minutes |
Dickens and Cox, 1992 |
|
|
LINE SPEED |
|||||
|
Broiler carcasses |
Processed at 70, 80, and 90 birds per minute |
Prevalence did not change significantly with processing line speeds. |
|
Brewer et al., 1995 |
|
Bianchi, A., Ricke, S.C., Cartwright, A.L., & Gardner, F.A. 1994. A peroxidase catalyzed chemical dip for the reduction of Salmonella on chicken breast skin. Journal of Food Protection, 57: 301-304, 326.
Brewer, R.L., James, W.O., Prucha, J.C., Johnston, R.W., Alvarez, C.A., Kelly, W., & Bergeron, E.A. 1995. Poultry processing line speeds as related to bacteriologic profile of broiler carcasses. Journal of Food Science, 60: 1022-1024.
Campbell, D.F., Johnston, R.W., Campbell, G.S., McClain, D., & Macaluso, J.F. 1983. The microbiology of raw, eviscerated chickens: a ten-year comparison. Poultry Science, 62: 437-444.
Cason, J.A., Bailey, J.S., Stern, N.J., Whittemore, A.D., & Cox, N.A. 1997. Relationship between aerobic bacteria, salmonellae and Campylobacter on broiler carcasses. Poultry Science, 76(7): 1037-1041.
Coppen, P., Fenner, S., & Salvat, G. 1998. Antimicrobial efficacy of AvGard® carcass wash under industrial processing conditions. British Poultry Science, 39: 229-234.
Corry, J., James, C., James, S., & Hinton, M. 1995. Salmonella, Campylobacter and Escherichia coli 0157:H7 decontamination techniques for the future. International Journal of Food Microbiology, 28: 187-196.
Dickens, J.A., & Cox, N.A. 1992. The effect of air scrubbing on moisture pickup, aerobic plate counts, Enterobacteriaceae, and the incidence of Salmonellae artificially inoculated broiler carcasses. Poultry Science, 71: 560-564.
Dickens, J.A., & Whittemore, A.D. 1994. The effect of acetic acid and air injection on appearance, moisture pick-up, microbiological quality, and Salmonella incidence on processed poultry carcasses. Poultry Science, 73: 582-586.
Dickens, J.A., & Whittemore, A.D. 1995. The effects of extended chilling times with acetic acid on the temperature and microbial quality of processed poultry carcasses. Poultry Science, 74: 1044-1048.
Glynn, J.R., & Brandley, D.J. 1992. The relationship between infecting dose and severity of disease in reported outbreaks of Salmonella infections. Epidemiology and Infection, 109: 371-388.
Health Canada. [2000]. Risk assessment model for Salmonella Entritidis. Unpublished Health Canada document.
Hwang, C.-A., & Beuchat, L.R. 1995. Efficacy of selected chemicals for killing pathogenic and spoilage microorganisms on chicken skin. Journal of Food Protection, 58: 19-23.
Izat, A., Druggers, C., Colberg, M., Reiber, M., & Adams, M. 1989. Comparison of the DNA probe to culture methods for the detection of Salmonella on poultry carcasses and processing waters. Journal of Food Protection, 52: 564-570.
James, W.O., Brewer, R.L., Prucha, J.C., Williams, W.O., & Parham, D.R. 1992a. Effects of chlorination of chill water on the bacteriologic profile of raw chicken carcasses and giblets. Journal of the American Veterinary Medical Association, 200: 60-63.
James, W.O., Prucha, J.C., Brewer, R.L., Williams, W.O., Christensen, W.A., Thaler, A.M., & Hogue, A.T. 1992b. Effects of countercurrent scalding and postscald spray on the bacteriologic profile of raw chicken carcasses. Journal of the American Veterinary Medical Association, 201: 705-708.
Kim, J.-W., & Slavik, M.F. 1996. Cetylpyridinium chloride (CPC) treatment on poultry skin to reduce attached Salmonella. Journal of Food Protection, 59: 322-326.
Kim, J.-W., Slavik, M.F., Pharr, M.D., Raben, D.P., Lobsinger, C.M., & Tsai, S. 1994. Reduction of Salmonella on post-chill chicken carcasses by trisodium phosphate (NA3PO4) treatment. Journal of Food Safety, 14: 9-17.
Lillard, H.S. 1980. Effect on broiler carcasses and water of treating chilled water with chlorine and chlorine dioxide. Poultry Science, 59: 1761-1766.
Mintz, E.D., Cartter, M.L., Hadler, J.L., Wassell, J.T., Zingeser, J.A., & Tauxe, R.V. 1994. Dose-response effects in an outbreak of Salmonella enteritidis. Epidemiology and Infection, 112: 13-23.
Morrison, G.J., & Fleet, G.H. 1985. Reduction of Salmonella on chicken carcasses by immersion treatments. Journal of Food Protection, 48: 939-943.
Nassar, T.J., Al-Mashhadi, A.S., Fawal, A.K., & Shalhat, A.F. 1997. Decontamination of chicken carcasses artificially contaminated with Salmonella. Revue scientifique et technique de l’Office international des epizooties, 16: 891-897.
Nauta, M.J. 2000. Separation of uncertainty and variability in quantitative microbial risk assessment models. International Journal of Microbiology, 57: 9-18.
Parkin, R.T., & Balbus, J.M. 2000. Variations in concepts of "Susceptibility" in Risk Assessment. Risk Analysis, 20: 603-611.
Rejnmark, L., Stoustrup, O., Christensen, I., & Hansen, A. 1997. Impact of infecting dose on severity of disease in an outbreak of foodborne Salmonella enteritidis. Scandinavian Journal of Infectious Diseases, 29: 37-40.
Slavik, M.F., Kim, J.-W., & Walker, J.T. 1995. Reduction of Salmonella and Campylobacter on chicken carcasses by changing scalding temperature. Journal of Food Protection, 58: 689-691.
Sumner, S.S., Wallner-Pendleton, E.A., Froning, G.W., & Stetson, L.E. 1996. Inhibition of Salmonella typhimurium on agar medium and poultry skin by ultraviolet energy. Journal of Food Protection, 59: 319-321.
Tamblyn, K.C., & Conner, D.E. 1997. Bactericidal activity of organic acids against Salmonella typhimurium attached to broiler chicken skin. Journal of Food Protection, 60: 629-633.
Tamblyn, K.C., Conner, D.E., & Bilgili, S.F. 1997. Utilization of the skin attachment model to determine the antibacterial efficacy of potential carcass treatments. Poultry Science, 76: 1318-1323.
Thayer, D.W., & Boyd, G. 1991. Effect of ionizing dose, temperature, and atmosphere on the survival of Salmonella typhimurium in sterile, mechanically deboned chicken meat. Poultry Science, 70: 381-388.
USDA-FSIS. 1998. Salmonella Enteritidis Risk Assessment. Shell Eggs and Egg Products. Final Report. Prepared for FSIS by the Salmonella Enteritidis Risk Assessment Team. 268 pp. Available on Internet as PDF document at: www.fsis.usda.gov/ophs/risk/contents.htm.
US SE RA. See USDA-FSIS, 1998.
Wallner-Pendleton, E.A., Sumner, S.S., Froning, G.W., & Stetson, L.E. 1994. The use of ultraviolet radiation to reduce Salmonella and psychrotrophic bacterial contamination on poultry carcasses. Poultry Science, 73: 1327-1333.
Whyte, P., Collins, J.D., McGill, K., Monahan, C., & O’Mahony, H. 2001. Quantitative investigation of the effects of chemical decontamination procedures on the microbiological status of broiler carcasses during processing. Journal of Food Protection, 64: 179-183.
Xiong, H., Li, Y., Slavik, M.F., & Walker, J.T. 1998. Spraying chicken skin with selected chemicals to reduce attached Salmonella typhimurium. Journal of Food Protection, 61: 272-275.