


A detailed case study for Mexico was performed to illustrate the WISDOM approach. In this document, the main features and major conclusions of the study are presented; readers are referred to the original report for a detailed description of the work (Masera et al, 2003)
Currently, biofuels represent about 8% of the total energy demand in Mexico (SE, 1998), 46% of residential energy use (Figure 3) and more than 80% of the energy demand in the rural sector (Masera, 1996b). The three main types of biofuels used in the country are: bagasse, which is used in the sugar cane industry, fuelwood and charcoal. Fuelwood is by far the dominant woodfuel, with charcoal being used mainly in street industries and for barbecues. Total fuelwood use accounts for 3 times the total commercial timber legally harvested in the country (Masera, 1996a).
Figure 3. Residential Energy Use in Mexico 1965-1998
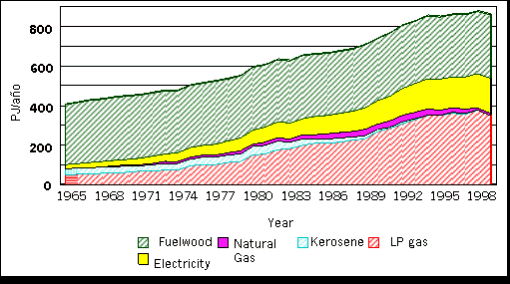
Source: SE,
1998.
Approximately one quarter of the population (25 million people) cooks with fuelwood in Mexico. Fuelwood is also used in many small (cottage) industries, like pottery making, tortilla making, brick making, and others. The use of fuelwood is concentrated in rural areas and small towns. Fuelwood markets are mostly of a local nature. Most fuelwood comes from forest areas (including here all degraded lands and semi-arid forests); many of the species used are of no commercial value, and the use of agricultural residues and dung is not widespread (Masera, 1996a; Masera et al, 1997).
The patterns of fuelwood use are extremely diverse, with a high heterogeneity in terms of saturation and growth of users and potential environmental impacts across the country. Studies that show the spatial patterns of fuelwood use, availability of woodfuel resources and woodfuel hot spots are still critically lacking. The undertaking of WISDOM was thus a required exercise. Table 6 shows the main premises for the WISDOM study. In the remainder of the section , each of the steps taken and the results achieved will be summarized.
Table 6. Main Characteristics of the Case Study in Mexico.
|
Main features of woodfuel use in Mexico |
The demand for woodfuels is concentrated on fuelwood and on rural areas. Most fuelwood is either collected or bought from local markets. The majority of fuelwood comes from commercial and non commercial forest areas (little comes from agricultural areas). Most demand comes from households; demand from small industries is significant within specific regions. |
|
Objective and scope of the analysis |
To determine fuelwood hot spots in the country for the year 2000. Hot spots were defined as those areas showing: high fuelwood demand for household use; high density and growth of fuelwood users; resistance to change to other fuels (due to social and cultural aspects) and few or insufficient woodfuel resources from forests. The analysis focused on fuelwood, households, and fuelwood-exclusive users |
|
Minimum Administrative Spatial Unit of Analysis |
Based on a country-wide geo-referenced database available from the Mexican National Bureau of Statistics (INEGI), the unit chosen was the Municipio (county). The country currently has a total of 2,460 municipios, of which 2435 were selected for this study. |
|
Demand Module |
The two main sources for the development of the module were: a) the National Population Censuses of 1980/1990/2000; and b) a comprehensive collection of local/regional/national surveys on energy use in the household sector. |
|
Supply Module |
The basis of the module is the National Forest Inventory 2000, which was conducted on a 1/250,000 scale over the whole country. The original 69 Land-use land-cover classes were aggregated into seven major classes (Velázquez et al. 2001). Average biomass productivities were assumed for each LU/LC class. |
|
Integration Module and GIS system |
A GIS was created using an ArcGIS platform. The GIS database includes information on fuelwood demand and supply for each of the 2435 municipios in the country. Different variables were created integrating supply and demand, such as pressure on woodfuel resources, potential deficit of woodfuels, and others. |
|
Priority zoning |
A set of uncorrelated variables was selected, grouping municipios into five main categories, high, mid-high, mid, mid-low and low (e.g. high consumption, mid-high consumption, and so on), for each variable. A simple indexing of all the variables and further grouping was conducted to rank municipios into five categories or priority levels. |
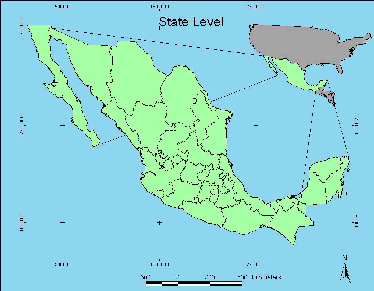
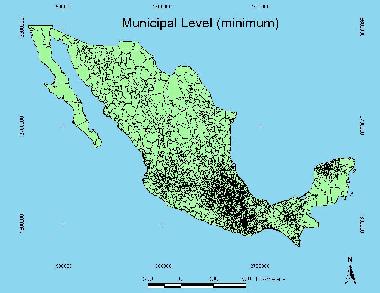
The municipio (county) was selected as the minimum administrative unit of analysis for conducting the WISDOM analysis (Fig. 4). A geo-referenced database that covers the whole country and is articulated into the state and national level is available from the Mexican National Bureau of Statistics (INEGI). A total of 2,460 units were identified and incorporated into a GIS. For each unit, basic information such as coordinates, area, and perimeter is available. Because around 70 municipios have changed since 1980 (new ones have been created and some have merged), the database needed to be harmonized and checked for consistency, leaving only those municipios that can be tracked in the twenty year period.
Figure 4. Spatial Administrative Units
within Mexico
The INEGI census (currently available electronically at the municipio level) was used as the basic source of information for the module. The census includes general sociodemographic variables as well as variables related to the quality of living of the Mexican population. The following variables were used in the study (Table 7). See also Fig. 5 for an illustration of the geographical distribution of fuelwood users as a percentage of total households in Mexico.
Table 7. Variables used in the demand module
|
Original Variables from the Census (1980/1990/2000) |
Population (urban,
rural, total). |
|
Original Parameters from Surveys |
Per Capita exclusive fuelwood consumption averaged over the major ecological zones (temperate, tropical dry, tropical humid, semi-arid and wetlands). |
New variables calculated |
Saturation of fuelwood users (% of exclusive fuelwood households over total households).
|
Figure 5. Saturation of fuelwood users at the municipio level. Mexico 2000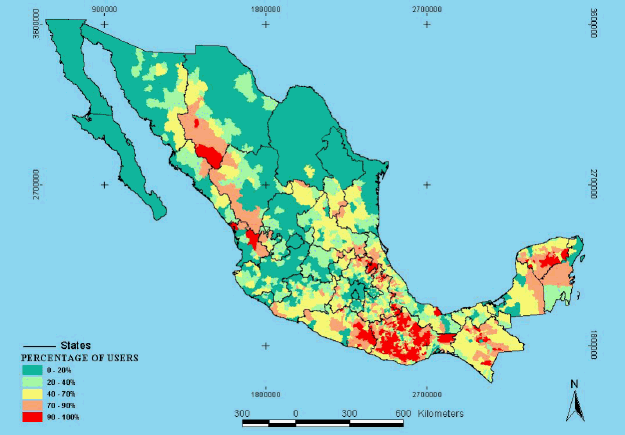
The supply module was based on the cartography derived from the latest Mexican National Forest Inventory (Palacio et al, 2000). It was conducted over a period of one year and was based upon data from INEGI and Landsat ETM-7 imagery. The procedure followed the interdependent interpretation method (FAO, 1996), which chiefly includes visual up-dating of the classes modified between the reference data base (Series II) and the current image (Landsat ETM-7 from 2000). The legend is hierarchical with four levels, namely, vegetation formations, vegetation types, vegetation communities and vegetation sub-communities, giving a total of 75 classes. The inventory was subjected to a reliability assessment with the aid of digital aerial photography (scale ±1:15,000).
For the purpose of this study, a simplified legend was derived with the following general LU/LC vegetation classes: 1) agriculture/pasture; 2) urban areas; 3) and 4) temperate forests (primary and secondary); 5) lakes; 6) scrubland; 7) mangroves; 8) other vegetation; 9) and 10) tropical deciduous forests (primary and secondary); 10) and 11) tropical evergreen forests (primary and secondary). (Fig.6)
With the help of the GIS, a database was created with a series of variables of interest related to woodfuel supply disaggregated at the municipio level. Estimates of aboveground biomass productivity by main vegetation type, based on a few available field surveys and bibliographic review, was also incorporated, mostly as an illustrative exercise (Fig.6). A more precise analysis needs to be carried out as soon as more in-depth studies on forest productivities by major LU/LC class are available in Mexico. Table 8 shows the different variables used to construct the woodfuel supply module.
Figure 6. Simplified Vegetation Map for Mexico 2000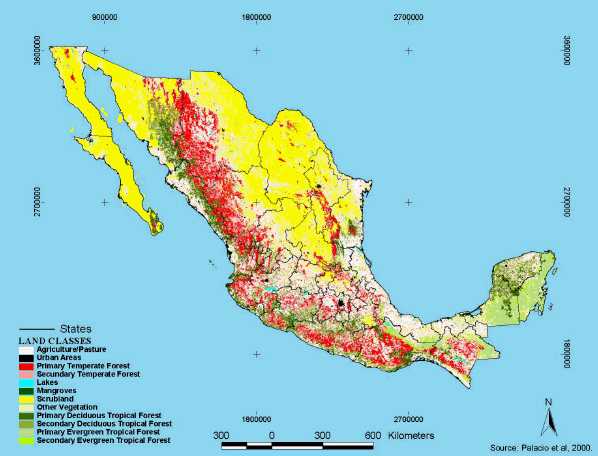
Table 8. Variables used in the supply module
Original Variables from the National Forest Inventory (2000) |
Area by each LU/LC (ha) |
Original parameters from surveys |
Total aboveground biomass productivity by forest class (ton/ha/yr). |
New variables calculated |
Total Forest Area (ha); includes temperate, tropical, shrubs, mangroves and other forests. Biomass Production from Forests (ton/yr). |
To estimate the biomass production from Mexican forests highlighted in Table 8, average biomass productivity (in ton/ha/yr) for each of the major forest types was estimated and incorporated into the supply module. Figure 7 shows the distribution of the resulting biomass forest productivities within the country. A more detailed analysis of forest productivities, for example using climate and soil conditions, will be required for a more accurate estimate of total biomass production at the municipio level.
Figure 7. Assumed Biomass Productivities for Mexican Forests (ton/ha/yr)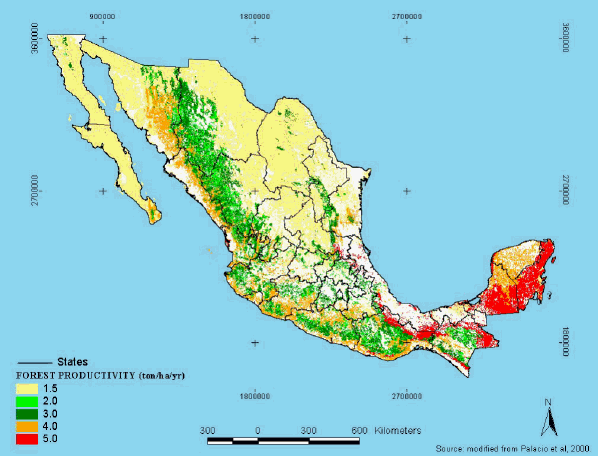
The information gathered in the supply and demand modules was combined to get a series of new variables, or indicators. This procedure was done iteratively during the development of WISDOM, as some demand variables depend on variables from the supply module (e.g. per capita fuelwood use) and vice versa.
Two main integrated variables of interest at the municipio level were derived:
Pressure on Forest Resources (fuelwood demand coming from forests / total forest area) in ton/ha/yr.
Fuelwood Balance (forest biomass productivity - fuelwood demand coming from forests) in ton/yr.
The amount of fuelwood that is harvested within forest areas was calculated as total fuelwood demand minus the proportion of fuelwood coming from non-forest areas. This last factor was obtained from local surveys conducted in the different ecological zones (temperate, tropical humid, tropical dry, semi-arid and wetlands). For example, in tropical regions of Mexico, about 20% of fuelwood consumption comes from non forest areas, which may include farmland trees, abandoned or regrowth areas due to shifting cultivation practices, and other areas. More detailed surveys covering all the ecological zones need to be conducted in order to obtain a more precise estimate of these proportions.
Figure 8 illustrates the distribution of the potential pressure on forest resources from the use of woodfuels. Red areas are those municipios showing the highest pressure from fuelwood harvesting (> 2 ton/ha/yr).
Figure 8. Potential pressure on local forests from the extraction of fuelwood (ton/ha/yr)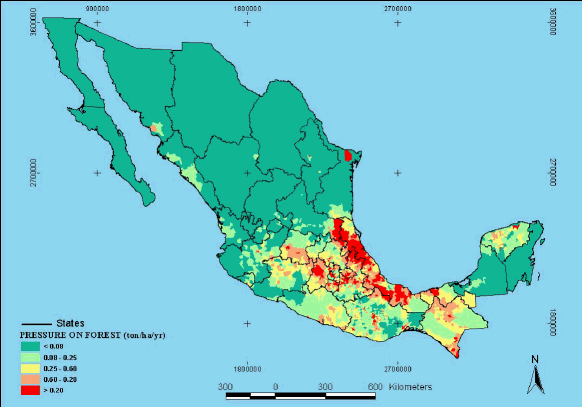
The last step of the analysis was the determination of the fuelwood hot spots. Four main sub-steps were necessary for this task:
1. Selection of a robust set of variables associated with fuelwood consumption and supply by municipio to be used in setting priority municipalities.
2. Ranking of municipios in 5 groups in terms of each of the individual variables.
3. Construction of an integrated fuelwood priority index (FPI) by municipio.
4. Ranking of municipios in 5 groups according to the FPI.
A correlation matrix was built with the different potential variables associated with the demand and supply of fuelwood. The matrix and the subsequent analysis allowed the selection of a smaller set of uncorrelated variables for the setting of a priority ranking of municipalities within the country. The objective of the priority ranking was to find municipalities that show high fuelwood demand, high density and growth of fuelwood users, resistance to change to other fuels (due to social and cultural aspects), and few or insufficient woodfuel resources. It was clear from the analysis that several variables were closely correlated. For example, there was a close correlation between fuelwood consumption and fuelwood users and between the income level and the saturation of fuelwood users.
Table 9 shows the correlation analysis. Based on this statistical analysis a final set was chosen with the following six uncorrelated, or loosely correlated, variables:
Total number of exclusive fuelwood users.
Saturation of fuelwood users (proportion of households that use exclusively fuelwood).
User density (number of exclusive fuelwood users / total municipality area).
Percentage of people belonging to an ethnic group.
Discrete annual growth rate of exclusive fuelwood users (1990-2000).
Fuelwood balance (total forest productivity - annual fuelwood consumption coming from forest areas).
Table 9. Correlation Coefficients for the full set of fuelwood related variables
|
Correlation coefficients | |||||||||
Variable |
Income |
Number of exclusive fuelwood users |
Saturation |
Annual consumption |
User Density |
User |
% of Indigenous population |
Growth |
Fuelwood balance |
Pressure |
Income level |
1 |
-0.14 |
-0.84 |
-0.16 |
-0.21 |
0.04 |
-0.50 |
-0.24 |
0.15 |
0.03 |
Number of exclusive fuelwood users |
-0.14 |
1 |
0.13 |
0.97 |
0.17 |
-0.01 |
0.07 |
0.25 |
0.05 |
-0.01 |
Saturation of fuelwood users |
-0.84 |
0.13 |
1 |
0.15 |
0.24 |
-0.03 |
0.64 |
0.32 |
-0.14 |
-0.02 |
Annual consumption of forest fuelwood |
-0.16 |
0.97 |
0.15 |
1 |
0.17 |
-0.02 |
0.10 |
0.24 |
0.04 |
-0.01 |
User Density (A) |
-0.21 |
0.17 |
0.24 |
0.17 |
1 |
0.11 |
0.28 |
0.14 |
-0.15 |
0.06 |
User Density (B) |
0.04 |
-0.01 |
-0.03 |
-0.02 |
0.11 |
1 |
-0.01 |
0.02 |
-0.02 |
0.98 |
% Indigenous population |
-0.50 |
0.07 |
0.64 |
0.10 |
0.28 |
-0.01 |
1 |
0.21 |
-0.09 |
-0.01 |
Growth rate of fuelwood users |
-0.24 |
0.25 |
0.32 |
0.24 |
0.14 |
0.02 |
0.21 |
1 |
-0.08 |
0.02 |
Fuelwood Balance |
0.15 |
0.05 |
-0.14 |
0.04 |
-0.15 |
-0.02 |
-0.09 |
-0.08 |
1 |
-0.01 |
Pressure on Forest |
0.03 |
-0.01 |
-0.02 |
-0.01 |
0.06 |
0.98 |
-0.01 |
0.02 |
-0.01 |
1 |
For each of the variables selected, municipios were grouped and ranked into 5 categories, reflecting the acuteness (or priority) of the problem:
Group 1 = low priority
Group 2 = mid-low priority
Group 3 = medium priority
Group 4 = mid-high priority
Group 5 = high priority
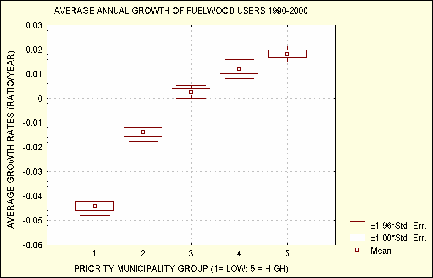
For example, regarding the proportion of fuelwood users, low priority municipalities are those with low saturation and high priority those showing high saturation of users. Thematic maps were prepared for each variable. Figures 9 and 10 illustrate this analysis for the growth of fuelwood users, and the balance between forest biomass production and fuelwood demand from forest areas. It is interesting to note the uneven geographical distribution of the different group of municipios regarding the different criteria.
Figure 9. Growth of
fuelwood users in Mexico 1990-2000
Figure 10. Fuelwood Balance by Municipality in Mexico 2000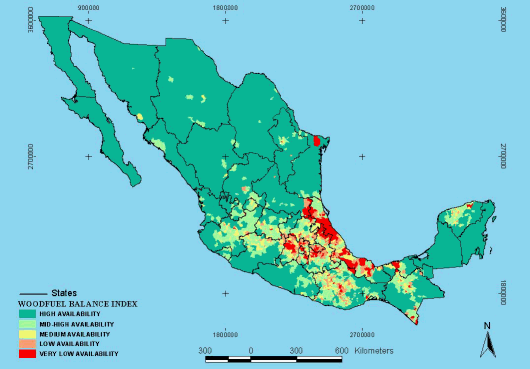
The third step of the analysis was the development of an overall priority index for each municipio that integrates the six variables identified in the final set. In order to perform this analysis, each municipio was given a numerical value for each variable, from 1 to 5 according to its degree of priority (low priority = 1; high priority = 5). Then, an overall fuelwood priority index was obtained as follows:
![]()
where:
FPIj = woodfuel priority index for each municipio j
Ii = index for each variable used in the analysis (6 in total), ranging from 1 to 5.
pj = weights, set to 1 in this case.
With each municipio being assigned a numerical index that integrates the different concerns regarding fuelwood consumption and availability of resources, the final step was a regrouping into the five categories defined in the previous section, from low priority to high priority (Fig. 11 and Fig. 12).
The analysis of the original 2402 municipios used to calculate the FPI produced the following results:
High priority à 262 municipios
Mid-high priority à 388 municipios
Medium priority à 462 municipios
Table 10 shows the average values of selected variables of interest related to fuelwood consumption and forest resources for each group of municipios ranked by FPI. It is easily seen that high priority municipalities are those that consistently show the highest number of users and the highest consumption of fuelwood, highest density and growth of users, highest indigenous population (a proxy variable related to the resistance to change to other fuels) and the lowest surplus of fuelwood resources.
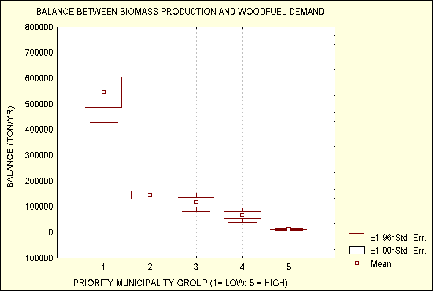
A statistical analysis was conducted to corroborate the significance of the groups. An overall ANOVA confirmed that the five groups were statistically different at a 95% confidence level. The differences among all groups are also statistically significant for most groups and variables, as can be seen from a box-plot analysis showing averages and standard errors for each group graphically (Figures 13 A and B).
Figure 11. Priority municipios in terms
of fuelwood use and availability of fuelwood resources, Mexico 2000
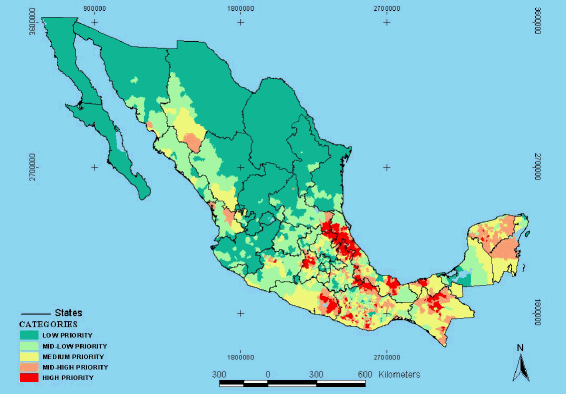
Figure 12. Priority Municipios in terms
of fuelwood use and availability of fuelwood resources,
Mexico 2000. Detail for South-East Mexico
(States of Chiapas, Oaxaca, and
Guerrero)
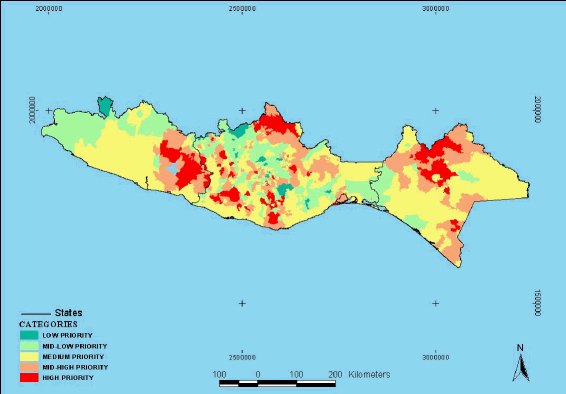
Table 10. Characteristics of each Priority Group of Municipios according to selected variables
FPI Groups |
Income level |
Fuelwood exclusive users |
Saturation of fuelwood
users |
Annual consumption from forests |
User Density (A) |
Indigenous population(%) |
Growth Rate of fuelwood users(%) |
Fuelwood Balance(ton/yr) |
High priority |
1.7 |
15,217 |
86 |
4,743(5,402) |
1.02(0.62) |
68.2 |
2 |
20,816(34,196) |
Mid-high priority |
2.6 |
11,628(13,087) |
72 |
4,199(,5740) |
0.61(0.73) |
43.7 |
1 |
68,390(270,546) |
Medium priority |
3.2 |
9,765(12,636) |
59 |
3,840(6,635) |
0.38(0.51) |
23.3 |
0 |
120,299(394,389) |
Mid-low priority |
4.0 |
5,880(7,262) |
41 |
2,272(3,462) |
0.22(0.21) |
6.4 |
-1 |
144,756(404,451) |
Low priority |
5.1 |
2,436 |
17 |
952 |
0.05(0.05) |
0.8 |
-4 |
543,977(1,487,274) |
All groups |
4 |
7,583(10,862) |
48 |
4,773(7,514) |
0.35(0.52) |
20.5 |
-1% |
214,836(829,019) |
Note: Standard deviation values are shown in brackets.
Figure 13.
Statistical differences among groups of municipios
![]()

The WISDOM analysis conducted for Mexico enabled the following:
Identifying and ranking fuelwood hot spot municipalities according to a set of criteria related to fuelwood consumption and its impact on local forest resources. The analysis helped to the municipalities in Mexico where actions aimed at improving the social and environmental sustainability of fuelwood use are required.
Establishing a comprehensive GIS that permits a readily spatial representation of municipios, according to a set of predefined criteria. The GIS can also be used to develop future scenarios of the fuelwood situation in the country, and can also be connected to other problems such as the emissions of greenhouse gases derived from fuelwood use.
Developing a powerful tool for strategic planning, which facilitates a more efficient use of scarce financial and human resources, concentrating them on those areas requiring the most urgent attention.