![]()
![]()
![]()
There are many reasons for doing risk assessments but they all fall into three main categories:
identifying high risk products and pathogens in your industry;
managing risks in your industry;
identifying where in the food chain control steps can best be applied.
In this Section we focus on each of these categories by:
risk profiling to focus on priorities;
integrating risk managers with risk assessors;
linking risk assessment with HACCP.
There is sometimes an impression that a particular food category is high risk and people tend to jump to conclusions if there is an outbreak of food poisoning. "Must be the prawns" they say, even though consumers ate a range of foods and there is no evidence linking the problem with any one food item. So risk profiling has great use in helping you focus on particular pathogens and products that are more likely than others to cause serious problems. Risk profiling is defined as "a description of a food safety problem and its context developed for the purpose of identifying those elements of a hazard or risk that are relevant to risk management decisions".
An example of a risk profile of an entire industry is provided by the Australian industry. In 2000, the Australian seafood industry began to build an Australia Seafood Standard and decided to do a risk profile as a first step. A number of hazard:product pairings were identified and a risk ranking made of each pairing (Table 9). A spreadsheet tool called Risk Ranger was used (see Section 4), and data to complete the questions were obtained from the literature or were based on expert opinion of the risk assessors. Full details of the profile are presented in Sumner and Ross (2002), which is included in the Resource Bank.
TABLE 9
Risk rankings of hazard:product pairings of
significance for the Australian seafood industry
|
Hazard: product pairing |
Selected population |
Risk ranking * |
|
Ciguatera in reef fish |
General Australian population |
45 |
|
Ciguatera in reef fish |
Recreational fishers, Queensland |
60 |
|
Histamine in tunas and other fish |
General Australian population |
40 |
|
Algal biotoxin in shellfish-controlled waters |
General Australian population |
31 |
|
Algal biotoxin - during an algal bloom |
Recreational gatherers |
72 |
|
Mercury in predaceous fish |
General Australian population |
24 |
|
Viruses in oysters - contaminated waters |
General Australian population |
67 |
|
Viruses in oysters - uncontaminated waters |
General Australian population |
31 |
|
V. parahaemolyticus in cooked prawns |
General Australian population |
37 |
|
V. cholerae in cooked prawns |
General Australian population |
37 |
|
V. vulnificus in oysters |
General Australian population |
41 |
|
L. monocytogenes in cold smoked seafoods |
General Australian population |
39 |
|
L. monocytogenes in cold smoked seafoods |
Susceptible (aged, pregnant, etc) |
45 |
|
L. monocytogenes in cold smoked seafoods |
Extremely susceptible (AIDS, cancer) |
47 |
|
C. botulinum in canned fish |
General Australian population |
25 |
|
C. botulinum in vacuum packed smoked fish |
General Australian population |
28 |
|
Parasites in sushi/sashimi |
General Australian population |
31 |
|
Enteric bacteria in imported cooked shrimp |
General Australian population |
31 |
|
Enteric bacteria in imported cooked shrimp |
Susceptible (aged, pregnant etc) |
48 |
* Note: a change in risk ranking of six units is equivalent to a tenfold change in risk
As a result of the profiling exercise, seafoods in Australia were grouped into three risk categories:
"Low" risk category (risk ranking <32)
This category includes mercury poisoning (relative risk (RR) = 24), Clostridium botulinum in canned fish (RR = 25), or in vacuum-packed cold smoked fish (RR = 28), parasites in sushi/sashimi (RR = 31), viruses in shellfish from uncontaminated waters (RR=31), enteric bacteria in imported cooked shrimp (RR = 31) and algal biotoxins from controlled waters (RR = 31). There have been no documented cases of food-borne illness from any of the above hazard:product pairings in Australia.
"Medium" risk category (risk ranking 32-48)
This category includes V. parahaemolyticus in cooked prawns (RR = 37), V. cholerae in cooked prawns (RR = 37), L. monocytogenes in cold smoked seafoods (RR = 39), histamine fish poisoning (HFP) (RR = 40), V. vulnificus in oysters (RR = 41), ciguatera in the general Australian population (RR = 45), L. monocytogenes in susceptible (RR = 5) and extremely susceptible populations (RR = 47) and enteric bacteria in imported cooked shrimp eaten by vulnerable consumers (RR = 48).
With the exception of V. cholerae or enteric bacteria in imported prawns, all of these hazards have caused several outbreaks of food poisoning in Australasia.
"High" risk category (risk ranking >48)
This category includes ciguatera from recreational fishing in susceptible areas (RR=60), viruses in shellfish from contaminated waters (RR=67) and algal biotoxins from uncontrolled waters in an algal event (RR=72). All of these hazard:product combinations have caused large-scale food poisoning incidents.
Directions from the risk profile
At the end of the risk profiling exercise you will know much about your industry and will be able to make a priority listing of hazards and products that require more complete risk assessment.
The profiles also provide a focus for seafood risk managers, showing them the pathogens and products on which they should concentrate. The ways managers can approach their task is illustrated in the next section.
When the risk assessors complete their work and present their estimates, the risk managers use the estimates to regulate (manage) the hazard. Continuing the Australian approach as an example, there are no fewer than eight risk managers who represent the various states and territories in the country. For some states and territories, the profiles alerted risk managers to hazards and products that needed urgent attention. For example:
Exports of live reef fish to Asia and the risk of ciguatera is managed by the Australian Quarantine and Inspection Service (AQIS).
A huge recreational fishery for which ciguatera is a risk managed by SafeFood Queensland.
The risk of enteric pathogens in oysters is managed by several state authorities.
The risk of uncontrolled gathering of clams on remote beaches during an algal event is managed by various state authorities.
The above examples are presented to show how risk managers in different parts of a country need to focus on specific, regional risks. Of course, risk managers interface with all stakeholders in risk communication phases, but in the end it is the managers who must make the regulatory decisions to manage specific risks. Risk Ranger is a useful tool for risk managers and following is an example of how they could use the tool.
Viral contamination of oysters is an enduring cause of illness in many countries. Viruses most commonly associated with outbreaks are Norwalk and noroviruses (also termed small round structured viruses [SRSVs]) and HAV. Illnesses result from contamination of oyster leases by human sewage during heavy rainfall events. Most countries have a classification system for oyster growing areas based on the likelihood of their becoming contaminated by human sewage. The classification is linked with activities such as:
depuration;
relaying contaminated oysters in "clean" waters;
stopping of harvest after rainfall events;
management strategies intended to reduce viral contaminants to an acceptable level.
Interestingly, while HACCP has become the preferred risk management for the food industry, virus control by depuration and relaying are processes that have not been validated as critical control points (Lees, 2000).
As populations increase, traditional oyster leases become encroached by human habitation, and this results in contamination of oyster beds during rainfall events. One obvious course of action open to you, as a risk manager, is to prevent oysters being harvested in areas that are subject to regular contamination with human faeces (so-called "restricted" areas) by ordering their permanent closure. However, if you try to do this you will find that food safety competes with political, social and economic issues. Clearly it would be advantageous if you could use straightforward risk estimates to explain the bases of your risk management decisions.
One approach is to use Risk Ranger to compare the probability of contracting Hepatitis A after consuming oysters from waters that are never subjected to contamination with human faeces, with oysters from waters that often become contaminated after heavy rainfall. Table 10 contains all the inputs to Risk Ranger for the two scenarios.
A number of assumptions are made:
Prevalence of HAV in oysters from pristine waters is 0.001 percent.
In oysters harvested from contaminated waters prevalence is 15 percent. This was the prevalence of contamination in oysters one month after a Hepatitis A outbreak in Australia in 1997 (Conaty et al., 2000; Grohmann, 1997).
At least 1 000 units of HAV are required to cause illness in the average consumer (Rose and Sobsey, 1993).
This level will already exist in oysters from polluted waters.
A 100x increase is required to reach an infective level in oysters from "clean" waters.
Consumption size is a serving of six oysters (about 100 g).
In considering consumption from uncontaminated waters, some (25 percent) of the population were assumed to consume a monthly serving.
In the scenario where oysters were contaminated with HAV, most (75 percent) of a localized population of 100 000 were assumed to consume a weekly serving.
If these data are input to Risk Ranger, there is a great difference in risk ranking and predicted illnesses. Oysters from clean waters have a risk ranking of 20 and predicted illnesses of 1 every 20 years. By contrast, oysters from polluted waters have a risk ranking of 70, which is 100 000 000 times increased risk compared with oysters from clean waters. It is predicted that all 100 000 consumers will become ill.
TABLE 10
Risk ranking of oysters consumed raw from
waters that are never polluted and those that are subject to human faecal
contamination
|
Risk criteria |
"Clean" waters |
Waters subject to pollution |
|
Dose and severity |
|
|
|
Hazard severity |
Mild - sometimes requires medical attention |
Mild - sometimes requires medical attention |
|
Susceptibility |
General - all population |
General - all population |
|
Probability of exposure |
|
|
|
Frequency of consumption |
Weekly |
Weekly |
|
Proportion consuming |
Some (25%) |
Some (25%) |
|
Size of population |
1 900 0000 |
100 000 |
|
Probability of contamination |
|
|
|
Probability of raw product contaminated |
0.001% |
15% |
|
Effect of processing |
No effect |
No effect |
|
Possibility of recontamination |
None |
None |
|
Post-process control |
Not relevant |
Not relevant |
|
Increase to infective dose |
100 times |
None |
|
Further cooking before eating |
Not effective in reducing hazard |
Not effective in reducing hazard |
|
Estimated annual illnesses |
1 every 20 years |
100 000 |
|
Risk ranking (0-100)* |
20 |
70 |
* Note: a change in risk ranking of six units is equivalent to a tenfold change in risk
Clearly, your task as risk manager is made more straightforward by Risk Ranger predictions. Now, the responsibility is moved from resting solely on your shoulders, to being shared with stakeholders who must choose whether to continue with increased risk predicted illnesses.
In summary, the risk characterization model allows a rapid "broad brush" estimation of risk, which will assist risk managers to prioritize hazard: product pairings for more intensive risk assessment studies. It also allows timely response to "what if" scenarios, which will benefit risk managers and communicators, alike.
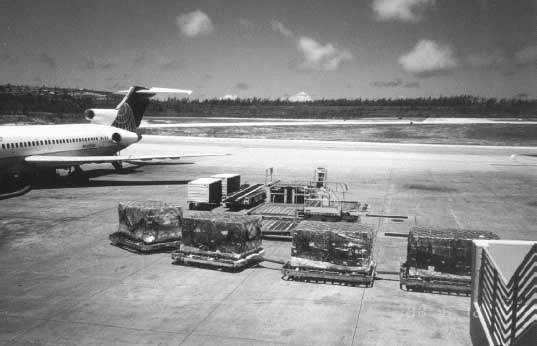
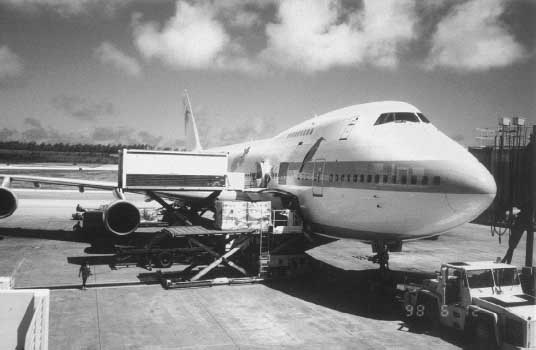
Since the 1980s, HACCP has become an important part of the food business as a hazard management system. The first HACCP principle requires assessment of whether the hazard is "significant", which implies some assessment of risk (severity + likelihood), which raises the question "are HACCP and risk assessment linked?" Most people would answer "Yes, they are linked but I cannot quite work out how". Here is an example of how HACCP and risk assessment can go together. Note that the example is entirely hypothetical and the photographs (below) do not refer to any problem with transshipping tuna.
Your Fisheries Department receives the following photographs by electronic mail from the regulatory authorities in the importing country. One of their inspectors spent all day in transit, and observed several pallets of chilled tuna in cartons that sat on the tarmac for eight hours. The inspector was able to identify the company, which is your largest exporter of tuna. When it arrived in the importing country, the entire consignment was confiscated and an immediate embargo placed on your exports.
Initial investigation
You are charged with fixing the problem. The importing country stipulates that you must make "risk-based" decisions in solving the problem. Since exports have been banned, your supervisor wants the problem fixed very quickly.
You contact the exporting company and learn that they routinely include a data logger in each consignment. The exporter's agents in the importing country are able to locate the logger and download the data. The temperature: time trace (Figure 1) indicates substantial product warming. The agents tell you the carton was on the outside of the stack, which means it measured worst-case product warming of product in the consignment.
08.00 at the transit airport where product from your country changes flights. The scheduled flight has been cancelled and several tonnes of chilled tuna are left on the tarmac until another flight arrives. The ground temperature is 33 °C
16.30 at the transit airport. Product is being loaded on a rescheduled flight. During the day, maximum ground temperature reaches 40 °C
Estimating growth on tuna
By using predictive microbiology you can estimate the growth of histamine-producers on a product in each outer carton. Table 11 contains growth rates at each temperature (from the literature), and by multiplying by the length of time the product was in that temperature zone you can calculate potential growth. You can do this by using data from Figure 1.
FIGURE 1
Product temperature at site of
microbiological concern during transit of chilled tuna
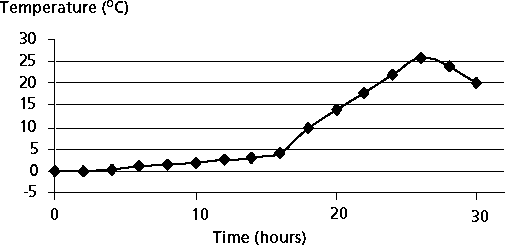
TABLE 11
Potential growth of histamine-producers on tuna
abused at high temperatures
|
Temperature zone |
Generation time (hours) |
Time in zone (hours) |
Potential growth (generations) |
|
10-15 |
3 |
3 |
1 |
|
15-20 |
1.5 |
3 |
2 |
|
20-25 |
1.0 |
5 |
5 |
|
25-30 |
0.75 |
3 |
4 |
Increased risk at warm temperatures
The steep rise in temperature while product is exposed to direct sunlight sees the surfaces of microbiological concern rise to 26 °C before loading into the air-conditioned hold of the airliner stabilizes temperature. Around 12 generations (3-4 log growth) occurred during the storage on tarmac and this can be inputed to Risk Ranger to assess the increased risk (Table 12).
The total consignment was more than 3 tonnes, of which 1 tonne was severely temperature-abused, and you concentrate on this portion of the consignment. There are around 10 000 servings of 100 g each serving that have been temperature-abused. Calculations indicate that histamine-producers will have grown to around 10 000/g of product. If someone consumed 100 g of this product they would ingest the equivalent of the histamine produced by one million bacteria/g. It is assumed that if histamine-producers reach 100 000 000/g they will produce sufficient histamine to cause illness. Thus a further increase of 100x is needed for a toxic level.
All the above data are input to Risk Ranger. The risk ranking as shown in Table 12 is 67, and around 5 000 illnesses are predicted from the 10 000 servings, which will be eaten over a period of about one week.
TABLE 12
Semi-quantitative risk characterization of HFP
following consumption of tuna that has been temperature-abused
|
Risk criteria |
Product that has undergone temperature abuse |
|
Dose and severity |
|
|
Hazard severity |
Mild - sometimes requires medical attention |
|
Susceptibility |
General - all population |
|
Probability of exposure |
|
|
Frequency of consumption |
Weekly |
|
Proportion consuming |
All (100%) |
|
Size of population |
10 000 |
|
Probability of contamination |
|
|
Probability of raw product contaminated |
0.1% |
|
Effect of processing |
Chilled storage prevents growth of histamine producing bacteria |
|
Possibility of recontamination |
None |
|
Post-process control |
Poor (>3 log increase) |
|
Increase to infective dose |
100x |
|
Further cooking before eating |
Not effective in reducing hazard |
|
Predicted illnesses |
5 200 |
|
Risk ranking (0-100) |
67 |
Integrating risk assessment with HACCP
You examine the HACCP plans of each company exporting tuna. A typical plan is shown in Table 13 and does not take into account the possibility that product will be held up if flights are delayed. Your supervisor informs you that a high-level delegation is coming from the importing country to review your risk assessments and integration with HACCP. He indicates that they will need to see a great deal of rigour surrounding the transit airport. It seems flight delays are not uncommon, which turns out to be the only reason your exporters include a data logger, so they have evidence against the airlines in an insurance claim.
TABLE 13
Current HACCP plan form for control of
histamine formation during the air journey
|
Critical Control Point (CCP) |
Significant Hazards |
Critical Limits for each Preventive Measure |
Monitoring |
Corrective Action |
Records |
Verification |
|||
|
What |
How |
Frequency |
Who |
||||||
|
CCP 6: Air freight |
Histamine formation |
Fish no warmer than 5 °C on arrival |
Product temperature |
Temperature logger |
One logger per lot |
Importer |
Accept/ reject fish. Re-ice |
Data logger |
Check on return of logger |
TABLE 14
Revised HACCP plan form for temperature control
of product at the transit airport
|
Critical Control Point (CCP) |
Significant Hazards |
Critical Limits for each Preventive Measure |
Monitoring |
Corrective Action |
Records |
Verification |
|||
|
What |
How |
Frequency |
Who |
||||||
|
CCP 6: Transit |
Histamine formation |
Store in air-conditioned hanger for <3 hours ("normal" transit) |
Location |
Visual, and record times on Consignment Sheet |
Every consignment |
Airport agent |
Agent arranges immediate transfer to air-conditioned hanger |
Consignment sheet |
Consignment sheet faxed to company |
| |
|
Store in air-conditioned hanger for >3 hours ("delayed" transit) |
Air temperature |
Data logger |
Every storage when there is a delay |
Airport agent |
Agent logs ambient temperature and storage time |
Consignment sheet Data logger |
Consignment sheet faxed to company Data logger downloaded and information emailed to company |
|
CCP 7: Arrival |
Histamine formation |
Fish no warmer than 5 °C |
Product temperature |
Temperature logger in marked carton |
One logger per lot |
Importer |
Accept/reject fish. Re-ice |
Data logger |
Check on return of logger |
Clearly there is the need for cold storage at the transit airport so that product can be quickly taken from the furnace-heat of the tarmac. Enquiries indicate that there is not much cold storage space, but there is a large air-conditioned hanger at 10-15 °C, which is used for holding flowers, fruits and vegetables. Pallets can be quickly driven there until the transit flight arrives. You simulate these storage conditions in your country by using data loggers and find that product does not rise above 5 °C even after 12 hours storage at 10-15 °C. You use this study as part of the HACCP validation for the visiting delegation.
Your next task is to set up a system at the airport that ensures product is moved to cool storage if there is a flight delay. This involves:
employing an agent at the transit airport to handle all consignments from your country;
setting up a record of arrival time and departure time of each consignment;
placing all consignments in air conditioned hanger until the connecting flight begins loading;
. fixing a single-use data logger to the outside of a pallet stack to monitor ambient temperature and time of delay;
downloading data to the exporting company for verification of control of air temperature.
The systems you set up are fixed in the new HACCP plan for air transit control (Table 14).
By using Risk Ranger you can quickly estimate changes in risk of becoming ill from HFP with changes to the HACCP plan. The plan as set out in Table 12 has a risk ranking of 67, because flight delays lead to a loss of temperature control. The HACCP plan as set out in Table 14 reduced risk ranking to 12. The reduction in risk is on the order of 100 million times.
This gives you considerable documentation to set before the delegation and, if they request different scenarios, you can quickly simulate them using Risk Ranger.
Your risk assessment work has generated a good deal of information on how your export tuna fishery operates, and you are now able to bring HACCP plans onto a true risk basis.
![]()
![]()
![]()