![]()
![]()
![]()
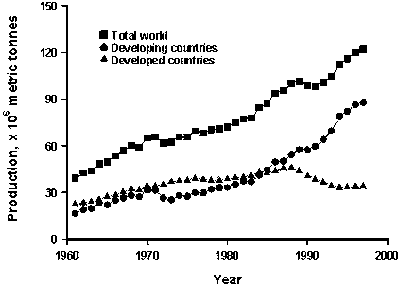
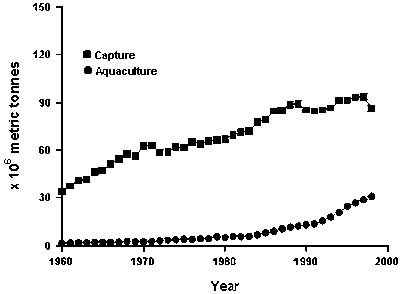
World fish production (catches of wild fish plus production in aquaculture) has increased steadily to approximately 120 million tonnes in recent years (Figure 2.1) (FAO, 2000). Declines in captured fish were seen in 1998 (Figure 2.2), mainly due to decreased catches of small pelagic fish in Chile and Peru, caused by the "El Niño". This decline affected mainly fish meal production, while food fish production stayed the same. In 1999 and 2000 fish production recovered and returned to pre-El Niño level. China is the top producer with some 41.6 million tonnes in 2000. Peru was the second major fishing nation with catches of 10.7 million tonnes. The importance of aquaculture continues to expand, especially for freshwater species such as carp, and almost one third of fish used for human consumption are now produced in aquaculture (FAO, 2000).
|
Figure 2.1 |
|
|
Figure 2.2 |
|
While aquaculture has been increasing for the last 20 years, the increment has dropped during the last five years. The total value of aquaculture and catches by 2000 was approx US$ 130 000 million and total world trade of fish and fishery products increased in 2000 to r each US$ 54 000 million for exports. Thailand is the main exporting country with US$ 4 300 million. China experienced a sharp increase in its export performance. It is now number two among all fish exporting countries with US$ 3 700 million. The Chinese fisheries exporting industry is specializing in re-processing of imported raw material, creating a strong value-addition in this process. Norway, which used to be number two fish exporter in previous years, reported lower export values. This is in part due to lower salmon prices, but also caused by low value of the euro - the currency of the main trading area for Norwegian fish. Almost two thirds of the total world production is produced by or caught in developing countries (Figure 2.1).
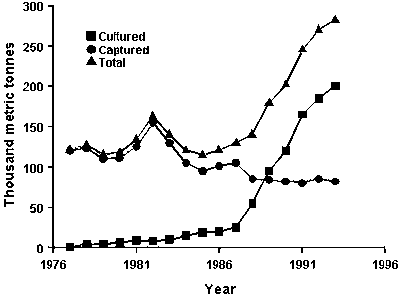
Developed countries accounted for more than 80% of total imports of fishery products in 2000 in value terms. Japan was the biggest importer of fishery products, accounting for some 26% of the global total. The European Union (EU) has increased its dependency on imports for its fish supply. The United States, besides being the world's fourth major exporting country, was the second biggest importer. Imports were growing in 2000, mainly due to expanding shrimp imports. Shrimps and prawns are increasingly produced in aquaculture especially in Southeast Asia. A significant increase has been seen in countries such as Thailand (Figure 2.3).
|
Figure 2.3 |
|
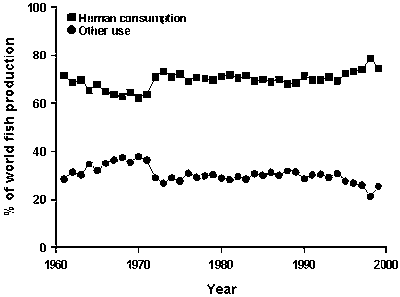
Between 20 and 30% of the total world production of fish is used to manufacture animal feeds (Figure 2.4). The greater tonnage comes from processing whole fish that are not suitable for human consumption because they are too bony, too oily, or otherwise unsatisfactory; these fish are sometimes called "industrial fish". Examples of fish used for fishmeal include capelin, menhaden (Brevoortia spp.), sand eel, sprat, Norway pout, blue whiting, horse mackerel, Atlantic herring (Clupea spp.), anchovy (Engraulis spp.), pilchard and related species. In the USA, for example, the entire menhaden catch goes to rendering. Some of these fish, e.g. Atlantic herring, could be used for direct consumption and the EU prohibits use of Atlantic herring for fish meal production. A secondary source is the waste (offal) from fish and shellfish operations. South America, especially Peru and Chile are big producers of fishmeal with a yearly catch between 5 and 15 million tonnes of industrial fish. Amounts have fluctuated partly due to the El Niño. European countries (Denmark, Norway, Iceland and others) process approximately 6 million tonnes per year and the USA process 1 million tonnes. The vast majority of fishmeal (50%) and fish oil (90%) is used for aquaculture feeds.
|
Figure 2.4 |
|
The bovine spongiform encephalopathy (BSE) scare has had an impact on the fish meal market particularly in Europe in 2001. In early 2001 the EU prohibited the use of animal proteins in all animal feeds with the exception of milk powder and fish meal. The use of the latter was prohibited in ruminant's diets only. Fish oil is mostly used for fish feed, although a minor amount is used for human consumption. The demand for fish oil is high and competing vegetable oils seem to be in shorter supply than initially forecast for 2001, and their prices are expected to move up. As a result, a further increase in fish oil prices is likely.
A small - and declining - amount of the fish produced is used for food aid. In 2000, some 7 600 tonnes were donated which compares to 25 800 tonnes in 1989. Canned fish is the main product, while edible fat reported a dramatic decline in recent years. Norway continues to be the main supplier of fish for food aid, and reported a sharp decline in 1998. Developing countries are practically not tapped as a source of fish for food aid.
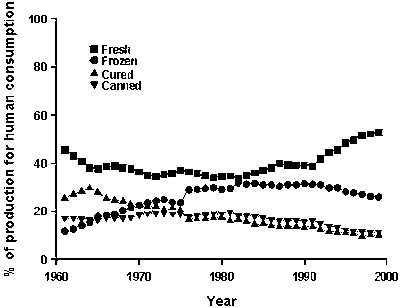
Since 1994, more and more fish has been used for direct human consumption rather than for other purposes (see Figure 2.4). Of the products used for human consumption, fresh fish showed significant growth during the 1990s, and almost 50% of fish used for human consumption is sold fresh (Figure 2.5). This change has been accompanied by a decline in the use of cured and canned fish. Also, the proportion sold as frozen fish is declining. This pattern has largely been driven by growth in consumption.
Fish has a significant capacity for processing and almost two thirds of the catch (in 1998) were used for further processing. A large fraction, approximately 30%, of the fish used for human consumption was frozen, approximately 14% canned and approximately 12% cured. The remaining 45% was sold fresh (Figure 2.5).
|
Figure 2.5 |
|
Different regions of the world have very different eating habits with respect to seafoods. Demersal fish such as cod are much preferred in northern Europe and North America, and cephalopods are consumed in several Mediterranean and Asian countries, but to a much lesser extent in other regions. Despite the fast-growing contribution of aquaculture to production, crustaceans are still high-priced commodities and their consumption is mostly concentrated in affluent economies (FAO, 2000).
References
Dierberg, F.E. & Kiattismkul, W. 1996. Issues, impacts and implications of shrimp aquaculture in Thailand. Environmental Management 20, 649-666.
FAO (Food and Agriculture Organization). 2000. The State of World Fisheries and Aquaculture. FAO, Rome, Italy.
FAO/NACA (Food and Agriculture Organization of the United Nations/Network of Aquaculture Centres in Asia-Pacific). 1995. Regional study and workshop on the environmental assessment and management of aquaculture development (TCP/RAS/2253) NACA Environment and Aquaculture Series No. 1. Network of Aquaculture Centres in Asia-Pacific, Bangkok, Thailand.
![]()
![]()
![]()