![]()
![]()
![]()
One of the basic principles of GIS we must keep always in mind: We join data, stored in a table, with a location on a map, representing a location on Earth.
In the exercises given in the previous chapters, data were already joined to the different Themes used. In this chapter, we explain how to join data in ArcView with locations in Maps or Themes.
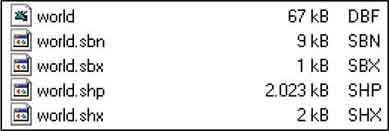
First a short explanation on the different files used by ArcView software. A Theme consists of several files (Figure 8.1), mostly files with the extensions ‘.sbn’, ‘.sbx’, ‘.shp’, ‘.shx’, and ‘.dbf’. If you want to put a Theme on a floppy disk, you have to copy all files to be able to display the Theme on another PC. ArcView shapefiles are a simple, non-topological format for storing the geometric location and attribute information of geographic features. A shapefile is one of the spatial data formats that you can work with in ArcView. The shapefile format defines the geometry and attributes of geographically-referenced features in as many as five files with specific file extensions that should be stored in the same project workspace. They are:
‘.shp’- the file that stores the feature geometry.
‘.shx’- the file that stores the index of the feature geometry.
‘.dbf’ - the dBASE file that stores the attribute information of features. When a shapefile is added as a theme to a view, this file is displayed as a feature table.
‘.sbn’ and ‘.sbx’- the files that store the spatial index of the features. These two files may not exist until you perform theme on theme selection, spatial join, or create an index on a theme’s Shape field. If you have write access to the source data directory, the index files will be persistent and remain after your ArcView session is complete. If you do not have write access to the source data directory, they will be removed when you close the project or exit ArcView.
‘.ain’ and ‘.aih’ - the files that store the attribute index of the active fields in a table or a theme’s attribute table. These two files may not exist until you perform Link on the tables. If you have write access to the source data directory, the index files will be persistent and remain after your ArcView session is complete. If you do not have write access to the source data directory, they will be removed when you close the project or exit ArcView.
FIGURE 8.1
The different files making a shapefile in
ArcView
Now that you know a bit more about the different files that are used in ArcView joining will be discussed: the basic principle of joining is that the data obtained from a certain location is stored in a Table that contains a code number or name of the specific location. When two or more Theme files contain exactly the same code or name it is possible to join the files through this code.
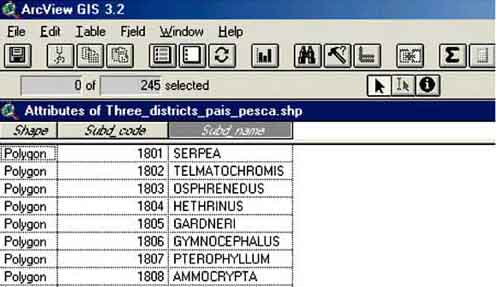
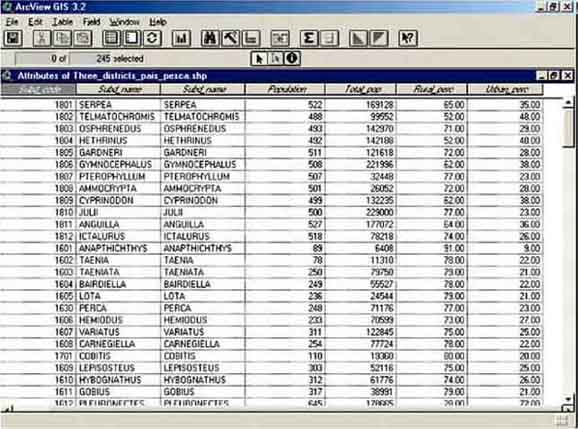
Have a look at the following example; below in Figure 8.2 a table with data of different sub-districts in the Nerad district is presented together with a polygon shapefile of the same sub-districts.
FIGURE 8.2
Data table and map of the sub-districts in
Nerad districts, both indicating
the codes used to join the data with
the location of the sub-district

In the polygon shapefile as well as in the table, you can see the codes (numbers) through which the two were joined. Have a look below on how the two (a table and a polygon file) can be joined in ArcView.
Adding two Themes
Start ArcView, start a New project, and open a New View. Add the Themes ‘Pais pesca country.shp’ and ‘Three districts.shp’ (from the folder ‘05_joining_Table_and_Polygon’).
Viewing the Theme table
The contents of a shapefile or the Theme table can be viewed by either clicking on the Open Theme Table icon or via the menu bar: Theme/Table.

FIGURE 8.3
View contents of a shapefile
table
If we open the Theme table of ‘Pais_pesca_country.shp’ (Table 8.1), we see the following data attached:
TABLE 8.1
Sample data of theme table for
‘Pais_pesca_country.shp’
|
Shape |
Population |
Sqr_km |
Total_pop |
Rural_perc |
Urban_perc |
|
Polygon |
253 |
90 442 |
2 301 1601 |
77 |
23 |
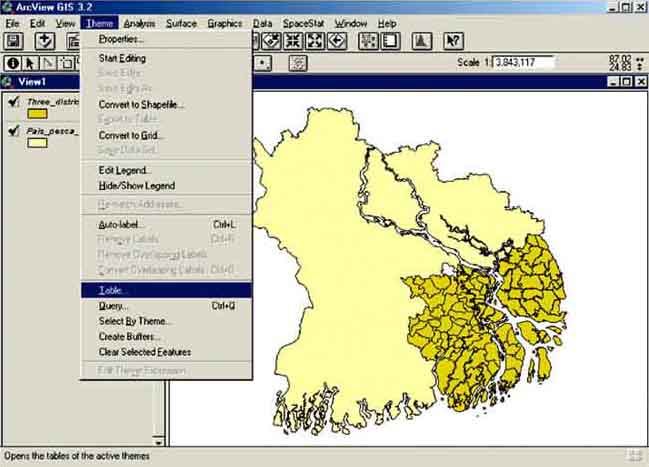
If we open the theme table of the ‘Three_districts_pais_pesca.shp’ Theme we see that the table only contains the fields: ‘Shape’, ‘Subd_code’, and ‘Subd_name’(Figure 8.4).
FIGURE 8.4
The Theme table of
‘Three_districts’ - shapefile with sub-districts codes and
names
Close the table and close the View through ‘x’ or via the menu bar: File/Close All.
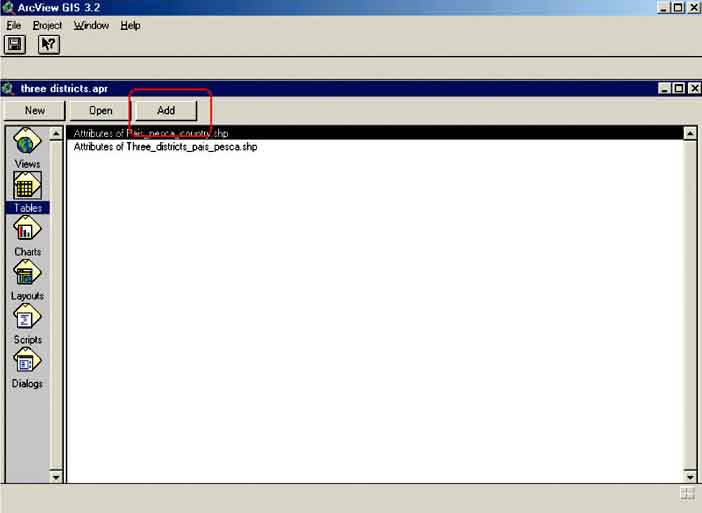
Adding a Table
You are back at the project window of ArcView. Make sure the Tables window is the active window, by clicking the Tables icon in the project window once (Figure 8.5).

FIGURE 8.5
Adding a table in the main menu of
ArcView
To add a Table you click on the Add button on top of the Tables window and the Add Table window will appear (Figure 8.6).
FIGURE 8.6
The Add Table menu
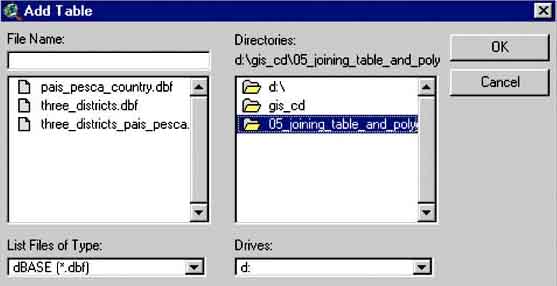
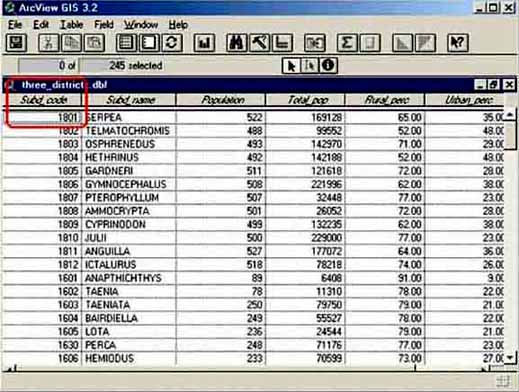
Select in the Drives select box the drive where you have the CD, or where you have copied the files, go to the ‘05_Joining_Table_and_Polygon’ folder, select in ‘List of File Type:’ ‘Dbase files (*.dbf)’, and finally, select in the File Name select box ‘three_districts.dbf’ and Click OK.
The table will be added to the project and will be opened. You will see that the first field heading in the table is ‘Subd_code’(Figure 8.7). With this field you will be able to join both this table and the Theme ‘Three_districts_pais_pesca.shp’, as the Theme has the same number linked to a sub-district in the field: ‘Subd_code’.
FIGURE 8.7
The added table of
‘Three_districts’ with the sub-districts codes and data
Joining the Table with the Theme’s attribute table
You want to join the data from ‘Three_districts.dbf’ with the ‘Attributes of Three_districts_pais_pesca.shp’ table. For this you need to use the sub-district codes that are identical in both files.
Joining a Table with a Theme’s attribute table file is always carried out in the same five steps:
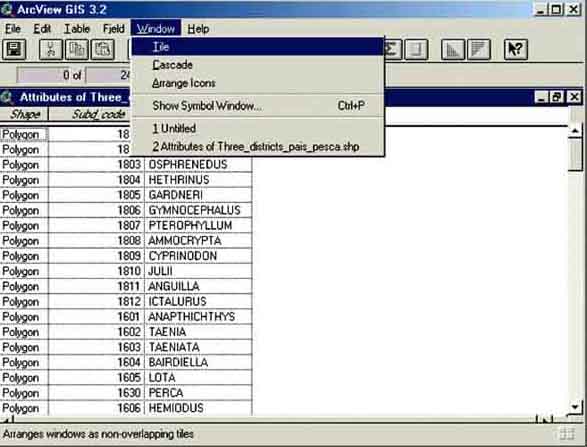
1. Open ‘Attributes of Three_districts_pais_pesca.shp’. Once it is open click on ‘Windows/Tile’ in the menu bar (Figure 8.8). You will see that the project window is nicely placed next to the opened attribute table.
FIGURE 8.8
Tiling your project window
2. Open ‘Three_district.dbf’ and Tile the project window again and the results are that the two tables and the project window are nicely arranged next to each other, and you can start joining the two.
3. Select ‘Subd_code’ by pressing the header with your mouse pointer in the ‘Three_districts.dbf’ table, the table from which you take the data, or the source table. After clicking on ‘Subd_code’, you see that this column header becomes darker than the rest of the headers.
4. Select the header of the field ‘Subd_code’ in the ‘Attributes of Three_districts_pais_pesca.shp’, the table you want to bring the data to, or the destination table. Also here, after clicking on the header, it becomes darker than the rest of the headers.
5. After having selected the two column headers, the Join Table button becomes visible. Click this button and the data from the source table will be joined with the destination table, the source table will disappear.
Maximize the table ‘Attributes of Three_districts_pais-pesca.shp’ and you will see that the data are added (Figure 8.9). When you have done the complete exercise, you can close the project, and exit ArcView.
FIGURE 8.9
Attribute table with the joined
data
Note:
Try to remember the small phrase ‘DATA FIRST’. First click the code in the ‘source table’, the table which contains the data you want to join.
Note:
Sometimes you may think you did everything correctly and the join-icon does not appear. It could be that the joining codes do not have the same format. For example in your table file the code has a ‘text format’, and in the shapefile the code has a ‘numeric format’. Then joining is not possible.
Note:
ArcView can not import a spreadsheet file (be it from Lotus 1-2-3, MS Excel, QuattroPro, etc). If your data are stored in an MS Excel file, you can either run ArcView’s SQL connection to retrieve your data, or you try to save your data as a ‘.dbf’ file which is accessable by ArcView. More detailed information is provided in Annex B, ArcView and Microsoft Excel.
Through a Catch and Effort recording and a habitat oriented fish catch monitoring system the Department of Fisheries of Pais Pesca estimates every year the annual fish catch of each district, the annual catch per fishers (CPUE) and the distribution of the catch over four major groups: Migratory species, Brackishwater species, Prawns, and Others. The results of 2001 are presented in Table 8.2.
TABLE 8.2
Fisheries data Pais Pesca of
2001
|
DIST_CODE |
DIST_NAME |
CATCH (metric tonnes/ year) |
CPUE (metric tonnes/ fishers/year) |
MIGRATORY (metric tonnes/ year) |
PRAWNS (metric tonnes/ year) |
BRACKISH (metric tonnes/ year) |
OTHERS (metric tonnes/ year) |
|
1 |
Denaida |
181 |
0,600 |
18 |
9 |
0 |
154 |
|
2 |
Ganjpani |
25 750 |
0,600 |
3 090 |
1 802 |
0 |
20 858 |
|
3 |
Cankir |
139 943 |
1,080 |
30 787 |
16 793 |
0 |
92 362 |
|
4 |
Kathijalo |
32 201 |
0,600 |
3 542 |
2 576 |
0 |
26 083 |
|
5 |
Dadon |
75 900 |
0,830 |
18 975 |
10 626 |
0 |
46 299 |
|
6 |
Grumara |
252 900 |
0,850 |
20 232 |
37 935 |
0 |
194 733 |
|
7 |
Pepedas |
109 000 |
1,360 |
25 070 |
14 170 |
0 |
69 760 |
|
8 |
Felixsad |
94 300 |
0,790 |
7 544 |
7 544 |
0 |
79 212 |
|
9 |
Bandarbadan |
182 570 |
1,280 |
16 431 |
16 431 |
0 |
149 707 |
|
10 |
Muladi |
45 702 |
0,880 |
914 |
0 |
2 742 |
42 046 |
|
11 |
Siraba |
105 500 |
0,860 |
3 165 |
1 055 |
18 990 |
82 290 |
|
12 |
Faodoa |
130 000 |
0,880 |
2 600 |
2 600 |
27 300 |
97 500 |
|
13 |
Boldan |
93 780 |
0,920 |
3 751 |
938 |
18 756 |
70 335 |
|
14 |
Bargun |
39 470 |
0,790 |
1 184 |
789 |
7 499 |
29 997 |
|
15 |
Puradi |
54 600 |
0,950 |
1 092 |
1 092 |
11 466 |
40 950 |
|
16 |
Nerad |
141 000 |
1,300 |
2 820 |
9 870 |
9 870 |
118 440 |
|
17 |
Goodt |
396 580 |
1,810 |
19 829 |
3 966 |
91 213 |
281 572 |
|
18 |
Tara |
30 200 |
0,660 |
302 |
604 |
0 |
29 294 |
The data are stored in a.dbf file (‘district_catch.dbf’) in the ‘06_Catch_Data_with_Theme’ folder on the CD.
1. Join the data with the ‘District.shp’ Theme (also to be found in the ‘06_Catch_Data_with_Theme’ folder in the CD, you first have to start ArcView, add this Theme, etc., of course).
2. Make a multiple pie chart with ‘Migratory catch’, ‘Prawns’, ‘Brackishwater species’, and ‘Others’ with the pie size related to CPUE. Remember: data first!
3. If you tried to make a multiple pie chart, and you do not see the parameters mentioned before (Migratory catch, Prawns, etc.) in the Legend Editor after having selected ‘Chart’ as the Legend Type, you probably have used the ‘Attributes of district.shp’ as the source table when joining. Start over again, and now joining the two tables the other way around: after tiling both tables (‘Attributes of district.shp’ and ‘district_catch.dbf’), first press the correct field heading of the source table, which in this case is...?[5].
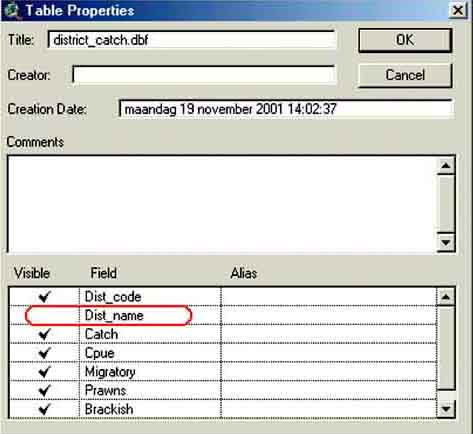
After you have joined the two tables you will see that the District name appears two times in the new attribute table, this is annoying and will become even more annoying if you add more data and the District name appears several times. This can be avoided by deselecting District name in the source table ‘district_catch.dbf’ before executing the join; when the two tables are opened, select the source table and go via the menu bar (Table/Properties) (Figure 8.10) to the Table properties.
FIGURE 8.10
Selecting the Table
Properties

In the Table Properties window uncheck the Field(s) you want to hide and do not want to join (Figure 8.11), after which you click OK and continue with joining as explained before.
FIGURE 8.11
Changing the Table
Properties
Joining two tables does not change the actual tables, i.e. the changes are not permanently stored in the Theme’s attribute table. Once you have saved everything as a project and open this project again, ArcView will make the join again. It also means that if you open the ‘District.shp’ file in another project, the join will not be visible. The join will not be made again if you remove the ‘district_catch.dbf’ file, or place it in another sub-directory. To add the data permanently to the Theme, the easiest way is to convert the Theme (with the new join), to a new Theme:
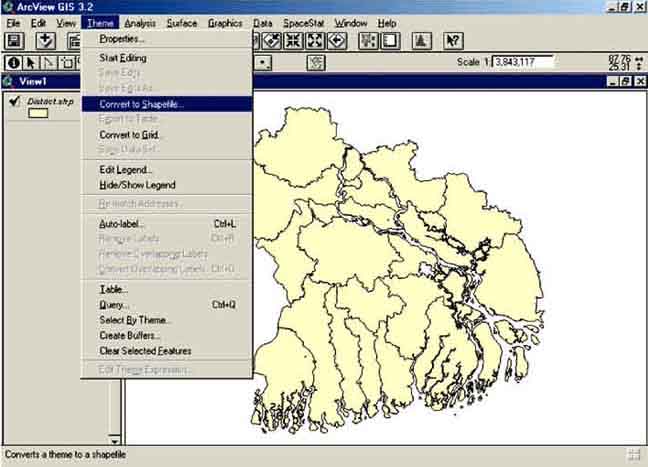
1. After joining the tables, open View again and activate the Theme you want to convert by clicking with the mouse pointer on the legend of the Theme.
2. Select Theme/Convert to Shapefile from the menu bar (Figure 8.12).
FIGURE 8.12
Converting to a shapefile
3. The Convert Theme select box will popup. You need to select the folder where you want to save the new shapefile, give it a new name: ‘Dist_catch’ and click OK.
4. You will get the question ‘Add shapefile as theme to view?’, click Yes. A second option is to save the new table separately in a new.dbf file.
5. Open the Attribute table of the Theme involved.
6. Go to: File/Export in the menu bar, the Export Table select box will pop up, select dBase, click OK.
7. In the new Export Table window select a folder where you want to save the file, give the file a new name, and click OK.
|
[5]
‘district_catch.shp’. |
![]()
![]()
![]()