![]()
![]()
![]()
Map projections are attempts to portray the surface of the earth or a portion of the earth on a flat surface. Some distortions of area, shape, distance and direction always result from this process. Some projections minimize distortions in some of these properties at the expense of maximising errors in others. Some projections are attempts to only moderately distort all of these properties.
Map projections can be generally classified according to the spatial attribute they preserve as shown in Table 12.1.
TABLE 12.1
Types of projections
|
Attribute preserved |
Projection |
Applications |
Examples |
|
Area |
Equal Area |
Many thematic maps use and equal area projection. Maps of the United States commonly use this projection. |
- Albers Equal Area Conic |
|
Shape |
Conformal |
Useful for navigational charts and weather maps. Shape is preserved for small areas, but the shape of a large area such as a continent will be significantly distorted. |
- Lambert Conformal Conic |
|
Distance |
Equidistant |
No projection can preserve distances from all points to all other points. Instead distance can be held true from one point (or a few points) to all other points or along all meridians or parallels. If you will be using your map to find features that are within a certain distance of other features, you should use an equidistant map projection. |
- Equidistant Conic |
|
Direction |
Azimuthal |
Projections preserve direction from one point to all other points. This quality can be combined with equal area, conformal, and equidistant projections. |
- Lambert Equal Area Azimuthal |
Other projections minimize overall distortion but do not preserve any of the four spatial properties of area, shape, distance and direction. The Robinson projection for example, is neither an equal area nor conformal, but is aesthetically pleasing and useful for general mapping. ArcView supports a large set of standard projections with pre-defined projection parameters.
Map projections are designed for specific purposes. One map projection might be used for largescale data in a limited area while another is used for a smallscale map of the world.
Here are a few things to consider when choosing a map projection:
What spatial properties do you want to preserve?
Where is the area you are mapping? Is your data in a polar or an equatorial region?
What shape is the area you are mapping? Is it square? Is it wider east-west direction?
How big is the area you are mapping? On largescale maps, such as street maps distortions may be negligible because your map covers only a small part of the earth’s surface. On small scale maps where a small distance on the map represents a considerable distance on the earth, distortion may have a bigger impact, especially if you use your map to compare or measure shape, area, or distance.
Answering these questions will determine what map projection and, thus, what projection coordinate system you will want to use to display your data. Your choice of projection will not be critical if your map covers a small area.
Map projection affecting distance
To demonstrate how projections can distort distance, you will measure the distance between two African cities (Tunis, Tunisia, and Cape Town, South Africa) using a map projection.
Geographic coordinate system
1. Open ArcView, Open a new project, and Open a new view.
2. Add the Themes ‘worldmap.shp’[6] and ‘world_cities.shp’ from the ‘10_Projection’ folder. Check the checkboxes of the Themes (so that the Themes become visible). If necessary, move the ‘World_cities.shp’ Theme above the ‘Worldmap.shp’ Theme.
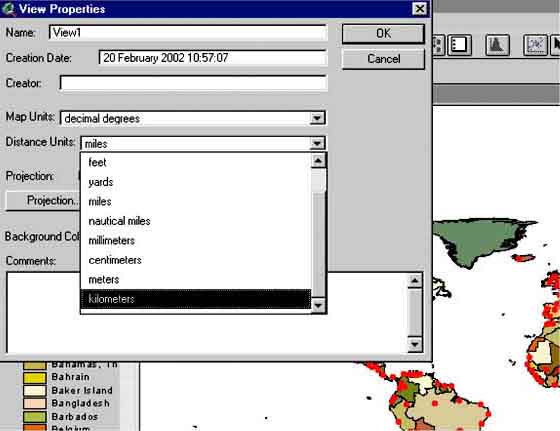
3. Go to: View/Properties...via the menu bar, click Projection and you will see that the projection is ‘Geographic’. Click OK, and select kilometres in ‘Distance Units’(found at the bottom of the list) (Figure 12.1), click OK.
FIGURE 12.1
Distance units for the View projection
4. Click the zoom in button.
5. Click and drag a box around Africa.
6. Make the ‘World_cities’ Theme active, by clicking on it.
7. Via the menu bar, go to Theme/Auto-label....
8. Leave the default settings as they are and click OK. If the legend fonts are too big you can reduce the font size in the Legend Editor (menu bar: Theme/Edit Legend..., double click on the symbol [here a blue dot], a palette screen pops up, select the font palette by clicking on the button with A, B, C, change the size, click apply, close all screens, remove the labels [Theme/Remove Labels], and autolabel again [Theme/Auto-label]).
The city labels are added to the display. Tunis is near the top of the display in Tunisia, and Cape Town is near the bottom in South Africa. If you cannot see both cities, zoom out or adjust the display so that they are both visible.
9. Click the measure button.
10. Click first Tunis then double-click Cape Town to measure the distance between the two cities. (Figure 12.2).
FIGURE 12.2
The distance between Tunis and Cape
Town
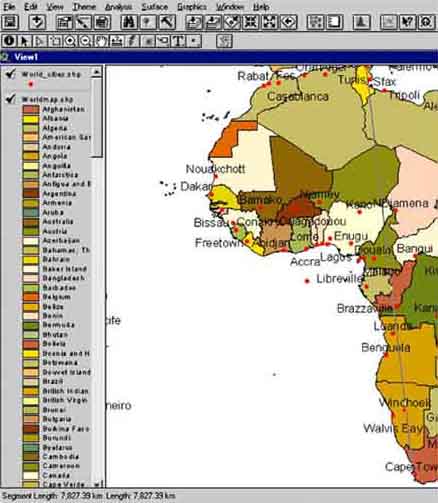
The distance displays on the bottom left-hand side of the status bar. Your result should be around 8 000 kilometres (i.e. distance may be slightly different).
Now change the projection and measure distance again:
Behrmann equal area cylindrical
11. Select again View then Properties via the menu bar, click Projection and select ‘Behrmann’ in the Type: selection box, and click OK.
12. Remeasure the distance between Tunis and Cape Town.
The new distance should be around 8 500 km, a difference of 500 km!
Behrmann projection is suitable for world mapping. Shape distortion is minimized near the standard parallels. Shapes are distorted north-south between the standard parallels and distorted east-west above 30°N and below 30°S. Area is maintained and direction is generally distorted except along the equator.
Map projection affecting shape
In this exercise you will clearly see (Figure 12.3) how shapes change when the projection changes. Circular shapes make it easy to see the distortions so we have included a layer with smiling faces that you will project along with the Worldmap shapefile.
Geographic coordinate system
13. Uncheck the ‘World_cities’ Theme to turn it off.
14. Click the Zoom to Full Extent button to view the complete View of the world, or go to View/Full Extent via the menu bar.
15. Select View then Properties in the menu bar, click Projection and select Geographic click OK.
16. Add the Theme ‘Circles.shp’ from the same folder (‘10_Projection’).
17. Check the ‘Worldmap.shp’ and ‘Circles.shp’ Themes (to make them visible).
FIGURE 12.3
The worldmap with circle
faces
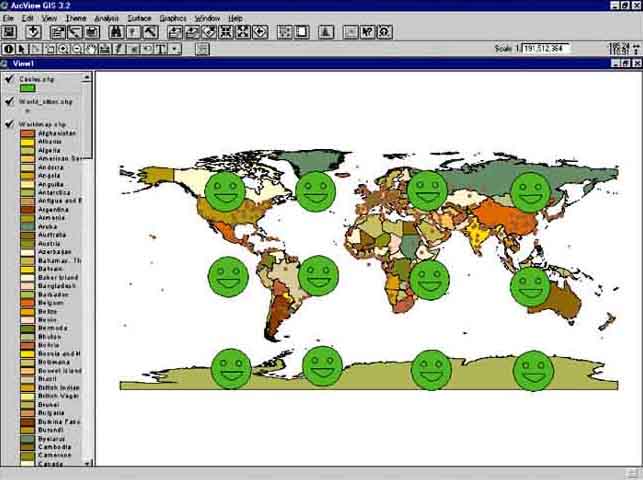
The geographic coordinate system is not a map projection so the circles are not distorted. Now change projections and examine the distortion of the circles.
Mercator
18. Select View then Properties in the menu bar, click Projection and select ‘Mercator’ then click OK.
Notice that small shapes are well represented. Area is increasingly distorted toward the Polar Regions. For example, Greenland is only one-eighth the size of South America but it appears to be much larger. The best use of this projection applies to regions near the equator such as Indonesia and the Pacific Ocean.
Try a couple of more projections to see how they distort the shapes of the faces. You can also try measuring distances to see if shape and distance are distorted in the same projection.
Map projection affecting area
Map projection changes by selecting the desired projection from the ‘View’ properties option above are useful for visualising spatial distortions for distance and shape. However, for ‘area’ estimates calculations need to be made as described below.
Geographic coordinate system
19. Select View then Properties in the menu bar, click Projection and select ‘Geographic’ click OK.
20. Check the ‘Worldmap.shp’ Theme to display the map, and click on the Theme legend to make it active.
21. On the Button bar click on the Open Theme Table button (or go via the menu bar to: Theme/Table...).
22. Select Table/Start Editing via the menu bar.
23. Select Edit/Add Field....
24. Name this new Field ‘Area’.
25. Number of decimal places 2, click OK.
26. Click on Calculate button, or go via the menu bar to: Field/Calculate....
27. Select [shape] by double clicking on it.
28. Type ‘.returnarea’ in the box at the bottom, so that the full taxt in the box looks like: ‘[shape].returnarea’.
29. Click OK. You will see the new field ‘Area’ filled with numbers.
30. Click on ‘Cntry_name’ and then click on Sort ascending button.
31. Look at the ‘Cntry_name’ column and then at the corresponding values in the new ‘Area’ column created. You will see that all these area values are all degree values. For example, look at Afghanistan, the corresponding values in degrees is 62.57.
In a geographic projection areas are calculated using map units, not distance units, so area values really reflect how many square ‘degrees’ there are. Degrees do not measure ground distance at all, but rather a fraction of a circle. Degrees of longitude/latitude are not consistent units of measure for area, shape, distance and direction.
Stop editing by going to Table/Stop Editing in the menu bar. When you are asked if you want to ‘Save Edits?’ click Yes.
Close the Table.
Now change the projection.
Equal-Area Cylindrical
32. Select in the menu bar File and then Extensions... and check ‘Projector!’.
If you can not find ‘Projector!’ in the extensions list (‘Projector!’ is not the same as ‘Projection Utility Wizard’), you have to do the following to get it in the extensions list: Open Windows Explorer, goto the folder where ArcView is installed (for instance C:\ESRI), Goto the folder ESRI\AV_GIS30\ARCVIEW\. In this folder two subfolders are important for what we are about to do, namely \EXT32 and \Samples. The \Samples folder holds many extensions of which Projector! is one. Open the Samples folder and open its subfolder \ext (so the path will look something like: ...\ESRI\AV_GIS30\ARCVIEW\Samples\ext). Look in this folder for the file ‘prjctr.avx’. Copy this file and paste it in the \EXT32 folder (the path looks something like:...\ESRI\AV_GIS30\ARCVIEW\EXT32). Now try again to find ‘Projector!’ in the extensions list, and check it (File/Extensions...).
33. Make sure you have ‘Worldmap.shp’ still active, and that the distance units are kilometres (View/Properties...)
34. Click on the ‘Projector!’ button.
35. Select ‘kilometers’[7] from output units and then click OK.
36. In projection properties under ‘Type’ choose ‘Equal-Area Cylindrical’ projection then click OK.
37. You will get a popup with the question: ‘Recalculate area, perimeter and length fields (if present) using kilometres? Click Yes to do this.
38. Then a pop-up will ask: ‘Add projected shapefile(s) as theme(s) to a view? Again you click Yes.
39. In the Projector! window select <New View> and click OK. You will now be asked to save the file. Think of a proper name, and save the file on a location where you will be able to find it.
40. The new View will appear, check the new file/Theme for display and have a look (you even can change the display, so that you will see the same view as the one you have projected). Click the Theme, so that it is active.
41. On the Button bar click on the Open Theme table button, or via the menu bar: Theme/Table....
42. Click on ‘Cntry_name’ and then click on ‘Sort ascending’ button.
43. Now compare the ‘Cntry_name’ with ‘Area’ column, you will see that the degree values in area column are now the real surface area values. If you look at Afghanistan this time the surface area value is now 642 115.94 km2.
When spatial data in your view is in decimal degrees, you can decide whether or not you want to choose a map projection. If your application doesn’t require a high level of locational accuracy, if you will not be performing queries based on location, distance and area, or if you just want to make a quick map you do not need to choose a map projection.
Notes:
When data is projected, most of the time ArcView stores this projection information in the file with the same name as the Theme, with the extension ‘.prj’. This file can be read with for instance the notepad program of Microsoft.
Detailed information about each projection available in ArcView can be found in the on-line help. The help topic for each projection tells you what type of projection it is and how well it preserves area, shape, distance and direction.
By customizing a projection, you can tailor a projection’s parameters to suit your needs. To learn more about the various projection parameters, use ArcView on-line help.
|
[6] 1994. [7] The spelling for metres, kilometres, etc. will be metres, kilometres, etc. where the software is displaying the words as such. |
![]()
![]()
![]()