![]()
![]()
![]()
4.1 Development of the Kapenta fishery
From a pre-impoundment study, Jackson (1961) predicted that the pelagic habitat of Lake Kariba would remain non-colonized since the species present in the Zambezi river had evolved in a riverine habitat and would therefore only inhabit the shallow littoral zones. Coke (1968) and Mitchell (1978) later confirmed this. Following Jackson’s recommendation Kapenta, Limnothrissa miodon, (a small pelagic clupeid, which in Kariba reaches a size of around five centimetres) was introduced by the Zambian government into Lake Kariba between 1967 and 1969 from Lake Tanganyika (Bell-Cross and Bell-Cross; 1971, Junor and Begg, 1971). The introduction was a success and, although the colonial Rhodesian Government was not informed about the introduction, the researchers at the Lake Kariba Fisheries Institute observed the widespread presence already in 1969. Commercial Kapenta fishing, or the offshore fishery, began in July 1973 in Zimbabwe with a single purse-seiner. But effort grew rapidly (Figure 3) and from 1976 this fishery changed to using lift nets from pontoons at night with light attraction, which considerably increased the catch rates. From 1978 the fishery started to expand along the Zimbabwean shoreline to six different bases, and in 1981, after the termination of the civil war in Zimbabwe, this fishery started in Zambia (Overå, 2003). The predominantly white-owned, capital intensive Kapenta fishery has now developed into a million dollar industry, with between 20 and 30 000 t landed annually, economically vastly outstripping the inshore fishery, and with theoretical potential for further expansions (Anon., 1992; Machena, Kolding and Sanyanga, 1993; Marshall, 1992, 1993; Kolding, 1994). The Kapenta fishery alone, through its profitability, is according to Bourdillon, Cheater and Murphree (1985) directly responsible for most of the infrastructural development that has occurred on the Zimbabwean shoreline. Cheater (1985) gives a detailed account of the development of this fishery in Zimbabwe until the mid 1980s. From the early 1990s no new licenses were issued in Zimbabwe and the effort development seemed also to stabilize in Zambia around this time (Figure 3) with a corresponding stabilization in catch rates of 150-200 kg per rig per night in both countries. From 1998 there has been a decrease in the reported Zimbabwean effort.
FIGURE 3. Development in the offshore Kapenta fishery in Zimbabwe (1974-2000) and Zambia (1982-2000). CPUE in tonnes/boat night. Note effort values have been multiplied by 0.1 for scaling reasons. Source: Zambia-Zimbabwe Fisheries Joint Annual Statistical reports.
4.2 Development in inshore fisheries
Commercial gillnet fishing started on the Zambian shore in 1958 immediately after the impoundment had begun, and from 1962 on the Zimbabwean side because the authorities wanted the filling and stocking complete before a fishery was initiated (Minshull, 1973; Bourdillon, Cheater and Murphree, 1985). Initially, the catches were very high due to the eutrophic state of the lake from the fresh inundation and the rapid colonization of opportunistic riverine detritus feeding species such as mudfish (labeo’s) and distichodontids. In 1962 the catches started to decline in Zambia, followed by Zimbabwe four years later (Minshull, 1973). This initial boom and bust of the catches was reflected in the fishing effort. By 1962 about 2,500 fishers were operating on the Zambian side producing around 3 000 tonnes of fish, whereas by 1967 the number of fishers had decreased to less than 500 (Scudder, 1967; Jul-Larsen, 2003; Overå, 2003), (Figure 6). Similarly, on the Zimbabwean side the number of fishers peaked at just over 1 000 in 1966, subsequently declining to less than 500 in 1971 (Minshull, 1973) (Figure 4).
The number of fishers in Zimbabwe increased again during the 1980s with a subsequent decline during the 1990s to same low level as the 1970s (Figure 4). The number of nets per fisher in Zimbabwe, however, has remained relatively stable around an average value of 4+1.5 SD (Figure 4) with no significant development over time.
The overall decline in effort since the early 1990s (Figure 4) has taken place in all fishing areas, with the exception of fishing area C4 (Songore, 2000). For the fishing areas C1 and C3, which were once operated by white concessionaires, the effort has declined most, almost linearly since 1973. This can be attributed to a gradual exodus from fishing due to declining returns on investment (Marshall, 1984). Catch per unit of effort, however, has generally increased in all the fishing areas (Songore, 2000) also reflected by the overall rate (Figure 5).
FIGURE 4. Estimated total annual effort (numbers of fishers and nets) and reported annual yield (tonnes) from the Zimbabwean inshore fishery between 1962 to 1999. Source: Songore (2000).
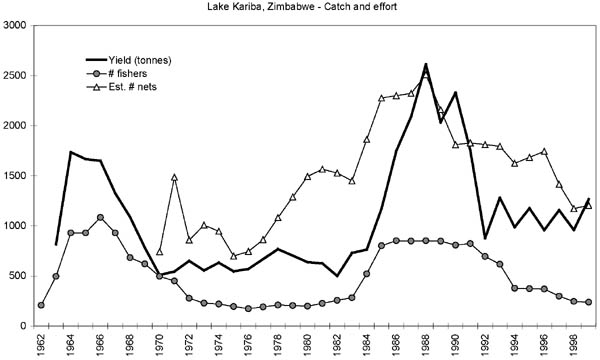
FIGURE 5. Development in catch rates (kg/45 m net) of the Zinbabwean inshore fishery. Straight lines are linear regression on the experimental catch rates and the artisanal catch rates (kg/net) between 1980 and 1999. The trends (slopes) are not statistically significantly different from 0 (Experimental: Slope = 0.02, SE = 0.06; Artisanal: Slope = 0.02, SE = 0.01), but indicate a slight increase over time. The artisanal catch rates are on average one third of the experimental.
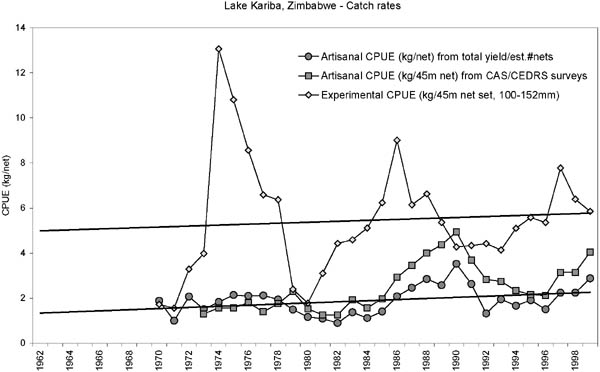
Both the artisanal and experimental catch rates in the Zimbawean inshore fishery show the same overall trend since 1970 (Figure 5). Since the Lakeside station is in an unfished area, this indicates that the overall development in the inshore biomass appears to be independent of the change in fishing effort. It also indicates that the efficiency of the fishers (catchability coefficient) has not changed much over time which does not sustain the general notion that the fishers are increasingly under-reporting the number of nets used (e.g. Sanyanga, Lupikisha and Thorsteinson, 1991). Mean annual fishing effort (Figure 4) consistently has been operating below the maximum legal limit of 2 530 nets. This may be due to fishers being unable to secure fishing gear or some fishers being passive, keeping their licenses so as to utilize them in times of hardships. Fishers have always indicated that it is very difficult to acquire fishing gear (Songore, 2000). The average catch rates in the fished areas, however, are generally only one third of the experimental catch rates: this difference could be attributed to fishing.
The number of fishers in Zambia increased from around 1 000 during the 1980s reaching almost the level from the heyday in 1962, but has subsequently declined to around 1 200 fishers in the latest frame survey in 1999 (Figure 6).[16] The fluctuations in the number of Zambian fishers largely follows those in Zimbabwe (Figure 4) although initially the latter had a four year time lag due to a later start of the fishery. Since 1980 the ratio between the Zimbabwean and Zambian number of fishers has been remarkably stable with a mean of 0.3 ± 0.1 SD. The average number of nets per fisherman in Zambia, however, has almost linearly increased during the whole period from around two in the early 1960s to around ten in the late 1990s (Figure 6). This means that the actual effort, although fluctuating in concert with the numbers of fishers, has increased much more rapidly and is today almost five times higher than at beginning of the fishery.
FIGURE 6. Estimated effort development in the Zambia inshore fisheries. Number of nets are calculated from nets/fisherA #fishers. Straight line is a linear regression on the nets/fishers. Sources: Number of fishers: 1959-61 from Scudder (1967); 1962-89 from Scholz (1993); 1990, 1993, 1995, 1999 from Frame Surveys; 1981, 1991-92, 1994-95, 1996-98 interpolated. Nets per fisherman: 1961-89 from Scholz (1993); 1990, 1993, 1995, 1999 from Frame Surveys; 1996, 1999 from Jul-Larsen (2003); 1981, 1991-92, 1994, 1997 interpolated.
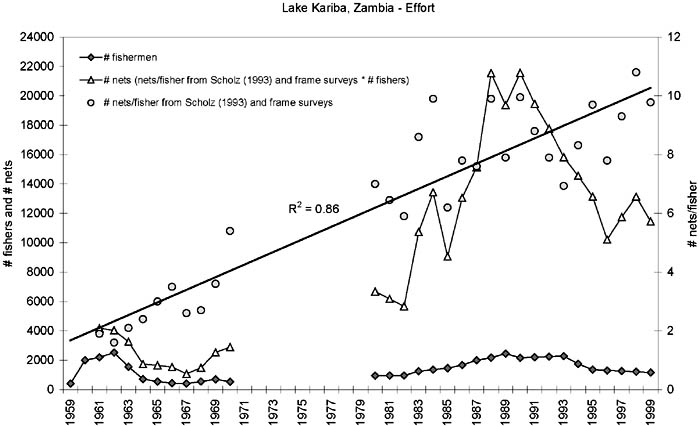
Between 1980 and 1999 the reported yield from the Department of Fisheries statistics (Figure 7) is almost identical (only 1.4 times higher) to the estimated yield on the Zimbabwean side (Figure 4) despite the much higher effort in Zambia - on average three times more fishers and eight times more nets - and with approximately the same catch rates from 1980 onwards according to the CAS/CEDRS statistics (Figures 5 and 8).
FIGURE 7. Estimated yield in the Zambia inshore fisheries from various sources and from this study (1980-1999, solid circles and four year moving average).
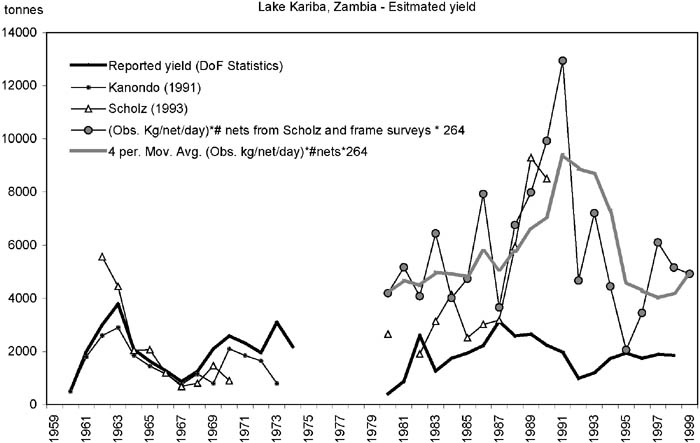
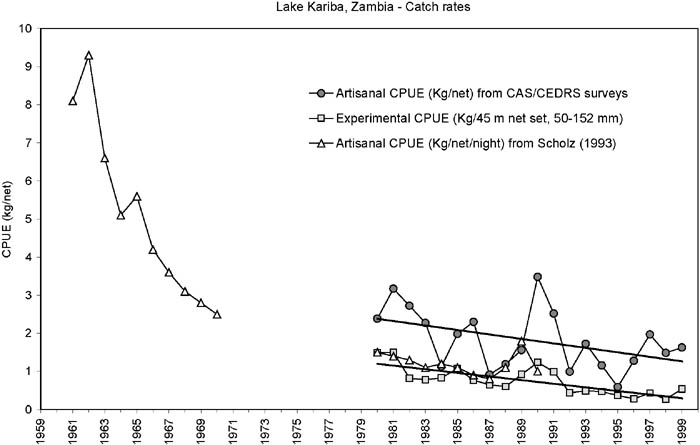
FIGURE 8. Development in catch rates (kg/45 m net) of the Zambian inshore fishery. Straight lines are linear regression on the experimental catch rates and the artisanal catch rates (from CAS/CEDRS surveys) between 1980 and 1999. The trends (slopes) are not statistically significantly different ((Experimental: Slope = -0.05, SE = 0.01; Artisanal: Slope = -0.06, SE = 0.03), but the artisanal catch rates are on average 2.5 times higher than the experimental.
These data strongly suggests that the reported Zambian yield is seriously underestimated, as was concluded by Scholz (1993) and Scholz, Mudenda and Moller (1997) as well. By using Scholz’s (1993) figures of average active fishing days per fisher of 264 per year times the observed catch per net per day from CAS/CEDRS (Musando, 2000), and the estimated number of nets, a re-calculated estimate of the annual yields in the Zambian inshore fishery has been made (Figure 7). For the period 1980-1999 these recalculated yield estimates are on average three times higher than the reported yield.
After the initial boom in the Zambian fishery a strong decrease in the catch rates between 1962 and 1970 occurred (Figure 8). From 1980 to 1999 the trend continued to decline, although at a much lower rate. The experimental and artisanal catch rates follow the same trend, but in contrast to the Zimbabwean side, the enumerated artisanal catch rates are on average 2.5 times higher than the experimental (Sinazongwe area) for the same range of mesh sizes. This difference could be attributed to the different experience and ways of setting the nets between fishers and research personnel. A similar much lower catch rate of the research personnel compared with the full-time fishers was observed in Bangweulu (Kolding, Ticheler and Chanda, 1996, 2003).
4.3 Seasonal and geographical differences
Catch rates in winter (May-October) are significantly lower than in summer (November-April), both in the experimental and artisanal fisheries. Furthermore, the mean monthly catch rates is strongly correlated with the mean monthly rainfall (r = 0.92). (Figure 9).
FIGURE 9. The negative relationship between A: mean monthly effort (number of nets) and mean monthly catch rates (kg/45 m net), and B: mean monthly effort (number of nets) and mean monthly rainfall (mm) in the Zimbabwean inshore fishery
Effort for the whole Zimbabwean side of the lake fluctuates during the year with low values in January, a stabilization during April to July and a rise to a peak in August after which it starts declining until December. Catch rates display a negative relation with effort (Figure 9A). This pattern can be interpreted in two ways. The first explanation is that the fishers increase their effort during the cold season when catch per unit of effort decreases. However, the alternative explanation is that the overall effort is low during the warm agricultural season which starts in October when land preparation and planting starts and extends to April when harvesting is completed. The second argument supports the “two home condition” (Songore, Moyo and Mugwagwa, 2000) of the fishers, characteristic for the inshore Zimbabwean fishery where permanent settlement and shoreline agriculture is prohibited. The “two home condition” and seasonally fluctuating effort clearly indicates that the original intentions of making the Zimbabwean inshore fishers “professionals” has never succeeded and that fishing is for many only one of several activities.
FIGURE 10. A: Mean annual effort (km net) with 2A SE error bars, and B: mean annual catch per unit effort (kg/45 m net) by major families in fishing areas C1..C7 in the Zimbabean inshore fishery for the period 1980 to 1999.
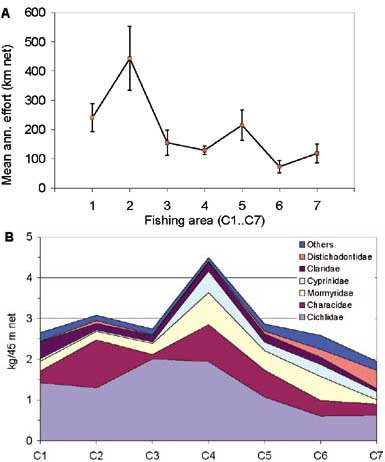
The mean annual effort and the mean annual catch rates are not uniform along the east-west gradient of the lake (Figure 10). Fishing area C2 between the Gachegache and Sanyati rivers has in general had the highest average effort, but also the highest variation. Otherwise there is a general decline in effort from the lacustrine eastern basin to the more riverine west of the lake. However, the average catch rates in each fishing area (Figure 10B) shows no apparent relation with the overall effort. This indicates that the effort distribution is more a result of vicinity to markets and the better infrastructure in Basin 5, and that catch rates and effort are largely independent. The catch composition, however, reflects the natural gradient in the lake ecosystem where cichlids are dominant in Basins 4 and 5 whereas large cyprinids and distichodontids become increasingly important towards Basin 1 concomitant with overall lower catch rates. The characids, dominated by tigerfish (Hydrocynus vittatus) are more uniformly distributed, but with higher catch rates in fishing areas associated with larger tributaries into the lake, such as the Sanyati river (C2) and the Bumi river (C4).
4.4 Changes in fishing pattern and species composition
FIGURE 11. Changes in recorded mesh size distribution in the Zambian inshore fishery. A: relative distribution of mesh sizes from 1980 to 1999, and B: average mesh size from 1961 to 1999. 1961-1970 data from Scholz (1993), 1980-1999 data from Musando (2000).
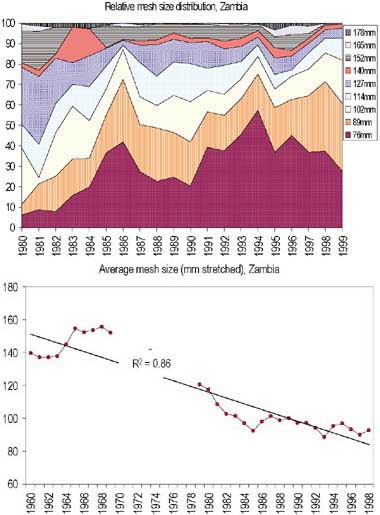
During the first decade of the Zambian fishery the average mesh-size ranged between 140-152 mm (Scholz, 1993, Figure 11). From 1980, when monitoring resumed, to 1999 the average mesh-size in the inshore fishery decreased from 120 mm to 90 mm (Figure 11). In addition to a significant decrease in the mesh sizes used, the Zambian inshore fishers are reported to extensively use fish driving techniques (Kutumpula) to catch bream (Scholz, 1993; Malasha, 2003). In Zimbabwe most fishers initially used 150-175 mm mesh until around 1970. As the catches of the large migrating fish (labeo’s and distochodontids), remnants from the first inundation period, decreased, the use of smaller mesh sizes increased gradually and by 1978 about 60 percent of the nets were in the range 112-125 mm (Marshall, Junor and Langerman, 1982). In the frame surveys of 1993, 1998 and 2000, the average mesh sizes were 128, 115 and 118 mm respectively (Songore, 2000). In general there has been no significant changes in the fishing pattern of inshore Zimbabwean fishery since the 1970s.
In the inshore fishery about ten species make up more than 90 percent of the catches and of these only three (the cichlids Oreochromis mortimeri and Tilapia rendalli and the characid tigerfish Hydrocynus vittatus) contribute more than 50 percent (Figure 12).
FIGURE 12. Relative catch composition (% weight) in the inshore fishery between 1980 to 1999 by major families in Zambia and Zimbabwe based on CAS/CEDRS. Sources: Musando (2000) and Songore (2000).
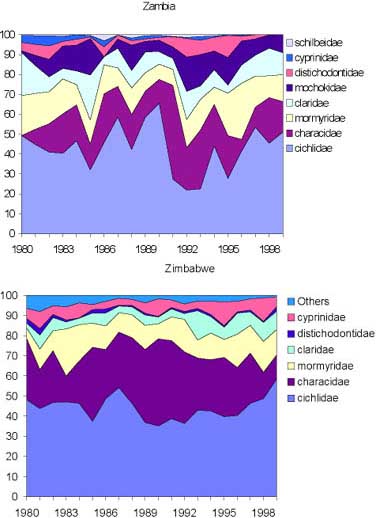
The changing fishing pattern on the Zambian side is not reflected in the overall species composition of the catches, neither are there any major differences in the overall catch composition between the two countries, which are both dominated by cichlids (Figure 12). In the Zambian inshore fishery relatively less tigerfish and more distichodontids are caught compared to the Zimbabwean side. This difference, however, can be explained from the distribution of the fishers where the majority on the Zambian side is in the western part of the lake, while in Zimbabwe the majority is in the eastern part. For both countries the relative species composition has changed remarkably little since 1980.
A comparison of mean weights and catch rates of the commercially important fish species from two fished areas and the non-fished Lakeside experimental fishing area (Table 1) showed no systematic differences although the overall experimental catch rates are about three times higher than the overall artisanal catch rates (Figure 8).
TABLE 1. Comparison between mean weight (grams) and mean CPUE (kg/45 m net) for the most important species in the Zimbabwean fishing areas C2 and C4 and the experimental fishing station at lakeside (= LS, mesh sizes 102 to 173 mm) for the period 1980 to 1999. C2 and C4 were chosen because they represent the areas with high and moderate fishing intensity, and because they are the fishing areas enumerated by the same LKFRI staff that is conducting the experimental fishing at lakeside. Below each variable are given the other sites only if these are significantly different at p<0.05).
|
SPECIES |
C2 |
C4 |
LAKESIDE (LS) |
|||
|
Mean Weight |
CPUE |
Mean Weight | |
CPUE |
Mean Weight |
CPUE |
|
|
Hydrocynus vittatus |
1460 |
0.95 |
1284 |
0.37 |
993 |
0.36 |
|
Oreochromis mortimeri |
640 |
0.36 |
532 |
0.33 |
620 |
0.50 |
|
Serranochromis codringtoni |
419 |
0.05 |
384 |
0.10 |
471 |
1.40 |
|
Tilapia rendalli |
543 |
0.18 |
533 |
0.27 |
537 |
0.14 |
|
Clarius gariepinus |
956 |
0.09 |
1129 |
0.05 |
1190 |
0.46 |
|
Momyrus longirostris |
1801 |
0.09 |
1474 |
0.23 |
1756 |
1.31 |
For two of the species (H. vittatus and T. rendalli) the catch rates were actually higher in the fished areas than in the non-fished area and for tigerfish also the mean weight was higher in the fished areas. For tigerfish the higher catch rates and mean weights can be explained by location of fishing area C2 and C4 in vicinity to larger tributaries where this species migrate upstream to spawn. For the redbreast tilapia (T. rendalli) the higher catch rates could be explained from the use of fish driving as this species is notorious for evading stationary gillnets (Kenmuir, 1984; Karenge and Kolding, 1995a). However, the overall non-systematic difference between the fished and the non-fished areas do not indicate that the observed differences are due to fishing.
4.5 Development in the experimental fishing nets
The development of catch rates in the experimental fishing nets on the Zimbabwean side (the unfished Lakeside station) and the Zambian side (Sinazongwe area) show clear differences (Figure 13). In 1980 when the Zambian fishery reopened after the closure due to the war, catch rates on the two sides were almost similar. After this first year, however, the two time series rapidly separated with an increasing trend at Lakeside and a decreasing trend in Zambia. The trends in the two countries are similar to the trends in the inshore fisheries respectively (Figures 5 and 8). However, the average experimental catch rate in Zambia is about seven times lower compared to Lakeside from the mid 1980s.
FIGURE 13. Mean catch rates (kg/set) in the experimental fishery (mesh size range 52-152 mm) on the Zimbawean and the Zambian side of Lake Kariba. 95 percent confidence intervals are indicated for 1980 when the Zambian inshore fishery reopened and the trend lines (both significantly different from 0) represent the period 1980 to 1999.
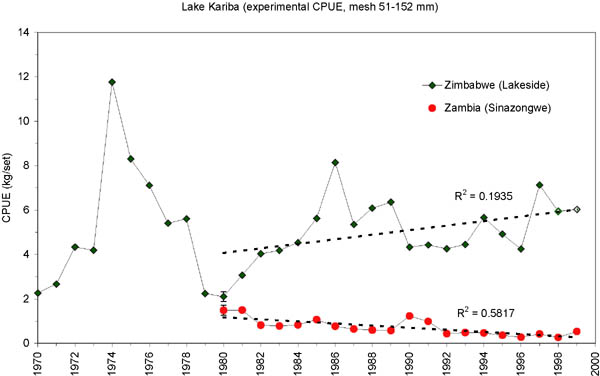
FIGURE 14. Development in the mean weight of individual fish in the experimental gillnets on the Zimbawean and the Zambian side of Lake Kariba. The trend line for Zimbabwe (1970-1999) is significantly different from 0, whereas the trend line for Zambia (1980-1994) is not significantly different from 0.
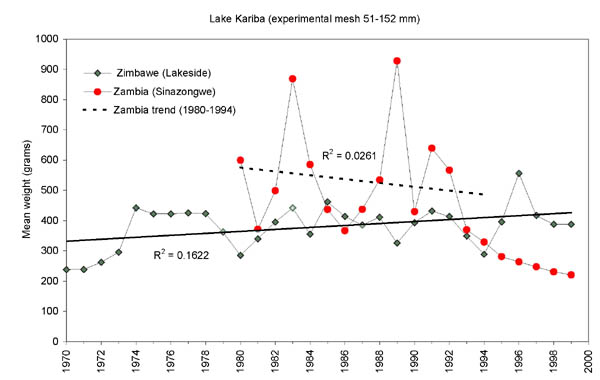
Although the development in the mean weights of the experimental catches (Figure 14) show the same trends as catch rates (increasing in Zimbabwe and decreasing in Zambia), the actual values were higher in Zambia until 1994 when the sampling areas were limited to around the Zongwe estuary (Figure 1). The higher mean weight in the Zambian experimental gillnets can be attributed to the much higher proportion of tigerfish and distichodontids than the Lakeside data dominated by cichlids. Similarly the strong decrease in the Zambian mean weight after 1994 is due to the predominance of squeakers (Synodontis zambezensis) in the Zongwe esturay (Figure 15) which means that the experimental gillnet data series in Zambia is not mutually representative before and after 1994.
4.6 Catch composition and species changes in the experimental gillnets.
Most of the published research on the changes and development of the fish populations in Lake Kariba has been from the Zimbabwean side of the lake (Donelly, 1970, 1971; Kenmuir, 1984; Marshall, 1984; Jackson, 1986; Karenge, 1992; Karenge and Kolding, 1995a, 1995b; Sanyanga, 1996). Comparatively little has been published from the Zambian side of the lake, particularly since the study of Balon and Coche (1974). Recently, however, Scholz (1993) and Musando (1996) did analyses on the long-term development of the inshore fish populations in the Zambian waters of the lake.
In contrast to the artisanal catch compositions which show a remarkable stability in the species composition and are dominated by cichlids on both sides of the lake (Figure 12), the relative species composition in the experimental gillnets show a systematic successive development over time (Figure 15). This would indicate that the experimental catches are not representative of the fishery, and that the selectivity (or fishing pattern) is not comparable although gillnets are the main fishing gears used. The Bangweulu case study (Kolding, Ticheler and Chanda, 1996, 2003) also showed that the experimental catches were not representative for the fishery, mainly due to different methods, and even for the same methods (gillnets) different ways of setting the nets. The divergence between the observed succession in the experimental nets and the catch composition in the fishery strongly indicates that the fishers are not passively harvesting the resources, but actively use the different methods and experience available to select and target particular species. In Zambia, for example, the high prevalence of cichlids in the artisanal catches, in contrast to the dominance of tigerfish in the experimental nets (Figure 15), and the large proportion of Tilapia rendalli on the Zimbabwean side, both supports the notion of a widespread use of fish driving (Kutumpula) as also observed by Scholz (1993) and Malasha (2003).
Most of the observed changes in relative species composition of the experimental catches can be attributed to the natural species succession that Lake Kariba has undergone since its creation as a new pristine environment (Karenge, 1992; Karenge and Kolding, 1995a; Musando, 1996). Shortly after filling, the large potamodromuos cyprinids Labeo congoro, and L. altivelis, and characins Distichodus shenga and D. mossambicus, were abundant in the lake and sustained for a large part the initial boom in the inshore fishery. After a few years they declined, particularly in Basins 3-5, and cichlids gradually became more important (Marshall, Junor and Langerman, 1982).
FIGURE 15. Relative species changes in the experimental surveys represented by Index of Relative Importance (Karenge and Kolding, 1995a). Above Zambia from the Sinazongwe area (Basin 3) and below Zimbabwe from the Lakeside experimental station (Basin 5). From 1994 sampling stations in Zambia were reduced to only cover the Zongwe estuary which are not fully representative for the main lake (see also Figure 16).
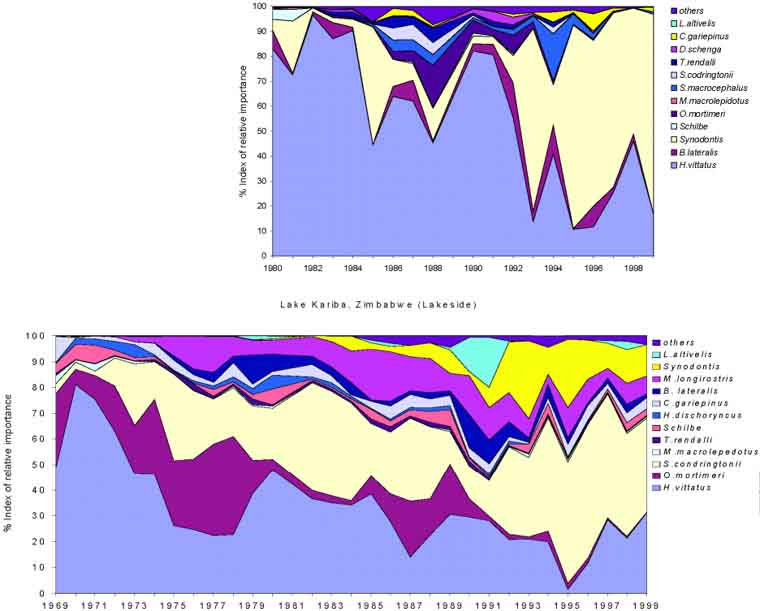
The successive development in species diversity, and particularly the relative evenness, seems more pronounced at Lakeside in the most lacustrine part of the lake (Basin 5) than in the Sinazongwe area (Basin 3). During the 1970s the relative abundance of Hydrocynus vittatus gradually declined after which it stabilized (Karenge and Kolding 1995a). Among the cichilids, Serranochromis condringtonii, which was not common in the lake in the early years (Kenmuir, 1984), has gradually replaced the Kariba bream (Oreochromis mortimeri) in Basin 5. Oreochromis macrochir, which had been reported to have disappeared completely shortly after stocking (Balon, 1974a) has been caught in low, though regular, numbers since 1975. This period was also marked by the gradual decline of Marcusenius macropidotus and Hippopotamyrus discorhynchus but with a substantial increase of the larger mormyrid species Mormyrus longirostris. From around 1980 the squeaker Synodontis zambezensis gradually became important in the inshore system, while the “Upper Zambezi invader” Serranchromis macrocephalus appeared in the lake and increased in abundance.
The tigerfish (Hydrocynus vitattus), due to its important recreational value as an angling fish, has always attracted particular attention in the management regulations of Lake Kariba. Its relative decline (Figure 15) has been subject to repeated concern. This species is considered particularly vulnerable to fishing with small mesh sizes (Kenmuir, 1973; Marshall, Junor and Langerman, 1982; Langerman, 1984; Scholz, 1993). Sanyanga (1995) even considered it presently endangered in Lake Kariba and recommended to give it conservation status. However, taking into account that the Lakeside catch data are from an unfished part of the lake and that the Zambian experimental catches are from an area with a continuously increasing level of fishing effort with decreasing mesh sizes, it is a paradox that the mean Index of Relative Importance for 1980-1994 for tigerfish in Zambia was 57 percent while at Lakeside it was only 26 percent. (Figure 15). Thus, while tigerfish has decreased in absolute abundance on the Zambian side since 1980, this decrease is proportionally following the same trend as all the other species in the inshore fishery (Figures 8 and 13). From the available data it is difficult to support the notion that tigerfish is particularly vulnerable to fishing with small mesh sizes, neither that it is an endangered species in the Kariba ecosystem. Karenge and Kolding (1995b) found that the relative lake level changes were the most important factor for the abundance of tigerfish. Lake Kariba experienced a serious drought between 1982 and 1998, with a subsequent rapid rise to full capacity in 2000 (Figure 2). It is expected therefore that the catch rates will increase from 1999 which has been confirmed during 2001 (Patrick Ngalande, pers. comm).
4.7 Diversity
The appearance of new species and the increasing abundance of other species (like L. altivelis and S. zambezensis, which were common in the Zambezi River before inundation) have resulted in steadily increased fish species diversity (Figure 16).
FIGURE 16. Development in species diversity in the Kariba experimental gillnets (mesh sizes 50-152 mm) represented by A: annual mean number of species caught and B: Shannons’s diversity index (H’). Continuos trendlines are for the whole period of observations (1970-1999 and 1980-1999 in Zimbabwe and Zambia respectively). Broken trendlines are from the period 1980-1994 in Zambia. The broken trendlines for Zambia (A: Slope = 0.21, SE = 0.15; B: Slope = 0.05, SE = 0.020) and the trendlines for Zimbabwe (A: Slope = 0.22, SE = 0.03; B: Slope = 0.02, SE = 0.004) are statistically not significantly different at 95 percent confidence intervals.
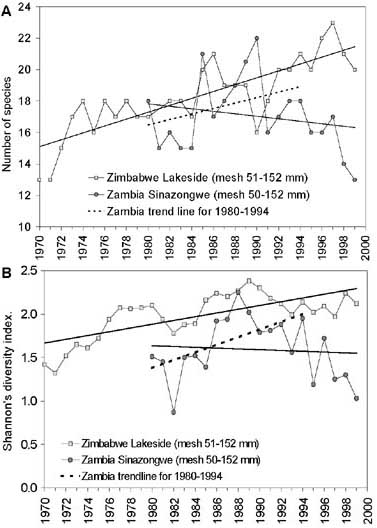
An overall increase over time in the both the number of species caught and the Shannons diversity index can be observed at Lakeside, whereas around Sinazongwe an increase in the 1980s was followed by a decrease after 1993 (Figure 16). The decrease in Zambia, however, is believed a sampling artefact because from 1994 only the stations within the Zongwe estuary were sampled which due to the habitat has an overall lower diversity. The total number of species caught over the period 1980-1994 is 32 in Zambia and 29 in Zimbabwe in the experimental fleet of 50-152 mm mesh sizes. The average Shannon diversity index, however, is significantly different between the two countries due to a higher relative evenness among the species at Lakeside in Basin 5 (Table 2, Figure 15).
Comparing the period 1980-1994 in Zambia with the whole period in Zimbawe the successive development in species diversity (slopes) is not significantly different on the two sides of the lake (Figure 16). The lower mean values in the Zambian experimental catches can be explained from the different habitats in Basins 3 and 5 and the overall composition gradient along the lake.
TABLE 2. Comparison of the species diversity in the Zambian and Zimbabwean inshore gillnet catches between 1980 and 1994. Shannons diversity index (H’) and evenness index (J’) with confidence limits of 2A SE from bootstrapping.
|
|
mesh range |
# fleet settings |
# species |
H’ |
J’ |
|
Zambia |
51-152 |
869 |
32 |
1.90 ± 0.04 |
0.57 ± 0.02 |
|
Zimbabwe |
50-152 |
592 |
29 |
2.29 ± 0.03 |
0.69 ± 0.02 |
4.8 Biomass-size distribution
The difference in the mean experimental catch rates between Zimbabwe and Zambia (Figure 13) is reflected in the overall biomass-size distribution of the two areas (Figure 17).
FIGURE 17. Relative biomass-size distribution with linear regression from Zimbabwe (Lakeside) and Zambia (Sinazongwe) experimental fisheries during the period 1980-1994 for all fish caught in mesh sizes 50-152 mm. Linear regressions on ln-transformed standardized mean catch rates (gram/45 m net set) were made from length range 23-89 cm (Zimbabwe) and 25-78 cm (Zambia) (from the highest value to first 0-observation). The SE of the slopes are 0.0028 and 0.0019 for Zimbabwe and Zambia respectively which means the slopes are not significantly different at 95 percent confidence level.
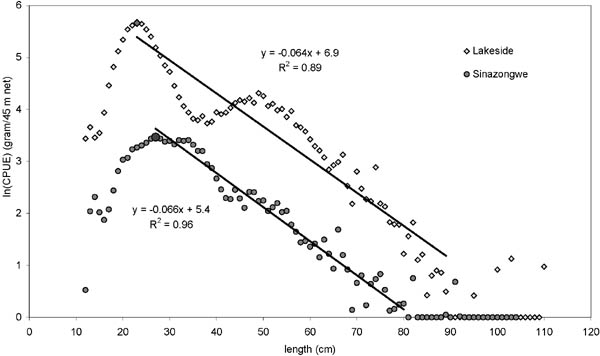
Although the means of the biomass-size distributions (intercepts) are significantly different it is interesting to note that the slopes are not. This indicates that although the absolute stock abundance is clearly different between the unfished and fished areas, the overall community size structure is relatively the same. Comparing the biomass-size distributions with the relative inshore catch composition (Figure 12) and the development in species diversity (Figures. 15 and 16), it appears that the much higher fishing intensity in Zambia with smaller mesh sizes only are affecting the overall biomass of the stocks, whereas the community structure and composition seems not affected. There are no indications that the present fishing level and fishing pattern in the Zambian inshore fishery show any potential threat to the biodiversity of the lake. As the overall yields have not declined (Figure 7), the lower catch rates are not a sign of overfishing in a biological sense, but simply a sign of fishing. Furthermore, by decreasing the mesh sizes, and thereby increasingly exploiting the smaller species/sizes in the biomass-size spectrum, the Zambian fishers are not only able to largely maintain their individual returns (CPUE) despite overall increasing effort, but also maintain the same relative size spectrum in the community which ecologically speaking only makes sense (see Jul-Larsen et al. 2003, Chapter 5).
4.9 The relative impact of the environment
Both experimental, inshore, and offshore catch per unit of effort (CPUE) fluctuated synchronously with mean annual lake level fluctuations with a remarkably high correlation (Karenge and Kolding, 1995b). The question is therefore how much of the observed variation can be attributed to fishing and how much to the changing environmental conditions.
TABLE 3. The relative effect of hydrological changes and effort on catch rates in the Kariba fisheries. The statistical regression model used is: Annual mean catch rateijk = overall mean + efforti + lag(hydrological variablej) + efforti lag(hydrological variablej) + residual variationijk. Only significant effects are retained in the model and shown here as positive (+) or negative (-) effects. In some instances the hydrological variables and effort were confounded meaning that both parameters were significant alone, but in the total model one or the other became non-significant depending on the order they were entered into the model. In such situations it is not possible to quantify the relative effect of both parameters simultaneously. N = number of years in the model.
|
Dependent variable |
N |
Independent variables |
||||||||||
|
Annual mean catch rate |
Hydrology |
Effort |
Interaction |
|||||||||
|
System Variable |
Lag |
Variable |
Sign |
% |
Variable |
Sign |
% |
Sign |
% |
|||
|
Zimbabwe |
|
|
|
|
|
|
|
|
|
|
||
| |
Artisanal CPUE (Kg/net) |
27 |
0+1 |
D Lake levels |
+ (**) |
29 |
# Fishers |
-(**) |
44 |
Ns |
|
|
| |
Artisanal CPUE (Kg/net) |
27 |
0 |
D Lake levels |
+ (**) |
19 |
#Nets |
-(**) |
26 |
Ns |
|
|
| |
|
Exp. CPUE (kg/net) |
29 |
0 |
Amplitude |
+ (**) |
39 |
# Fishers |
Ns |
|
Ns |
|
| |
|
Exp. CPUE (kg/net) |
29 |
0 |
Amplitude |
+ (**) |
39 |
#Nets |
Ns |
|
Ns |
|
| |
Kapenta CPUE(t/night) |
26 |
0 |
Lake levels |
Confounded |
Boats |
Confounded |
-(**) |
56 |
|||
|
Zambia |
|
|
|
|
|
|
|
|
|
|
||
| |
Artisanal CPUE (Kg/net) |
20 |
0 |
Lake levels |
+ (**) |
32 |
# Fishers |
Ns |
|
Ns |
|
|
| |
Artisanal CPUE (Kg/net) |
20 |
0 |
Lake levels |
+ (**) |
32 |
#Nets |
-(*) |
9 |
-(*) |
8 |
|
| |
|
Exp. CPUE (kg/net) |
20 |
0 |
Lake levels |
+ (**) |
31 |
# Fishers |
Ns |
|
Ns |
|
| |
|
Exp. CPUE (kg/net) |
20 |
0 |
Lake levels |
+ (**) |
34 |
#Nets |
-(**) |
23 |
-(*) |
11 |
| |
Kapenta CPUE(t/night) |
18 |
0 |
Lake levels |
Confounded |
Boats |
Confounded |
|
60 |
|||
The results of the multiple regression analyses between the various time series of catch rates, effort, and hydrological variables (Table 3) indicate that the lake level fluctuations have a significant effect on the overall stock sizes in both the unfished area, the inshore, and the offshore Kapenta. The fishing effort had no effect on the experimental catch rates in the unfished Lakeside area, which supports the notion that a closed area could act as a sanctuary. The fishing effort however had significant effect in all the exploited areas. In the Zimbabwe inshore fishery both the number of fishers and the number of nets were significant, reflecting the relatively constant number of nets per fisherman over time in this fishery. In the inshore Zambian fishery, however, only the number of nets were significant, reflecting the ever increased number of nets per fisherman (Figure 6) in this fishery.
Most interestingly, however, fishing effort had a higher relative effect in the lightly fished inshore Zimbabwean inshore fishery (44 percent and 26 percent for the number of fishers and number of nets respectively) compared to the higher exploited Zambian inshore fishery (9 percent for the number of nets). Conversely the environment had a higher effect in the inshore Zambian fishery than the inshore Zimbabwean fishery. Everything else being equal, this seems to indicate that as the fishing effort increases and the stock levels are reduced, the annual catch rates become more and more dependent on the changing environmental conditions. In other words, in an unstable environment with a high exploitation level, the fishery will develop more and more into a boom and bust fishery with the changing environmental conditions (see Figure 5.8, Volume 1). This situation would explain the much more variable annual catch rates and relative species composition in the Zambian inshore fishery compared to the less exploited Zimbabwean side (Figures 8 and 12).
|
[16] No effort data are
available between 1971 and 1979 but from 1980, after the Zimbabwean civil war,
the fishery re-opened and data collection resumed. |
![]()
![]()
![]()