![]()
![]()
![]()
Alimoso, S.B. (1991), Catch effort data and their use in the management of fisheries in Malawi, in Catch effort sampling strategies: Their application in freshwater fisheries management, Cowx, I. (ed.), Fishing News Books, Oxford.
Banda, M.C., Kanyerere, G.Z., Manase, M.M., Mwakiyongo, K., Ngochera, M., Nyasulu, T., Rusuwa, B., Sipawe, R.D. & Weyl, O.L.F. (2002), Management recommendations for the Lake Malombe fishery, NARMAP Technical Report no.6, Fisheries Department of Malawi GTZ.
Bulirani, A.E., Banda, M.C., Palsson, O.K., Weyl, O.L.F., Kanyerere, G.Z., Manase, M.M. & Sipawe, R.D. (1999), Fish stocks and fisheries of Malawian waters: resource report, Fisheries Research Unit, Fisheries Department, Government of Malawi.
Densen, W.L.T. van (2001), On the perception of time trends in resource outcome. Its importance in fisheries co-management, agriculture and whaling. PhD thesis, Twente University, Enschede.
Donda, S.J., (2000), Theoretical advancement and institutional analysis of fisheries co-management in Malawi. Experiences in Lake malombe and Chiuta. PhD Thesis, Aalborg University and Instititute for Fisheries Management and Coastal Community Development (IFM), Denmark. 329 p.
FAO, (1993), Fisheries management in the South-East arm of Lake Malawi, the Upper Shire River and Lake Malombe, with particular reference to the fisheries on chambo (Oreochromis spp.), CIFA Technical Paper 21, FAO, Rome.
Hara, M. & Jul-Larsen, E., (2003) The ‘lords’ of Malombe: an analysis of fishery development and changes in fishing effort on Lake Malombe, Malawi, in Management, co-management or no management? Major dilemmas in the sustainable utilization of SADC freshwater fisheries, Jul-Larsen, E., Kolding, J., Nielsen, J.R., Overå, R. and Zwieten, P.A.M. van (eds.), FAO Fisheries Technical Paper 426/2, FAO, Rome.
Hoggarth, D.D., Cowan, V.J., Halls, A.S., Aeron Thomas, M., McGregor, J.A., Garaway, C.A., Payne, A.I. & Welcomme, R.L. (1999a), Management guidelines for Asian floodplain river fisheries. Part 2: Summary of DFID research, FAO-Fish-Tech-Pap no. 384/2, FAO, Rome.
Hoggarth, D.D., Cowan, V.J., Halls, A.S., Aeron Thomas, M., McGregor, J.A., Garaway, C.A., Payne, A.I. & Welcomme, R.L., (1999b), Management guidelines for Asian floodplain river fisheries. Part 1: Aspatial, hierarchical and integrated strategy for adaptive co-management, FAO-Fish-Tech-Pap no. 384/1, FAO, Rome.
Jambo, C. & Hecht, T., (2001). Effects of overfishing on reproductive potential of major cichlid fish species in southern Lake Malombe (Malawi): need for “closed area” strategy as a complemenatry management option? In: O.L.F. Weyl and M.V. Weyl, Proceedings of the Lake Malawi fisheries management symposium. 4 - 9 June 2001. Capital Hotel, Lilongwe. National Aquatic Resource Management Programme (NARMAP), DoF Malawi, GTZ.
Johannes, R.E. (1998), The case for data-less marine resource management: examples from tropical nearshore fisheries, Trends in Ecology and Evolution, 13, 243-246.
Junk, W.J., (1996), Ecology of floodplains - a challange for tropical limnology, in Perspectives in tropical limnology, Schiemer, F., Boland, K.T. (eds.), Academic Publishing Ltd., Amsterdam.
Kalk, M., McLachlan, A.J. & Howard-Williams, C. (1979), Lake Chilwa: studies of change in a tropical ecosystem, Junk, The Hague.
Karenge, L.P. & Kolding, J. (1995), On the relationship between hydrology and fisheries in lake Kariba, central Africa, Fisheries Research, 22, 205-226.
Kolding, J. (1992), A summary of lake Turkana: An ever-changing mixed environment. Mitteilungen-Internationale Vereinigung für Theoretische und Angewandte Limnologie, 23, 23-25.
Kolding, J., Musando, B. & Songore, N. (2003), Inshore fisheries and fish population changes and in Lake Kariba, in Management, co-management or no management? Major dilemmas in the sustainable utilization of SADC freshwater fisheries, Jul-Larsen, E., Kolding, J., Nielsen, J.R., Overåö, R. and Zwieten, P.A.M. van (eds.), FAO Fisheries Technical Paper 426/2, FAO, Rome.
Lae, R. (1995), Climatic and anthropogenic effects on fish diversity and fish yields in the Central delta of the Niger River, Aquatic Living Resources, 8, 43-58.
Lévêque, C. & Quensière, J. (1988), Les peuplements ichthyologiques des lacs peu profonds, in Biologie et ecologie des Poissons d’eau douce Africains - Biology and ecology of African freshwater fishes, Lévêque, C., Bruton, M.N., Ssentongo, G. (eds.), ORSTOM, Paris.
Mahon, R. (1997), Does fisheries science serve the needs of managers of small stocks in developing countries? Canadian Journal of Fisheries and Aquatic Sciences, 54, 2207-2213.
McCracken, J. (1987), Fishing and the colonial economy: the case of Malawi. Journal of African History, 28, 413-429.
Mwakiyongo, K. & Weyl, O.L.F. (2001), Management Recommendations For The Nkacha Net Fishery of Lake Malombe, in Lake Malawi Fisheries Management Symposium - Proceedings, 4 - 9 June 2001, Weyl, O.L.F. & Weyl, M.V. (eds), Capital Hotel, Lilongwe. NARMAP Conf. Proc. 1, Monkey Bay.
Oostenbrugge, J.A.E.v., Bakker, W.J., van Densen, W.L.T., Machiels, M.A.M. & Zwieten, P.A.M. van (2002), Characterizing catch variability in a multispecies fishery: implications for fishery management, Can. J. Fish. Aquat. Sci., 59:1032 - 1043.
Oostenbrugge, J.A.E.v., van Densen, W.L.T. & Machiels, M.A.M., (in press), How the uncertain outcome of both aquatic and land resources structure livelihood strategies in coastal communities in the Central Moluccas, Indonesia,
Palsson, O.K., Bulirani, A. & Banda, M. (1999), A review of biology, fisheries and population dynamics of (Oreochromus spp. Cichlidae) in lakes Malawi and Malombe, Fisheries Bulletin No. 38, Fisheries Research Unit, Fisheries Department, Government of Malawi, Lilongwe.
Pauly, D., (1994), On Malthusian overfishing, in On the sex of fish and the gender of scientists: essays in fisheries science, D. Paul, London, Chapman & Hall: 112-117
Pet, J.S., Machiels, M.A.M. & van Densen, W.L.T., (1996), Asize-structured simulation model for evaluating management strategies in gillnet fisheries exploiting spatially differentiated populations, Ecological Modelling, 88, 195-214.
Pet Soede, C., Machiels, M.A.M., Stam, M.A. & van Densen, W.L.T. (1999), Trends in an Indonesian coastal fishery based on catch and effort statistics and implications for the perception of the state of the stocks by fishery officials, Fisheries Research, 42, 41 - 56.
Peterman, R.M. (1990), Statistical power analysis can improve fisheries research and management, Canadian Journal of Fisheries and Aquatic Sciences, 47, 2-15.
Sarvala, J., Salonen, K., Jaervinen, M., Aro, E., Huttula, T., Kotilainen, P., Kurki, H., Langenberg, V., Mannini, P., Peltonen, A., Plisnier, P.D., Vuorinen, I., Moelsae, H. & Lindqvist, O.V. (1999), Trophic structure of Lake Tanganyika: carbon flows in the pelagic food web, Hydrobiologia, 407, 149-173.
Spigel, R.H. & Coulter, G.W. (1996), Comparison of hydrology and physical limnology of the East African great lakes: Tanganyika, Malawi, Victoria, Kivu and Turkana (with reference to some North American Great Lakes), in The Limnology, Climatology and Paleoclimatology of the East African Lakes, Johnson, T.C., Odada, E.O. (eds.), Gordon and Breach Publ, Amsterdam.
Talling, J.F. & Lemoalle, J. (1998), Ecological dynamics of tropical inland waters, Cambridge University Press, Cambridge.
Tarbit, J. (1972), Lake Malawi trawling survey. Interim report 1969-1971. Fisheries Bulletin No. 2, Ministry of Agriculture and Natural Resources, Zomba, Malawi.
Tweddle, D., Alimoso, S.B. & Sodzabanja, G., (1994), Analysis of catch and effort data for the fisheries of lake Malombe 1976-1989, Fisheries Bulletin, 11, Fisheries Research Unit, Fisheries Department, Government of Malawi, Lilongwe.
Tweddle, D.E. (1995), Proceedings of the Fisheries Research Symposium, November 1994, Fisheries Bulletin 33, Fisheries Department, Ministry of Natural Resources, Lilongwe.
Weyl, O.L.F. (1999), Lake Malombe artisanal fishery catch assessment 1994 1998, Technical Report No. 1, Fisheries Department-NARMAP, Monkey Bay.
Weyl, O.L.F., Banda, M.C., Manase, M., Namoto, W. & Mwenekibombwe, L.H. (2001), Analysis of catch and effort data for the fisheries of Lake Malombe, 1976 - 1999, Fisheries Bulletin no. 45, Fisheries Research Unit, Department of Fisheries, Government of Malawi, Lilongwe.
Zwieten, P.A.M. van, Roest, F.C., Machiels, M.A.M., & van Densen, W.L.T. (2002), Effects of inter-annual variability, seasonality and persistence on the perception of long-term trends in catch rates of the industrial pelagic purse-seine fisheries of Northern Lake Tanganyika (Burundi), Fisheries Research, 54, 329-348.
Zwieten, P.A.M. van & Njaya, F., (2003), Environmental variability, effort development and the regenerative capacity of the fish stocks in Lake Chilwa, Malawi, in Management, co-management or no-management? Major dilemmas in the sustainable utilization of SADC freshwater fisheries, Jul-Larsen, E., Kolding, J. Nielsen, J.R., Overå, R. & Zwieten, P.A.M. van (eds.), FAO Fisheries Technical Paper 426/2, FAO, Rome.
Appendix 1: Data bases used and species grouping
1.1 Data used to examine trends and variability
Monthly average catch rates by species (or species groups) and gear from 1978 - 1997,
Fishing effort by gear, number of fishermen, assistants and boats from 1978 - 1999,
Daily sampled catch rate and effort data from 1994 to 1998, and
Daily water levels from 1976 to 1998.
Monthly catch and effort data were calculated from data collected through the CEDRS of Malombe and stored at the Monkey Bay Fisheries Unit, from where we obtained them. Frame survey data were obtained from the Mangochi Fisheries Office. From 1978 to 1993 the total monthly catch estimates were done using boats as unit of effort (see description in van Zwieten and Njaya 2003). In 1993 the system changed to the Malombe Traditional Fisheries (MTF) data collection system, in which monthly catch estimates are based on units of effort using gear size (gillnets) and gear activity (other gear). Daily sampled catch rate and effort data were obtained from the data as stored in the Mangochi Fisheries Office, and compiled by Weyl (1999) and Weyl et al. (2001). For a description of the methods of data collection in the Malawi CEDRS we refer to Alimoso (1991), FAO (1993) and Zwieten and Njaya 2003.
TABLE 6. Species (groups) as distinguished in the CEDRS of Lake Malombe, percentage of total catch of a species by gear and % of total catch between 1981 and 1998. The last column indicates the grouping as used in this report.
|
Species |
Kambuzi Seine |
Gillnet |
Nkacha Seine |
Chambo Seine |
Other gear |
% of total Catch |
Category in this report |
|
Kambuzi |
65.1% |
0.1% |
32.4% |
0.0% |
1.7% |
45.7% |
Haplochromines |
|
Chambo |
1.5% |
66.2% |
0.4% |
31.9% |
0.0% |
36.4% |
Oreochromis |
|
Other |
43.1% |
22.0% |
27.3% |
5.1% |
2.0% |
5.2% |
Other |
|
Utaka |
63.3% |
4.3% |
28.6% |
0.0% |
0.2% |
3.8% |
Haplochromines |
|
Other Tilapia |
25.4% |
44.9% |
2.0% |
27.8% |
0.0% |
3.7% |
Oreochromis |
|
Mamba |
17.8% |
60.6% |
12.4% |
5.8% |
3.2% |
1.8% |
Clariidae |
|
Kampango |
20.8% |
60.7% |
6.5% |
11.3% |
0.5% |
1.7% |
Bagridae |
|
Mbaba |
10.9% |
0.9% |
88.2% |
0.0% |
0.0% |
0.9% |
Haplochromines |
|
Nchila |
7.2% |
83.0% |
3.4% |
6.4% |
0.0% |
0.6% |
Cyprinidae |
|
Usipa |
18.1% |
0.0% |
5.0% |
0.0% |
76.9% |
0.2% |
Other |
|
Kasawala |
34.5% |
0.1% |
65.5% |
0.0% |
0.0% |
0.0% |
Oreochromis |
|
Chisawasawa |
38.2% |
45.3% |
16.5% |
0.0% |
0.0% |
0.0% |
Other |
|
Sanjika |
36.1% |
35.9% |
28.0% |
0.0% |
0.0% |
0.0% |
Cyprinidae |
|
Mpasa |
9.2% |
56.3% |
0.0% |
34.5% |
0.0% |
0.0% |
Cyprinidae |
|
TOTAL |
36.6% |
29.8% |
18.7% |
13.3% |
1.2% |
100.0% |
|
Water levels are measured twice daily at the gauge in the Shire River at Mangochi. Average daily water levels from this station were obtained through the Water Department in Lilongwe. No lake levels of Malombe itself are available.
1.2 Species groups used in the analysis
The CEDRS distinguishes 14 species and species groups (Table 6. However, most of these species take up less than four percent of the total catch and therefore were combined in four species groups. “Kambuzi” is considered as cichlids other then “Chambo” of less then 8 cm. “Mbaba” are cichlids larger than 8 cm “Kasawala” is in general juvenile “Chambo”. “Other tilapia” is in general Oreochromis shiranus, a species not belonging to the “Chambo” complex.
Longlines and mosquito nets caught 1.2 percent of the catch as recorded in the CEDRS and were not considered here.
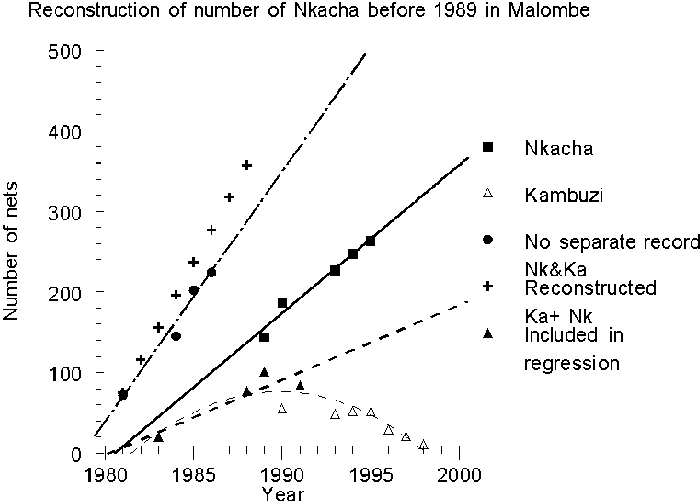
Appendix 2. Reconstruction of the number of Nkacha nets and Kambuzi seines
Before 1989 Kambuzi seines and Nkacha nets were not counted separately. To investigate the effects of changes in effort on the stocks, an estimate of the number in two types of gear was made, based on the assumption that from 1981 until 1989 both gears increased linearly in number over the years (Figure 15). Trend analysis of numbers of Kambuzi seines until 1991 where they were counted separately from Nkacha nets, of Nkacha nets after 1989, and of both gears combined before 1989 yielded three linear regressions. Adding up the estimated numbers from the regressions of Nkacha nets and Kambuzi seines yielded reconstructed numbers of both gears combined that were close to the actual numbers of both gears combined. By subtracting the estimated number of Nkacha seines from these numbers of combined gears an estimate for the number of Kambuzi seines before 1988 was obtained.
FIGURE 15. Reconstruction of the number of Nkacha nets and Kambuzi seines between 1981 and 1989. See text for explanation
Appendix 3: Analysis of variability in catch rates: effect of administrative error and aggregation
The total variability in the monthly mean catch rates series from 1978 to 1997 was high. For instance, the variance in catch rates of gillnets was 0.15 (=10log s2, see Table 1, main text), corresponding with a coefficient of variability (CV = standard deviation*100/mean) of 110 percent, estimated through CV = 100*Ö(102.303*variance-1). This represents the variability of data aggregated over strata, fishermen, month and species. Aggregation in principle reduces variability: dis-aggregation over month and fishermen to daily catch rates of the estimated variability of CV = 110 percent would result in a CV that is outside the experience of any gillnet fishery. In general gillnet fisheries show variability in basic uncertainty of daily catches ranging between 50 percent and 80 percent (Densen, 2001). Daily catches as experienced by gillnet fishermen with a CV of for instance 80 percent would translate in an aggregated monthly CV of around 15 percent. Three sources of variability can account for this: (1) inter-annual variability - including trends (2) seasonal variability and (3) errors in data collection and handling or in other words “administratively induced” variability. Removing inter-annual and seasonal variability reduces the variance to 0.063 (Table 2), which calculates to a CV = 63 percent. This basic uncertainty at the aggregated level thus is still too high and can only be administratively induced. We will examine the causes of this type of error.
Digitized daily catch rates from the gillnet and Nkacha fishery obtained in the MTF from 1994 to 1998 were examined to assess the effect of outliers resulting from administrative errors in the data on the CV. The series contained both catch and effort data (number of hauls and length of the net). The data series contained daily catch rates of 3 031 gillnet and 7 901 Nkacha seine recordings, effort expressed as size of the net and, in case of Nkacha nets, number of pulls as well. From these sets random samples of 30 data were taken without replacement (Jack-knife procedure) repeated 30 times. This procedure was carried out both with the raw sampled catch rate data and the same catch rate data corrected for effort. Mean, standard deviation and CV were calculated for each sample and a frequency distribution of CV’s was obtained (Figure 16).
The mode of the distribution of CV’s in raw daily catch rate data in gillnets is at CV = 70 percent, which falls within the range observed in other gillnet fisheries. But, the average CV of the original series of sampled catch rates is 136 percent. Taking into account monthly and annual variance reduced this to a CV = 104 percent, indicating that the outliers in the distribution cause the remaining excess variability. The mode of the frequency distribution of CV’s calculated from the random samples increased slightly when corrected for effort. However, the average CV for the corrected series increases considerably to 190 percent. Removing monthly and annual variability reduced this CV to 110 percent, indicating again that outliers cause the excess variability. Aggregation of the corrected catch rates over months according to the procedure followed by the Malawi fisheries information system reduced the CV to 50 percent. This is somewhat lower than the CV = 63 percent of the basic uncertainty (i.e. with trend and seasonality removed) in monthly average catch rates of the complete series from gillnets analysed in this paper, while this behaviour is close to the expected reduction in CV through aggregation by multiplication with Öa (with “a” the level of aggregation, under the condition of independence of data). Annual variability in the monthly average catch rates calculated from the daily samples was significant, but the CV did not reduce when corrected for this source of variability.
Sampled catch rates in Nkacha nets exhibit more or less the same behaviour, though the distributions show less outliers: the mode of both the corrected and uncorrected distributions is CV = 80 percent. Average CV of the raw catch rate data = 92 percent, increasing only slightly to 96 percent as a result of correction by effort. However, aggregation of corrected catch rates over month only lowers the CV to 50 percent, more than twice as high than would be expected based on the theoretical behavior of the CV through aggregation. Removing significant annual variability reduced the CV to 34 percent, somewhat closer to the expected value. In other words, both examples show that outliers have a strong effect on the total variability of the data. The examples of gillnets and Nkacha nets were chosen as they clearly showed the narrow range of CV’s to be expected from samples of daily catch rates of a reasonably well defined gear. Both for Kambuzi seines and Chambo seines this range was much broader both for sampled catch rates and corrected catch rates, though in both cases with a mode not much different from Nkacha nets. This indicates that a much less well-defined unit (gear size and activity) from which the daily catch rate samples are taken induces a lot variability.
FIGURE 16. (Top): % Frequency distribution of coefficients of variation (CV) calculated from 30 repeated random samples without replacement of daily catch rate samples from gillnets and Nkacha nets in the CEDRS of Malombe between 1994 and 1998. (Bottom): Same but sampled catch rates corrected for effort. The areas outside the vertical bars are outliers, the percentage outliers are indicated in each graph. Black dots: CV of the complete data set, open circles CV of the same data aggregated by month. See text for further explanation
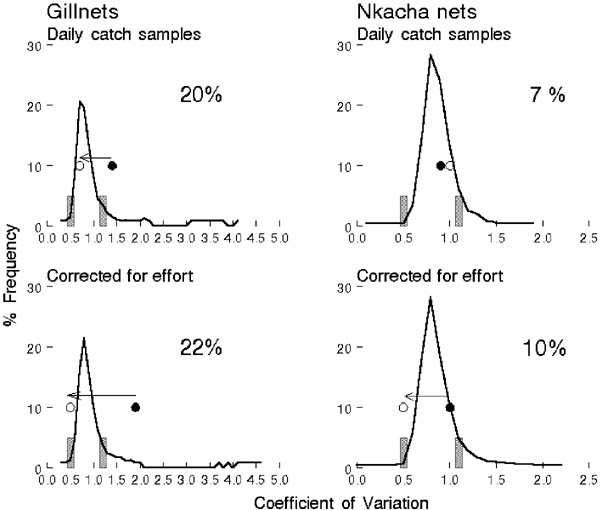
Probably, most of the high variability in the total series is caused both by administrative errors in data collection and handling and the effect of correction and raising factors. The behavior of the data from 1994 to 1998 in the MTF differs not much from the complete monthly catch rate series analysed here which is based on two different data collection systems. As there is no reason to believe that the administratively induced error changes over time it can be considered random.
![]()
![]()
![]()