![]()
![]()
![]()
There are two principal schools of thought on how to measure food inadequacy and undernutrition on the national level.[12] The first is to use statistics on food availability (based on commodity balances) or consumption (based on household surveys) to estimate the incidence of food inadequacy. The second is to use anthropometric measures of undernutrition to estimate the portion of undernourished persons in the country. This chapter examines evidence on food inadequacy using measures of consumption based on household surveys. Household survey information is compared with FAO estimates of food inadequacy derived from commodity balances from Chapter 2, and the determinants of food inadequacy based on survey data are considered. Anthropometric evidence on undernutrition is considered in Chapter 4.
The authors know of no satisfactory estimates of food inadequacy for the Russian Federation. Measurements of the portion of food-inadequate population in the country have significant methodological problems, ranging from sampling biases to lack of a sampling frame to uncertain food conversion coefficients. Not surprisingly, estimates of the portion of the food-inadequate population are highly divergent and most are difficult to reconcile with measures of undernutrition. Information on food consumption in 2000 from the Goskomstat Household Budget Survey (HBS) and the Association Agro Food Insecurity Survey is analysed in this chapter. Neither survey can give accurate estimates of the degree of food inadequacy in the Russian Federation. The HBS is biased toward poor families and utilizes food conversion coefficients that seem to underestimate caloric consumption by about 10 percent. The AA survey lacks a well-specified sampling frame, so that information from this survey can be used only as a case study of the situation of households near or below the poverty line. Furthermore, comparison of estimates of food consumption from the two surveys indicates that in-kind consumption (and income) appears to be underestimated in the HBS, particularly for the poor.
While the AA survey is not representative of the country as a whole, its limited sample does afford some conclusions. First, household food inadequacy appears to be related to household income, the number of dependents in a family, the number of potential earners and location. Perhaps the most robust conclusion from the AA survey is that food inadequacy is more severe the more urban the settlement. Large cities seem to have the highest incidence of food inadequacy. The greater food security of rural areas may be connected with the prevalence of private plots and their role as buffers against poverty. Eighty-nine percent of individuals in rural areas, 71 percent of individuals in other urban and only 46 percent of individuals in capital cities had private plots in the AA survey. Second, food inadequacy in the AA survey was found to be higher in larger families, though not necessarily in families with large numbers of children. Pensioner families were not found to be at higher risk of food inadequacy compared to other families. Family income was also an important determinant of food inadequacy.
The two major sources of food consumption information for the Russian Federation are the official Goskomstat household budget survey (HBS) and the Russian Longitudinal Monitoring Survey (RLMS). The current Goskomstat HBS is an improved version of the Soviet Household Budget Survey carried out in 89 regions of the Russian Federation with a sample size of approximately 50 000 households. Information from the survey is available quarterly. The RLMS is a panel survey carried out by Goskomstat, but administered by the University of North Carolina in collaboration with the Institute of Sociology of the Russian Academy of Sciences. The latest data available from RLMS is from Round 9 (2000) and the sample size is approximately 4 000 households. The Goskomstat HBS is representative at the national and regional (oblast) level, while the RLMS is representative only at the national level. Estimates from the RLMS survey were not analysed here because of our need to compare information from the national survey with that of the Association Agro (11 oblast) survey. For this comparison we required information representative at the regional (oblast) level.
Association Agro (AA) carried out a special Food Security Survey for this report in 11 oblasts of the Russian Federation between December 2000 and January 2001. The purpose of the survey was to measure food consumption and attitudes in a sample of families around or below the official poverty line. The target population of the survey was households below approximately 3 000 roubles of cash income per month. Since the average level of the poverty line in the Russian Federation was 1 234 roubles per month in 2000 and the average household size was 2.84 people, a household receiving 3 000 roubles or less per month was below the poverty line (1 234*2.84=3 505). The survey covered 2 963 households of 8 750 individuals and was stratified by oblast and settlement type. The survey sampled nearly evenly in each of three settlement types (oblast capital, other urban and rural) in 11 oblasts for a total of 33 strata.[13] In the AA survey 81 percent of households and 77 percent of individuals had cash incomes below 3 000 roubles.
The Goskomstat HBS suffers from two important drawbacks that make it advisable to treat official Goskomstat figures on average caloric intake, the percentage of undernourished persons and caloric intake by income levels (particularly) with great care. These biases mean that analyses of HBS data in the Russian Federation tend to overestimate food inadequacy. The foremost drawback is the bias of the HBS toward lower-income households (Ovcharova, 2001). In economies in which 25 to 50 percent of GDP is in the shadow economy, it is not difficult to understand why the better-off would be reluctant to declare income and perhaps not participate in a household survey. In previous years (before 1994) the HBS suffered from other sampling biases. Data through 1993 derive from respondents drawn from the rolls of state enterprises and collective farms. The HBS has also been criticized for excluding the very poor, since, as a household survey, it excludes persons living in institutions and the homeless. These criticisms are not exclusive to the Russian HBS, of course. They are a problem for all household surveys, though not necessarily to the same degree.[14]
TABLE 9
Nutrient conversion coefficients of
selected foods - Goskomstat and FAO
| |
GOSKOMSTAT |
FAO |
||||
|
Calories |
Protein |
Fat |
Calories |
Protein |
Fat |
|
|
Lentils |
270 |
19.8 |
1.8 |
346 |
24.2 |
1.8 |
|
Wheat flour |
298 |
10.0 |
1.1 |
364 |
10.9 |
1.1 |
|
Rice |
292 |
6.6 |
0.9 |
360 |
6.7 |
0.7 |
|
Macaroni |
305 |
10.3 |
1.5 |
367 |
11.0 |
1.1 |
|
Potatoes |
51 |
1.4 |
0.3 |
67 |
1.6 |
0.1 |
|
Cabbage |
20 |
1.4 |
0.1 |
19 |
1.0 |
0.1 |
|
Melons |
22 |
0.4 |
0.1 |
17 |
0.4 |
0.1 |
|
Sugar |
399 |
|
|
387 |
0.0 |
0.0 |
|
Beef |
129 |
12.9 |
8.6 |
225 |
14.7 |
18.0 |
|
Lamb |
115 |
11.0 |
7.9 |
263 |
13.5 |
22.8 |
|
Pork |
255 |
11.0 |
23.4 |
220 |
13.4 |
18.0 |
|
Poultry |
116 |
9.4 |
8.6 |
185 |
17.1 |
12.4 |
|
Fish |
55 |
8.2 |
2.4 |
91 |
12.6 |
3.4 |
|
Milk |
57 |
2.7 |
3.1 |
61 |
3.3 |
3.3 |
|
Sour cream |
166 |
2.5 |
15.7 |
195 |
2.7 |
19.3 |
|
Cheese |
329 |
23.0 |
25.5 |
387 |
25.0 |
31.0 |
|
Butter |
640 |
0.7 |
70.3 |
717 |
0.9 |
81.1 |
|
Eggs |
111 |
10.2 |
7.5 |
163 |
11.3 |
12.1 |
|
Margarine & other fats |
559 |
0.3 |
61.5 |
720 |
0.6 |
81.0 |
|
Vegetable oil |
872 |
|
96.9 |
884 |
0.0 |
100.0 |
Sources: Goskomstat figures from the Government of the Russian Federation (2000); FAO from FAO (2002b).
A second possible drawback of the Goskomstat HBS is its use of nutrient conversion coefficients which produce uniformly lower estimates of the fat and calorie content of livestock products compared to reference conversion coefficients of FAO (Table 9). Pork, which in the Russian Federation has a higher fat content than in western countries, is the sole exception to this generalization. FAO usually prefers country-specific nutrition conversion factors, since the FAO food composition data should be viewed as an average reference level. However, the Goskomstat food composition coefficients differ consistently from FAO coefficients in only one direction, toward an underestimate of the caloric and fat content of livestock products.
Biases of the Goskomstat household budget survey, as well as different methodologies, are responsible for the sizeable (15-20 percent) difference in average caloric intake measured using Goskomstat HBS figures compared to the same measure derived from commodity balances. In Figure 9 the line entitled “Caloric food intake - Goskomstat HBS” (average caloric consumption per capita according to Goskomstat HBS data using Goskomstat food composition coefficients) is 15-20 percent lower than per capita consumption derived from food balances. The line entitled “Caloric food intake - Goskomstat HBS with FAO conversion coefficients” shows that use of Goskomstat conversion coefficients accounts for about half of this difference. Certainly, it would be surprising indeed if the “top down” commodity balance method and the “bottom up” survey method coincided. However, with such large differences, it is difficult to say much about the level of caloric consumption with any confidence.
FIGURE 9
Caloric food intake, 1980-1999
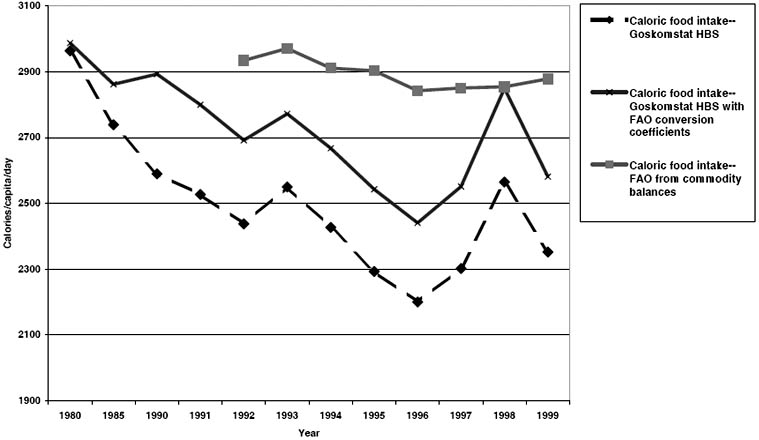
Source: Calculations based on Table 34.
For analysis of the caloric content of Russian food intake it is necessary to specify a minimum dietary energy requirement or caloric “cut-off line” analogous to a poverty line in poverty analysis. Poverty analysis in the Russian Federation uses a “minimum food consumption basket” which is approximately 15 percent higher in calories than the minimum dietary energy requirement determined by FAO/WHO/UNU (2 275 versus 1 970 calories). The Russian minimum food basket has also been criticized for being closely based on actual (unhealthy) consumption trends among the population. Essentially, a more healthy food consumption basket could be purchased at lower cost (Mroz and Popkin, 1995). Critics answer that the minimal food basket is consistent with the actual consumption habits of the Russian population, and therefore its cost, rather than the cost of a prescribed basket, would more likely lead to actual consumption below nutritional target levels. Recommended average caloric intake and food adequacy lines are always approximations, since the actual caloric requirements of each individual depend on the age, sex, activity level and metabolism, and population-wide minimum requirements are weighted averages based on population structure.
The main limitation of the Association Agro Food Security Survey is the lack of a well-specified sampling frame. The survey measures food consumption and attitudes in a sample of families with household cash income around or below the official national poverty line in 11 oblasts of the Russian Federation. In the AA survey 81 percent of households and 77 percent of individuals had cash incomes below the target household income level of 3 000 roubles. Reweighting of data from the AA survey is prevented by lack of information on the number of households and number of individuals below the target income level of 3 000 roubles per month per household in the 11 oblasts covered in the survey.[15] The lack of sampling frame prevents drawing firm conclusions about the Russian parent population with regard to indicators of food inadequacy. Conclusions can be drawn only about the sample as a case study in food security in households at or below the poverty line in the Russian Federation.
The AA survey included questions on income category, food production, food consumption and various qualitative judgments about the welfare level and actions of households. Questions on food purchases requested the respondent to list food purchases in an average month during the previous year. Questions on food production requested the respondent to record total production and utilization over the previous crop or calendar year. In Table 10 “cash and plot income” is calculated by adding the midpoints of the cash income category figures to the value of food production for sale and self-consumption and food gifts received minus those given. Local (oblast) retail prices were used to value food items in this estimate. This wider income aggregate indicates that, on average, households in the AA survey received just a bit lower than the year 2000 Russian Federation poverty line at 3 174 roubles per household.[16] Table 10 shows the distribution of the AA sample by cash income category.
TABLE 10
Mean income of households and
individuals in Association Agro Food Security Survey sample
| |
Cash incomes roubles/month per household* |
Cash and plot incomes roubles/month |
Observations |
||
|
Per household |
Per capita |
Households |
Individuals |
||
|
By HH monthly cash income category |
|||||
|
Less than 200 rubles |
100 |
827 |
218 |
28 |
100 |
|
200 – 400 rubles |
300 |
1 754 |
531 |
83 |
272 |
|
400 – 600 rubles |
500 |
1 466 |
596 |
143 |
391 |
|
600 – 800 rubles |
700 |
1 449 |
702 |
267 |
639 |
|
800 – 1 000 rubles |
900 |
1 884 |
771 |
375 |
940 |
|
1 000 – 1 500 rubles |
1 250 |
2 123 |
815 |
457 |
1 287 |
|
1 500 – 2 000 rubles |
1 750 |
2 854 |
966 |
501 |
1 487 |
|
2 000 – 3 000 rubles |
2 500 |
3 132 |
1 064 |
510 |
1 553 |
|
Above 3 000 rubles |
4 000 |
5 229 |
1 498 |
564 |
1 960 |
|
No answer |
|
|
|
35 |
121 |
|
Entire sample |
1 913 |
3 174 |
1 155 |
2 963 |
8 750 |
*Values represent midpoints of income categories or estimates
Source: Association Agro Food Security Survey, December 2000-January 2001.
Information from the AA survey case study can be used for two purposes. First, it can be used as a baseline against which to compare Goskomstat income and average food consumption figures. This comparison indicates that HBS estimates likely underestimate in-kind food income of Russian households, particularly in rural areas. Second, the percentage of households unable to meet their dietary energy requirements from this sample also gives a baseline against which to compare Goskomstat consumption figures. If ‘x’ percent of the AA survey households were unable to meet dietary requirements, this could be viewed as an upper limit for the population as a whole.
The Goskomstat HBS and the AA survey used slightly different income aggregates (Table 11). In principle, the most complete indicator of household welfare is total resources in the Goskomstat HBS. Russian statistics usually list two income aggregates. Cash income is derived from the HBS expenditure information and adjusted by using macro data from the banking sector. The more inclusive aggregate - total resources - is the sum of gross household incomes, savings and borrowing used during the survey period, the value of food self consumption, subsidies and benefits.[17] The AA survey included an estimate of cash income received directly from the respondent as well as a more complete indicator of household welfare, “cash and plot incomes”. Cash and plot incomes includes only cash and in-kind food income, without in-kind subsidies and privileges and dissavings. This is not such a grievous omission, since these two categories accounted for only 5.5 percent of total resources of HBS households in 2000 (Goskomstat, 2001d, p. 73). In the following analysis AA survey cash and plot income and HBS total resources will be treated as equivalent.
As expected, the mean per capita income of households from the AA Survey was considerably lower than that of households surveyed in the Goskomstat HBS (Table 12). The mean cash income of a person in the HBS survey was 1 661 roubles per month, while that from the AA survey was 785 roubles per month. By the more meaningful indicator of welfare, total resources, individuals in the HBS were also better off than those in the AA Survey, though not by as much. In fact, AA survey individuals in rural areas were nearly as well off as those in rural areas from the Russian HBS.
There is a considerable difference between the per capita total resources of urban inhabitants surveyed in the Goskomstat HBS and the AA survey, but a small difference for rural inhabitants. The small size of the difference may indicate that the estimation method of the HBS underestimates an important portion of rural incomes (Table 13). The HBS utilized two-week food consumption diaries to measure food expenditures throughout the year, while the AA survey used the recall method for food production over the preceding crop year with a breakdown of the portion marketed, used for feed, consumed, given as gifts and wasted. Both surveys included self-produced and consumed food as well as food received as gifts. In both the AA and HBS surveys food expenditures (and income) were valued at local (oblast-level) prices.
TABLE 11
Goskomstat HBS and AA Survey income
aggregates
|
Income aggregate |
Cash income1 |
In-kind food income2 |
In-kind subsidies and privileges3 |
Dissavings4 |
|
Goskomstat total Resources |
X |
X |
X |
X |
|
AA Survey cash and plot incomes |
X |
X |
|
|
1. Cash income is estimated from cash expenditures and the change in savings within the survey period.
2. In-kind food products, self-produced, received as gifts and from other sources, valued at local (oblast-level) prices.
3. Estimate of cash value (per respondent) of subsidies and privileges enjoyed by the household for purchase of goods, services as a result of discounts. This includes non-food in-kind income for employees.
4. Savings spent during the survey period.
Source: Goskomstat (2001d), pp. 132-133; Association Agro Food Security Survey, December 2000-January 2001.
TABLE 12
Mean per capita income in Goskomstat HBS
and AA Survey, 2000
|
Roubles per capita per month |
HBS (IV Q 2000) |
AA Survey |
|
Cash income |
||
|
Total |
1 661 |
785 |
|
Urban |
1 894 |
862 |
|
Rural |
1 028 |
528 |
|
Total resources1 |
||
|
Total |
1 899 |
1 155 |
|
Urban |
2 098 |
1 027 |
|
Rural |
1 360 |
1 245 |
|
Ratio: Total resources to cash income |
||
|
Total |
1.14 |
1.47 |
|
Urban |
1.11 |
1.19 |
|
Rural |
1.32 |
2.36 |
1 For AA survey, cash and plot incomes.
Note: The cost of the official minimum monthly consumption basket for the Russian Federation in 2000 was 1 234 roubles.
Sources: Goskomstat (2001c), p. 77; Association Agro Food Security Survey, December 2000-January 2001.
With a lower income one would expect that the mean caloric consumption of AA survey households would be quite a bit less than the average caloric consumption of the Russian population as a whole. In fact, the AA survey sample had an average consumption of only 70 calories less than the average for the Russian Federation for 2000 derived from the HBS (2 326 and 2 394 kcal in Table 14). There are two differences in these figures that make them difficult to compare. First, the AA figures were sampled six months later than those of Goskomstat, in December 2000/January 2001. Without 2001 HBS consumption information, it is not possible to correct for this difference. Second, the HBS survey figures utilize Goskomstat food composition coefficients, while the AA means utilize FAO food composition coefficients. For a proper comparison, the Goskomstat figure can be modified to utilize FAO food conversion coefficients. In Table 14 the recalculated estimate of total calories using FAO conversion coefficients is shown as the “adjusted estimate”, which is about 10 percent higher than the Goskomstat figure. The mean caloric consumption of the Russian population, according to the Goskomstat HBS using FAO food conversion coefficients is 12.5 percent higher than the mean of the AA survey sample. Thus, after adjustment, the AA survey sample had an average consumption of 291 fewer calories than the average for the Russian Federation for 2000 derived from the HBS.
TABLE 13
In-kind food income in Goskomstat HBS
and AA Survey, 2000
|
Region |
HBS (IV Q 2000) |
AA Survey |
||
|
roubles/mo |
% of total resources |
roubles/mo |
% of cash and plot incomes |
|
|
Total |
137 |
7.2 |
306 |
28.0 |
|
Urban |
86 |
4.1 |
182 |
17.4 |
|
Rural |
277 |
20.4 |
722 |
57.8 |
Source: Goskomstat (2001c), p. 77; Association Agro Food Security Survey, December 2000-January 2001.
TABLE 14
Comparison of Goskomstat and Association
Agro Food Security Survey mean food consumption figures (kg/capita/year),
2000
|
Per capita food consumption (kg/year) |
Goskomstat HBS |
AA Survey |
|
Bread and products |
109 |
105 |
|
Potatoes |
93 |
105 |
|
Vegetables and melons |
82 |
44 |
|
Fruits, berries |
27 |
22 |
|
Meat and products |
50 |
50 |
|
Milk and dairy products |
199 |
273 |
|
Eggs, pieces |
202 |
166 |
|
Fish and products |
14 |
12 |
|
Sugar and confectionery |
30 |
17 |
|
Vegetable oil and other fats |
10 |
9 |
|
Total calories (kcal/capita/day) |
2 394 |
2 326 |
|
Adjusted estimate (using FAO food conversion coefficient) |
2 617 |
|
|
Protein (g/capita/day) |
62 |
71 |
|
Fat (g/capita/day) |
82 |
88 |
Source: Association Agro Food Security Survey, December 2000-January 2001
A comparison of food consumption in poor households in 2000 from the HBS and the AA surveys suggests that the HBS underestimates income from in-kind food sources of the poor. Goskomstat publishes no information on the portion of food-inadequate population in the Russian Federation. However, tables on per capita consumption of food by total resource decile are regularly published (Table 15). According to official Goskomstat HBS figures for 1998-2000, the average consumption of the lowest three deciles of the population (the poorest 30 percent) was below the minimum dietary energy requirements set by FAO/WHO/UNU of 1 970 calories. The average consumption for each of the bottom five deciles was less than the caloric equivalent of the official Goskomstat minimum food basket of 2 275 calories. The fact that in Table 15 the mean per capita caloric equivalent of consumption per day of the lowest three or five total resource deciles falls below a minimum level does not indicate that 30 or 50 percent of the population consumes less than the minimum. Each income decile includes persons with consumption above and below the mean. However, it does indicate that the portion of the population consuming less than 1 970 calories per day is likely to be quite a bit above the FAO estimate of food inadequacy in the Russian Federation (based on commodity balances) of 6 percent - probably between 15 and 25 percent. It is also much higher than estimates of undernutrition derived from anthropometric measures covered in Chapter 4 (less than 10 percent).
TABLE 15
Nutritional content of food consumed, by
per capita total resource decile, average 1998-2000
|
Mean values |
||||||||||
|
Total resource deciles |
Lowest |
Second |
Third |
Fourth |
Fifth |
Sixth |
Seventh |
Eighth |
Ninth |
Highest |
|
Protein (grams/capita/day) |
29.5 |
39.6 |
46.3 |
52.4 |
59.0 |
65.0 |
70.7 |
76.2 |
87.6 |
108.8 |
|
Percentage from animal products |
39.7 |
43.9 |
46.1 |
47.4 |
48.7 |
49.9 |
51.2 |
51.7 |
51.9 |
53.4 |
|
Fat (grams/capita/day) |
34.8 |
49.0 |
58.7 |
67.5 |
76.8 |
86.2 |
92.8 |
101.2 |
117.6 |
147.8 |
|
Percentage from animal products |
56.2 |
59.0 |
60.3 |
61.1 |
61.9 |
62.5 |
64.4 |
64.3 |
64.2 |
64.9 |
|
Carbohydrates (g/capita/day) |
184.8 |
235.4 |
269.1 |
300.0 |
334.4 |
362.3 |
387.4 |
415.6 |
478.0 |
584.5 |
|
Percentage from animal products |
3.0 |
3.3 |
3.4 |
3.5 |
3.5 |
3.5 |
3.6 |
3.6 |
3.6 |
3.6 |
|
Calories (kcal/capita/day) |
1 174.4 |
1 546.6 |
1 796.5 |
2 024.3 |
2 273.3 |
2 494.6 |
2 676.9 |
2 888.5 |
3 333.1 |
4 118.1 |
|
Percentage from animal products |
20.9 |
23.4 |
24.6 |
25.4 |
26.1 |
26.8 |
27.7 |
27.9 |
28.1 |
28.8 |
Source: Goskomstat (2001a), pp. 71, 74; Goskomstat (2001b), p. 76.
Certainly, these estimates of caloric consumption of the poor in the Russian Federation should be viewed with scepticism for a number of reasons. First, they probably underestimate food consumption due to the three biases of the Goskomstat HBS discussed above: the sampling bias towards low-income households, the apparent downward bias of Goskomstat food conversion coefficients and the apparent underestimate of in-kind food expenditure and consumption in the HBS, particularly for rural areas. Second, if the poor in the country actually consumed such low levels of dietary energy, this fact would probably be observed in anthropometric studies. But, as will be seen in Chapter 4, anthropometric studies point more to a malnourished and overnourished population lacking in micronutrients. Estimates of undernutrition in the Russian Federation using anthropometric data are not particularly high. Third, the percentage of people below the (total resources) poverty line (which includes both food and non-food items) was “only” 42 percent in 1999 and 33 percent in 2000 (Goskomstat, 2001d, pp. 42, 43). These estimates imply that 60-70 percent of the population had income exceeding the value of a “minimal” basket of food and non-food goods in these years. It is difficult to reconcile these figures with those indicating that each of the lowest five total resource deciles consumed (on average) less than the “minimal” basket of food. Third, these estimates are not consistent with FAO estimates of the portion of the Russian population with inadequate food intake based on commodity balances (6 percent). Sub-Saharan Africa has food inadequacy levels of 30 percent, and the Russian population shows neither the degree of poverty of that region nor anthropometric results similar to it.
Comparison of the HBS and AA survey results indicates that the HBS most likely underestimates food consumption for low-income households. The AA case study survey shows average caloric consumption quite a bit higher than the Goskomstat HBS figures for the lower total resource quintiles, despite considerably lower average total resources. For instance, the Goskomstat lowest total resource decile in Table 16 covers the poorest 10 percent of the Russian population. In order to make the caloric figure compatible with the AA survey results, it is recalculated using FAO food composition coefficients. But even this figure (1 326) is nearly 700 calories or over 50 percent less than the poorest 10 percent of individuals in the AA survey, who consumed an average of 1 995 calories. The second lowest total resource decile in Table 16 is also quite low compared to AA survey results. After recalculation using FAO food composition coefficients it is 1 738 calories, about 20 percent less than the second decile in the AA survey (2 176 calories). Certainly, the AA survey does not cover the poorest oblasts in the Russian Federation. However, the oblasts covered in the sample are not rich, but rather lower- to middle-income. So it is puzzling why the figures in Table 15 are so low, even when adjusted for different food conversion coefficients.
TABLE 16
Per capita caloric consumption by
monthly total resource decile, HBS and AA Surveys, 2000
|
By per capita monthly total resources1 |
HBS 2000 |
AA Survey |
|||
|
Total resources (roubles/capita/mo) |
Caloric consumption2 (kcal/capita/day) |
Caloric consumption3 (kcal/capita/day) |
Total resources (roubles/capita/mo) |
Caloric consumption3 (kcal/capita/day) |
|
|
Lowest decile |
425.4 |
1 190 |
1 326 |
222 |
1 995 |
|
Second decile |
635.9 |
1 568 |
1 738 |
418 |
2 176 |
|
Third decile |
798.1 |
1 816 |
2 005 |
582 |
1 935 |
|
Fourth decile |
968.2 |
2 050 |
2 260 |
688 |
2 273 |
|
Fifth decile |
1 156.6 |
2 302 |
2 529 |
821 |
2 191 |
|
Sixth decile |
1 385.3 |
2 476 |
2 718 |
965 |
2 280 |
|
Seventh decile |
1 677.3 |
2 626 |
2 876 |
1 101 |
2 223 |
|
Eighth decile |
2 070.5 |
2 868 |
3 124 |
1 317 |
2 376 |
|
Ninth decile |
2 593.3 |
3 109 |
3 388 |
1 560 |
2 551 |
|
Highest decile |
4 262.5 |
3 901 |
4 232 |
2 935 |
3 128 |
|
All households |
1 597.3 |
2 394 |
2 619 |
1 077 |
2 326 |
1. For AA survey, cash and plot incomes.
2. Using Goskomstat food conversion coefficients.
3. Using FAO food conversion coefficients.
Sources: Association Agro Food Security Survey, December 2000-January 2001; Goskomstat (2001d), p. 33; Goskomstat (2001b), pp. 46, 76.
The likely reason for underestimates of food consumption of poor households in the HBS is underestimation of in-kind food income. The AA survey indicates a higher portion of income received from in-kind sources for all total resource deciles (Table 17). Even taking into account the fact that the AA sample was considerably poorer than the HBS sample, the differences are striking, particularly in the lowest and highest total resource deciles.
TABLE 17
In-kind food income in HBS and AA
Surveys by monthly total resource decile, 2000
|
By per capita monthly total resources1 |
HBS 2000 (% of total resources) |
AA survey (% of cash & plot incomes) |
|
Lowest decile |
12.7 |
24.7 |
|
Second decile |
12.5 |
18.5 |
|
Third decile |
12.0 |
15.5 |
|
Fourth decile |
11.3 |
18.0 |
|
Fifth decile |
10.6 |
14.0 |
|
Sixth decile |
9.7 |
12.9 |
|
Seventh decile |
8.5 |
28.6 |
|
Eighth decile |
7.1 |
13.5 |
|
Ninth decile |
6.2 |
32.6 |
|
Highest decile |
4.8 |
52.7 |
|
All households |
7.9 |
28.0 |
1. For AA survey, cash and plot income.
Sources: Association Agro Food Security Survey, December 2000-January 2001; Goskomstat (2001d), p. 36.
Analysis of the AA survey indicates that raising income among the very poor (defined as the bottom three deciles of the AA survey) would doubtless lower food inadequacy. However, the income of the less poor would have to be raised much more in order to reduce food inadequacy. This implies that the greatest impact for reducing food inadequacy can be achieved from policies that address primarily the poorest. Forty-one percent of individuals in the AA survey case study consumed inadequate levels of food, using the FAO/WHO/UNU minimum dietary energy requirement of 1 970 calories (Table 18).[18] Analysis of food inadequacy by deciles reveals that this indicator does not rise monotonically with income. Instead, food inadequacy drops greatly after the first three income deciles. After the first three deciles, food inadequacy remains nearly constant until the ninth decile, when it again declines. A similar pattern can be discerned in the changes in the depth of food inadequacy indicator as income increases, though not as clearly. The depth of food inadequacy is calculated by comparing the consumption of a food-inadequate household with its minimum dietary requirement. The depth of food inadequacy gives the average food calorie shortfall of households below the minimum dietary requirement. The percentage of the food inadequate population is the same for a group of households just below the minimum energy requirement and a group far below this line. But the depth of food inadequacy is larger the further households are from the dietary energy requirement. The depth of food inadequacy diminishes with increases in income, though not monotonically.
TABLE 18
Food inadequacy of Russian individuals
in AA survey, by per capita cash and plot income decile
|
Per capita monthly cash and plot income |
Mean consumption (kcal/capita/day) |
Food inadequate |
|
|
Percent |
Depth of food inadequacy |
||
|
Lowest decile |
1 995 |
57 |
535 |
|
Second decile |
2 176 |
46 |
422 |
|
Third decile |
1 935 |
64 |
445 |
|
Fourth decile |
2 273 |
38 |
376 |
|
Fifth decile |
2 191 |
46 |
425 |
|
Sixth decile |
2 280 |
38 |
382 |
|
Seventh decile |
2 223 |
43 |
391 |
|
Eighth decile |
2 376 |
41 |
348 |
|
Ninth decile |
2 551 |
29 |
310 |
|
Highest decile |
3 128 |
13 |
311 |
|
All households |
2 326 |
41 |
407 |
Source: Association Agro Food Security Survey, December 2000-January 2001
The prevalence of food inadequacy in the AA survey was 41 percent (Table 18). This is a high figure, to be expected from a survey of poor households, and indicates (if correct) that the households surveyed seem to be in real difficulty. The results of a direct question to family respondents yielded an even higher figure of food insecurity. When household respondents were asked, “Do you consider that your family income is enough for providing your children with quality foodstuffs?”, only 14 percent answered yes, 77 percent answered no and 9 percent answered that it was difficult to say. This illustrates that the respondents’ subjective perception of either food inadequacy or malnutrition (it is not clear from the question) actually exceeded calculations based on a family-specific food inadequacy line.
|
BOX 1 Construction of household-specific minimum energy requirements for the Russian Federation Individuals of different sex and age groups require different levels of dietary energy in order to lead a healthy life. FAO/WHO/UNU publishes an aggregated estimate of the minimum dietary energy requirement compatible with a healthy sedentary lifestyle, based on the structure of the population of the Russian Federation (1 970 kcal/capita/day). However, for survey work, a minimum dietary energy requirement corresponding to the age-sex composition of the household must be calculated. This requires knowledge of minimum dietary energy requirements for each member of the household. These requirements can be estimated using information on the structure of the Russian population and on the relative energy requirements of the different age-sex groups. Russian statistical yearbooks report the age-sex composition of the Russian population using five categories (Table 19). The dietary energy of the official Russian Federation minimum food basket is based on dietary norms for these five categories. Using the population weights and the relative dietary requirements of the Russian norms, an estimate of dietary requirements implicit in the FAO/WHO/UNU aggregate requirement can be made. Note that the FAO/WHO/UNU minimum dietary requirement is uniformly lower than the official minimum food basket used for calculating the Russian poverty line. |
TABLE 19
Population structure and estimate of
age-sex specific nutrient requirements for the Russian Federation
| |
Working age |
Pensioners |
Children |
Weighted average |
||
|
Men |
Women |
0–6 yrs |
7–15 yrs |
|||
|
Russian Federation population structure, 1 January 2000 |
||||||
|
Population |
44 027 342 |
42 302 883 |
30 176 196 |
9 246 471 |
19 806 316 |
145 559 208 |
|
Population weights |
0.30 |
0.29 |
0.21 |
0.06 |
0.14 |
1.00 |
|
Nutrient levels of the official minimum consumption basket |
||||||
|
Kcal per person per day |
2 730 |
2 110 |
2 000 |
1 580 |
2 360 |
2 275 |
|
Relative |
1.20 |
0.93 |
0.88 |
0.69 |
1.04 |
1.00 |
|
Estimate of individual nutrient levels implicit in FAO/WHO/UNU minimum dietary energy requirement |
||||||
|
Kcal per person per day |
2 364 |
1 827 |
1 732 |
1 368 |
2 044 |
1 970 |
Sources: Government of the Russian Federation (2000); Goskomstat (2000b), p. 36.
The reasons for incidence of food inadequacy are considered here according to two determinants of access to food: location and family structure. Location seems to be an important determinant of access to food, because there are a number of remote areas of the Russian Federation (particularly in the north) to which physical access is impaired, thus raising the cost of supplying these regions. Add the transaction costs of delivering food to these regions (referred to in Chapter 2) and it is clear that location should be an important determinant of food access. Second, family structure was found to be a prime risk factor for poverty in the Russian Federation and other transition economies (World Bank, 2000) and therefore deserves separate consideration.
Much of the following analysis relies on analysis of information from the AA survey. These results should be interpreted with care. Without a well-specified sampling frame only qualitative judgments about the poor of the Russian Federation can be made. Absolute estimates using AA survey data do not accurately reflect the situation in the Russian population, but judgments of, for example, whether food inadequacy among the poor is more widespread in urban or rural residents are probably fair when based on AA survey data.
According to Goskomstat official figures, the oblasts subject to lowest food consumption are situated predominantly in the northern and far eastern parts of the Russian Federation not well-endowed with agricultural production (see Box 2). In some years (according to the Goskomstat HBS), the average caloric consumption of some oblasts fell below the FAO/WHO/UNU minimum dietary energy requirement of 1 970 calories. However, after correction for low food composition coefficients no oblast had average consumption lower than the 1 970 calories in any of the three years.
The fact that average food consumption does not fall below a food adequacy line does not mean that the poor in those regions are not in danger of food inadequacy. Quite low average energy supply for the regions may mean that sizeable proportions of the population consume less than the minimum energy requirement in some years (Figure 10). The figure shows the distribution of Russian oblasts by per capita dietary energy consumption calculated from Goskomstat household survey data for 1997, 1998 and 1999 (Goskomstat, 2001a). For most Russian oblasts, per capita dietary energy consumption was close to or higher than the sample mean of 2 302 calories. However, there were also seven oblasts in 1997 (Sakha Republic, Magadan, Republic of Komi, Perm, Ingush Republic, Orenburg and Sakhalin) and two in 1999 (Kamchatka and Samara) with per capita dietary energy consumption lower than 1 970 calories. Sakha, Magadan, Komi and Sakhalin (from 1997) and Kamchatka (1999) are examples of far northern and eastern regions. Other regions do not fit this description. Ingushetia (1997) has been greatly affected by military conflict. But there are also two regions (Orenburg and Perm in 1997) that are not disadvantaged in terms of weather conditions or geographic position, but still have very low average supplies of dietary energy.
|
BOX 2 Kamchatka Oblast: A case study of food insecurity in remote areas of the Russian Federation Kamchatka is a part of the far eastern and northern territories of the Russian Federation, which combined account for some 42 percent of the national territory, but for only less than 5 percent of its total population. To illustrate the remoteness of Kamchatka, Moscow is about as far from New York as it is from the oblast capital, Petropavlovsk Kamchatski. The largest industry in Kamchatka is commercial fishing and fish processing. Seventy percent of the total catch is exported. Kamchatka oblast also has significant deposits of minerals such as coal, natural gas and oil, nickel, platinum and gold, but their exploitation has been developed to a very limited extent. Kamchatka has remote northern areas which have been depressed since the end of Soviet-era producer and consumer subsidies and are now at high risk of food insecurity. Northern rural areas have no significant agricultural production and seasonally limited transport connections with the capital. Such areas cover practically the entire territory of Koryakski avtonomny okrug located in the north of the Kamchatka peninsula, the Commander Islands to the east of Kamchatka in the Pacific Ocean and some locations in the north of Kamchatka oblast. The total population in this area is estimated at 35 000. Hunting, fishing and forest foods therefore contribute significantly to household food security. The outreach of humanitarian aid, whether international or provided by the local government, is limited in these areas. Privatization of food trade has implications for food availability and prices in remote settlements. In Soviet times remote areas were supplied with all necessities for winter during the summer period, when transport is easy. During the long winter period people lived off the stocks built up previously. This was done on the basis of strong logistical planning and availability of resources, both financial and physical. The private traders who are now “in charge of” supplies within the context of the market mechanism face important constraints, including a relative shortage of working capital, implying the need for rapid turnover of funds and risk aversion. Consequently, they cannot fully supply long-lasting stocks of food in low effective demand areas. This results in shortages of basic necessities in remote areas, especially during the winter period, as well as in steep price differentials.
|
FIGURE 10
Distribution of Russian oblasts by per capita consumption of calories,
1997-1999
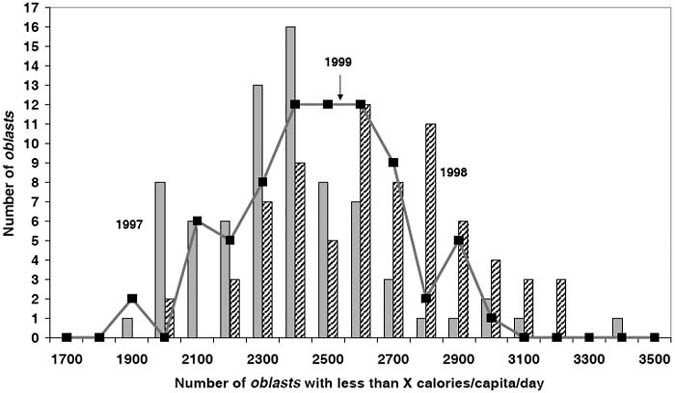
Source: Goskomstat (2001a).
Perhaps the most robust conclusion that emerges from study of information from the AA survey is that the incidence of food inadequacy among the poor is higher the more urban the settlement type. The larger the settlement, the lower the per capita consumption, the greater the percent of individuals undernourished and the greater the depth of food inadequacy.[19] These conclusions are evident from a study of Table 20, which shows a number of indicators from the AA Survey concerning food inadequacy by location of Russian individuals. The first data column shows the mean per capita caloric consumption of individuals in the sample. The second column indicates the food inadequacy percentage for the capital city of each oblast as a percentage of the same indicator for rural areas. The third column shows the percentage of individuals in the AA survey falling under the household-specific food adequacy line. The next column shows the depth of food inadequacy: by how many calories an average hungry person fell short of the minimum level of calories.
TABLE 20
Food inadequacy of Russian individuals
in AA survey, by location
| |
Mean consumption (kcal/capita/day) |
Ratio of food inadequacy in capital city to rural areas (%) |
Food inadequate population |
|
|
Percent |
Depth of food inadequacy |
|||
|
All household members |
2 326 |
|
41 |
407 |
|
By settlement type |
|
|
|
|
|
Oblast capital |
2 079 |
|
53 |
412 |
|
Other urban |
2 405 |
|
36 |
400 |
|
Rural households |
2 642 |
|
26 |
398 |
|
By oblast |
|
|
|
|
|
Khabarovsk |
2 319 |
230 |
46 |
402 |
|
Volgograd |
2 567 |
220 |
32 |
392 |
|
Leningrad |
2 085 |
450 |
55 |
381 |
|
Rostov |
2 231 |
240 |
48 |
472 |
|
Orel |
2 537 |
480 |
39 |
404 |
|
Omsk |
2 304 |
120 |
38 |
427 |
|
Novosibirsk |
2 380 |
400 |
36 |
380 |
|
Nizhnii Novgorod |
2 594 |
1 370 |
41 |
480 |
|
Moscow |
2 256 |
100 |
40 |
378 |
|
Kirov |
2 795 |
440 |
18 |
241 |
|
Sverdlovsk |
2 354 |
90 |
35 |
449 |
Source: Association Agro Food Security Survey, December 2000-January 2001
The greater food security of rural areas appears to be connected with the prevalence of private plots and their role as buffers against poverty. Eighty-nine percent of individuals in rural areas, 71 percent of individuals in other urban and only 46 percent of individuals in capital cities had private plots in the AA survey. Private plots were important for all respondents, but were particularly important for the households with lower incomes (Table 10, Table 12 and Table 13). In households that responded to the question about cash income categories, private plots raised incomes by 66 percent. However, in households in the lowest income category earning less than 200 roubles per month, private plots added more than seven times as much to household incomes as did cash receipts.
Table 21 illustrates that private plot incomes for households in the AA survey by oblast were generally more important in the “income from cash and plots” aggregate than in the Goskomstat “total resources” aggregate for the entire population. This is consistent with findings in Table 13 about underestimation of in-kind food income in the HBS, particularly in rural areas.
TABLE 21
In-kind food income in AA survey income
and Goskomstat total resources, by location (percent)
|
Oblast |
AA Survey |
HBS (Q 4 2000) |
|
Khabarovsk |
36 |
7.3 |
|
Volgograd |
24 |
10 |
|
Leningrad |
3 |
3.8 |
|
Rostov |
8 |
8.5 |
|
Orel |
37 |
13.7 |
|
Omsk |
39 |
14.1 |
|
Novosibirsk |
33 |
13.3 |
|
Nizhnii Novgorod |
32 |
7.8 |
|
Moscow |
16 |
4.5 |
|
Kirov |
45 |
14.1 |
|
Sverdlovsk |
17 |
6.8 |
Sources: Association Agro Food Security Survey, Dec. 2000-Jan. 2001, Goskomstat (2001c), p. 109.
In a recent World Bank publication on poverty in Europe and Central Asia children were listed as one of the primary population groups with a higher incidence of poverty than others (World Bank, 2000). It is therefore interesting to see whether children are also an important risk factor for food security. It cannot be said that children particularly are a greater risk factor than other family members, though additional family members do seem to be so.
Household average calorie and protein consumption per capita decline as the number of children increases (Table 22). However, the same is true of any addition to the number of family members in the household (Table 23).
Neither does the AA survey data shed light on the question of whether adding a child to a family increases the risk of food inadequacy. Certainly adding a member to a family seems to increase the risk of food inadequacy. The lowest-risk families are those composed of one member, followed by those with two adults. Additional family members beyond that increase food inadequacy.
|
BOX 3 Republic of Tyva: Ethnicity and poverty in rural areas The Republic of Tyva is in eastern Siberia next to the Mongolian border. Access to other Russian regions is through two roads, one of which is often impassable during the winter. Tyva is considered one of the poorest regions in the Russian Federation. According to official statistics, 70 percent of the population receives income under the minimum consumption basket. In 2000, 87 percent of the Tyva republic budget was financed by the Russian federal government. Rural areas of Tyva are populated nearly entirely by native Tyvans. After the break-up of the Soviet Union a large part of the Russian population left Tyva. Those Russians that stayed live predominantly in the capital, Kyzyl, since poverty is concentrated in the countryside. Native Tyvans usually do not have the option of emigration from the republic, because they do not have friends or relatives in other oblasts and they speak little or no Russian. The traditional occupation of rural Tyvans is itinerant livestock breeding. Eighty percent of agricultural production comes from the livestock sector. Even though Tyvans are native livestock specialists, by and large they do not market their products. Of 45 000 cows in Tyva, only 1 000 are located within a 30 km radius of Kyzyl, even though almost half of Tyva’s population lives there. Most milk produced by Tyvan cows is processed into butter, a large loss of potential revenue. This is partly due to the fact that livestock rearing is not considered a real business, but is primarily for self-consumption and barter. Another lost income opportunity is Tyva’s 25 000 ha of irrigated land suitable for vegetable and potato production. This potential source of income is underutilized because native Tyvans prefer livestock breeding. Vegetable and potato prices in Tyva are five times the Russian average and higher than in other Siberian oblasts and current vegetable yields reach 8-10 tonnes per ha on irrigated land. But only 780 ha are used for that purpose. In recent years Koreans from Kazakhstan have come to grow vegetables and melons on irrigated land. They have built temporary secondary or tertiary irrigation canals allowing irrigation throughout the growing season, resulting in high yields. The heavy emphasis on itinerant livestock breeding means that Tyva has a food production pattern highly skewed toward meat production. Potato production in Tyva is one-tenth that of the Russian average, vegetable production is 0.15 that of the Russian average, but meat production is 113 percent of that of the Russian Federation. More importantly, a large portion of meat production is self-consumed or given as gifts, leaving little room for development of a meat export industry in Tyva.
|
TABLE 22
Nutritive content of food consumed by
households, by number of children, 2000
|
Number of children in household |
1 child |
2 children |
3 children |
4+ children |
Hh under poverty line |
|
Protein (grams/capita/day) |
54 |
49 |
45 |
38 |
43 |
|
Fat (grams/capita/day) |
71 |
60 |
50 |
40 |
51 |
|
Carbohydrates (grams/capita/day) |
298 |
285 |
276 |
250 |
256 |
|
Calories (kcal/capita/day) |
2 056 |
1 882 |
1 740 |
1 515 |
1 662 |
Source: Goskomstat (2001a), pp. 72-73.
TABLE 23
Nutritive content of food consumed by
households, by family size, 2000
|
Household size |
All families |
1 person |
2 people |
3 people |
4 people |
5+ people |
|
Protein (grams/capita/day) |
61 |
102 |
76 |
66 |
52 |
48 |
|
Fat (grams/capita/day) |
79 |
135 |
100 |
79 |
66 |
58 |
|
Carbohydrates (grams/capita/day) |
348 |
627 |
439 |
327 |
291 |
277 |
|
Calories (kcal/capita/day) |
2 352 |
4 142 |
2 972 |
2 265 |
1 975 |
1 826 |
Source: Goskomstat (2001a), pp. 72-73.
Food inadequacy has many correlates, and it is preferable to address them simultaneously. Only using such an approach can the contributions of location, income and family structure to food inadequacy be separated in quantitative terms. But to follow this approach a model structure must be imposed on the data used, which inevitably complicates the discussion. In the preceding sections the major factors leading to food inadequacy were described, which suggests a model specification to test using AA survey information.
Using data in the AA survey, a test for whether adding children to a family increases the risk of food inadequacy can be constructed. This model must also simultaneously take into account other factors which were found to have been correlated with food inadequacy. These are factors such as location and household income (cash and plot income). It would also be useful to know, in general, which factors are most important in determining whether families are undernourished or not. To answer these questions family-level food inadequacy is modelled using the following explanatory variables, based on the previous discussion:
HHINCOME = the monthly family (cash and plot) income
NUMCHILD = the number of children in the family
NUMPENS = the number of pensioners in the family
WKAGE = the number of working-age persons in the family
LOC1 = dummy variable indicating that the household resided in an oblast capital
LOC3 = dummy variable indicating that the household resided in a rural area
TABLE 24
Food inadequacy of Russian individuals
from AA survey, by household type
|
Household type |
Mean consumption (kcal/capita/day) |
Food inadequate population |
|
|
Pct |
Depth |
||
|
All household members |
2 326 |
41 |
407 |
|
Children |
2 259 |
42 |
415 |
|
Pensioners |
2 537 |
28 |
349 |
|
By household type |
|
|
|
|
2 adults only |
2 608 |
28 |
380 |
|
2 adults no children, with relatives |
2 317 |
43 |
431 |
|
2 adults with 1 2 children only |
2 142 |
48 |
426 |
|
2 adults with 1 2 children and relatives |
2 209 |
45 |
398 |
|
2 adults with 3+ children only |
2 128 |
50 |
444 |
|
2 adults with 3+ children and relatives |
2 650 |
35 |
287 |
|
1 adult only |
3 341 |
16 |
221 |
|
1 adult, no children, relatives |
2 099 |
62 |
222 |
|
1 adult, 1 2 children, no relatives |
2 304 |
34 |
351 |
|
1 adult, 1 2 children, relatives |
1 811 |
41 |
404 |
|
1 adult, 3+ children, no relatives |
1 665 |
73 |
382 |
|
Pensioner family of 1 |
2 873 |
19 |
310 |
Source: Association Agro Food Security Survey, December 2000-January 2001.
To model food inadequacy, a dependent variable BELOW is used. BELOW is a 0-1 variable equal to 1 if the total household monthly calories consumed < a household-specific minimum, and equal to 0 otherwise. The variables HHINCOME, NUMCHILD, NUMPENS, WKAGE, LOC1 and LOC3 are used in the binomial logit regression model to explain whether the variable BELOW takes on a value of 0 or 1.
The results of the binomial logit regression are shown in Table 25. The F-test provides a formal hypothesis test of whether all the coefficients are simultaneously equal to zero. This is equivalent to testing the null hypothesis that the fit of the equation is not significantly better than that provided by using the mean of BELOW to predict the value of BELOW. The results of the test are quite good with the probability of F virtually zero. Thus, we should reject the null hypothesis. The T statistics on the coefficients are significant as well.
TABLE 25
Survey binomial logit regression for
family-level food inadequacy using AA survey data
|
F(6, 115) = 22.44 |
Description |
Coefficient |
T Stat. |
|
Dependent variable |
|||
|
BELOW |
1 if undernourished HH, 0 if not |
|
|
|
Independent variables |
|||
|
HHINCOMEMO |
HH total income |
0.000 |
-7.36 |
|
NUMCHILD |
Number of children in HH |
0.585 |
6.63 |
|
NUMPENS |
Number of pensioners in HH |
0.437 |
4.03 |
|
WKAGE |
Number of working age in HH |
0.538 |
8.22 |
|
LOC1 |
Location: Oblast capital |
0.782 |
4.86 |
|
LOC3 |
Location: Rural |
-0.169 |
-2.88 |
|
CONSTANT |
CONSTANT |
-1.658 |
-9.65 |
Source: Calculations from Association Agro Food Security Survey, December 2000-January 2001
The signs of the coefficients in Table 25 make sense. The negative sign on HH monthly income indicates that the higher HH income, the less probable it is that the household will be undernourished. The positive signs on the family member variables indicate that the risk of family food inadequacy is increased with an increase in the number of children, pensioners or working age persons. The positive sign on the oblast capital dummy indicates that there is a higher risk of food inadequacy (above the default location, other urban areas) for families located in capital cities. The negative sign on the rural dummy indicates that living in a rural area diminishes the probability of food inadequacy.
The coefficients on the variables indicate by how much a 1-unit increase in the variable increases the probability of food inadequacy in the family. Since the value of each coefficient depends on the units used, only values of similar variables can be compared. For instance, comparisons can be made between household member variables and between location variables, but it does not make sense to compare between the household income coefficient and household member coefficients.
TABLE 26
Results of Wald tests to determine
statistical differences between coefficients on variables in Table
25
|
Test |
F Value |
Prob F>0 |
Accept? |
|
H0: NUMCHILD=NUMPENS=WKAGE |
0.74 |
0.4770 |
Accept |
|
H0: NUMCHILD=NUMPENS |
1.36 |
0.2461 |
Accept |
|
H0: NUMCHILD=WKAGE |
0.2 |
0.6532 |
Accept |
|
H0: LOC1=LOC3 |
39.66 |
0.000 |
Reject |
Source: Calculations from Association Agro Food Security Survey, December 2000-January 2001
The regression results indicate that being located in an oblast capital raises the probability of food inadequacy more than being located in a rural area diminishes it. They also appear to indicate that raising the number of children in the household increases the probability of food inadequacy slightly more than increasing the number of working age persons (not necessarily all of whom are employed). Raising the number of pensioners in the household by one person seems to affect the probability of food inadequacy least. However, the similarity of the coefficients in Table 25 indicates that we should test formally to determine whether in fact these coefficients are statistically different from each other. For this reason, Wald tests were performed on the family member coefficients, as well as on the location variables (Table 26). The test results illustrate that it is not possible to distinguish statistically between the effect of adding a child, pensioner or working age adult to the family. What matters is the number of family members, not whether they are children, pensioners or working age adults. However, the difference in location coefficients is statistically significant.
|
[12] Shetty (2002) makes this
distinction clearly. Food inadequacy and undernutrition are different, though
related, terms. Food inadequacy refers to food intake that is continuously
insufficient to meet dietary energy requirements. Undernutrition is a state of
being, the result of inadequate food consumption, poor absorption and/or poor
biological use of nutrients consumed. Food inadequacy can be measured by
comparing food intake with a reference level, while undernutrition is a state,
often measured by comparing anthropometric indicators to a reference
population. [13] The 11 oblasts were representative of European Russia, Siberia and included one oblast from the Far East. They were Khabarovsk, Volgograd, Leningrad, Rostov, Orel, Omsk, Novosibirsk, Nizhnii Novgorod, Moscow, Kirov and Sverdlovsk. [14] Falkinham and Kanji (2000) assess the limitations of the Goskomstat HBS. [15] The oblast-level statistical committees do not supply such information to Goskomstat. [16] The income estimate for households earning above 3 000 roubles in cash income assumed that households in this category in fact earned 4 000 roubles. [17] For a fuller explanation of measurement problems for assessing poverty in the Russian Federation, see Klugman (1997), Falkingham and Kanji (2000) and Ovcharova (2001). [18] Estimation of the percent of food inadequate population in the AA survey required construction of household-specific minimum dietary energy requirements compatible with a healthy sedentary lifestyle (Box 1). [19] In oblasts with higher urban populations the percent of undernourished individuals is greater. In more rural oblasts the percent of food inadequacy is less. The only exceptions to this general pattern are Moscow and Sverdlovsk oblasts. |
![]()
![]()
![]()