


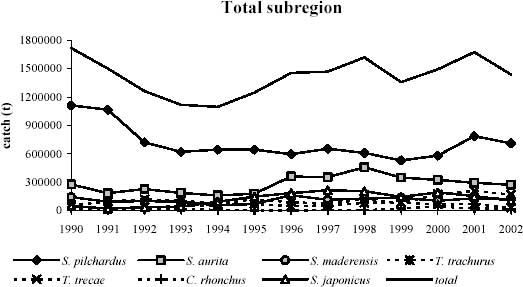
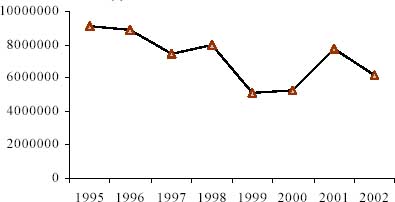
Figure 1.8.1a: Catches (1990-2002) in
the subregion by species and year (weight in tonnes)/Captures (1990-2002) dans
la sous-région par espèce et par année (poids en
tonnes)
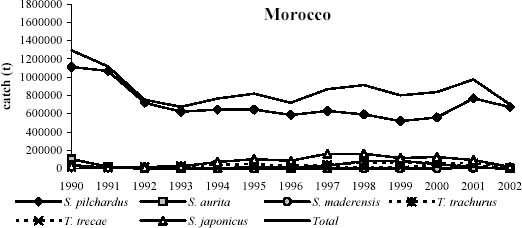
Figure 1.8.1b: Catches (1990-2002) in
Morocco by species and year (weight in tonnes)/Captures (1990-2002) au Maroc par
espèce et par année (poids en tonnes)
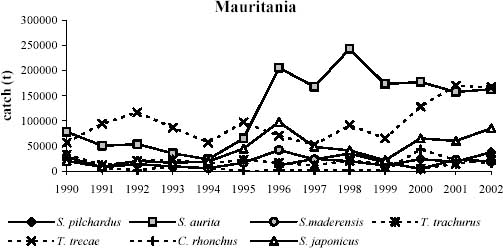
Figure 1.8.1c: Catches (1990-2002) in
Mauritania by species and year (weight in tonnes)/Captures (1990-2002) en
Mauritanie par espèce et par année (poids en tonnes)
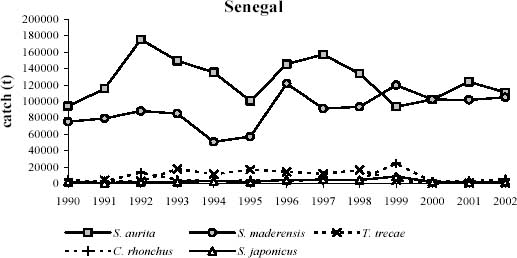
Figure 1.8.1d: Catches (1990-2002) in
Senegal by species and year (weight in tonnes)/Captures (1990-2002) au
Sénégal par espèce et par année (poids en
tonnes)
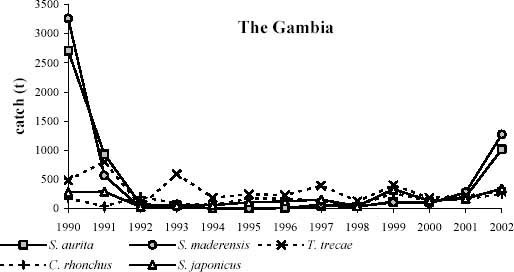
Figure 1.8.1e: Catches (1990-2002) in
the Gambia by species and year (weight in tonnes)/Captures (1990-2002) en Gambie
par espèce et par année (poids en tonnes)
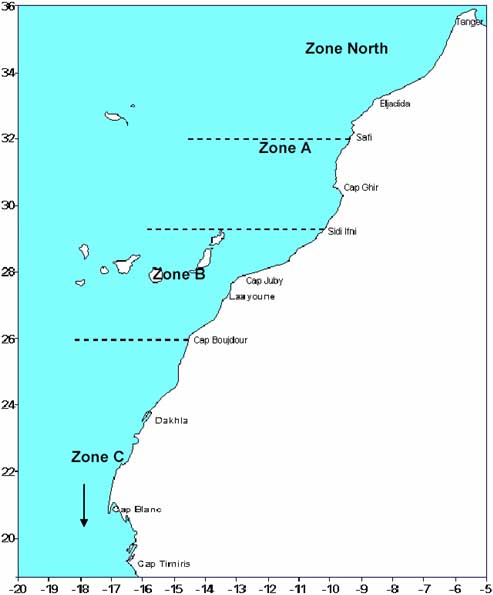
Figure 2.1.1: Stock units and sardine
fisheries/Unités de stock et pêcheries de sardine.
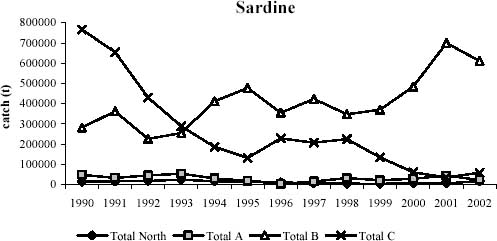
Figure 2.2.2: Catches (1990-2002) of
Sardina pilchardus by zone and year (weight in tonnes)/Captures (1990-2002) de
Sardina pilchardus par zone et année (poids en tonnes)
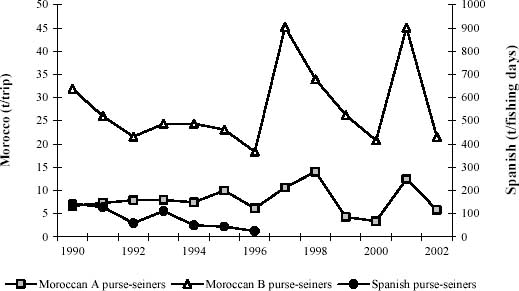
Figure 2.3.1a: CPUE (1992-2002) of
Sardina pilchardus by fishery in zone A+B (catch in tonnes; effort in positive
trips or fishing days)/CPUE (1992- 2002) de Sardina pilchardus par
pêcherie dans les zones A+B (capture in tonnes; effort en sorties
positives ou jours de pêche)
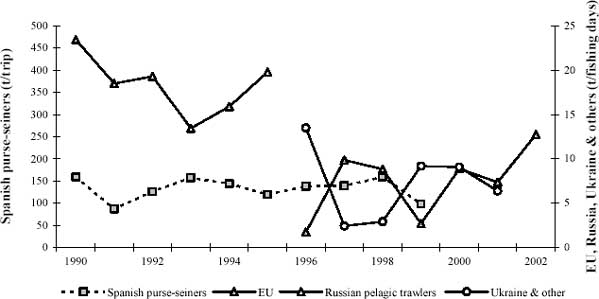
Figure 2.3.1b: CPUE (1992-2002) of
Sardina pilchardus by fishery in zone C (catch in tonnes; effort in fishing
days)/CPUE (1992-2002) de Sardina pilchardus par pêcherie dans la zone C
(capture in tonnes; effort en jours de pêche)
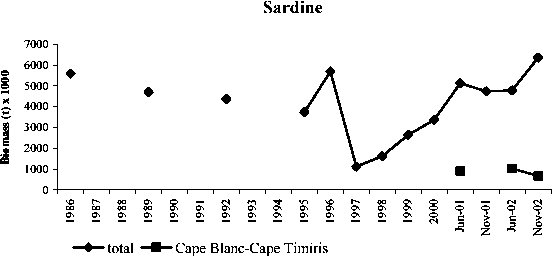
Figure 2.3.2: Biomass estimates
(1986-2002) of Sardina pilchardus for zones A,B and C, and in Mauritania zone,
R/V DR. FRIDTJOF NANSEN (weight in thousand tonnes)/Evaluations de la biomasse
(1986-2002) de Sardina pilchardus pour les zones A,B et C, et dans la zone de la
Mauritanie, N/R DR. FRIDTJOF NANSEN (poids en milliers tonnes)

Cape Cantin-Cape Juby
Cape Juby-Cape Bojador
Cape Bojador-Cape Blanc
Cape Blanc-Cape Timiris
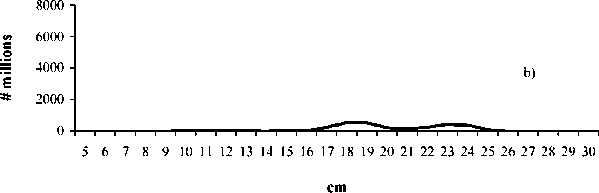
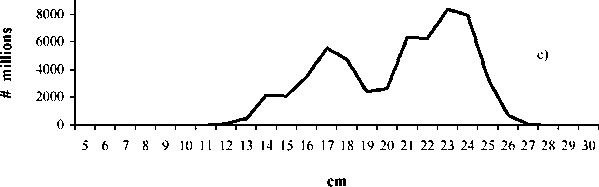
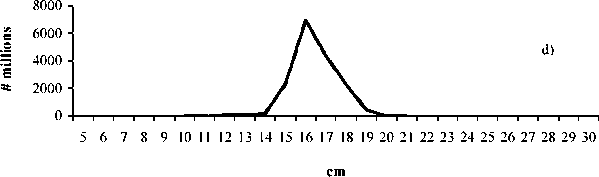
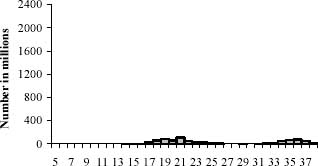
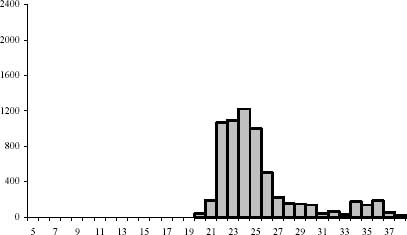
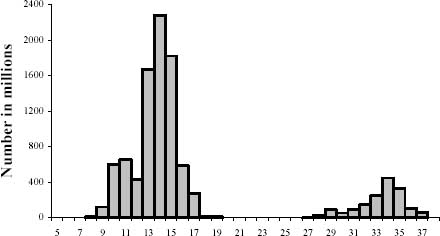
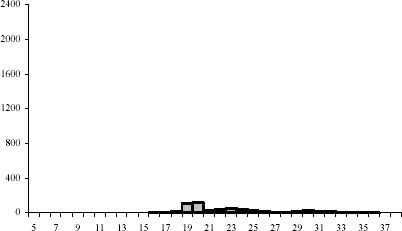
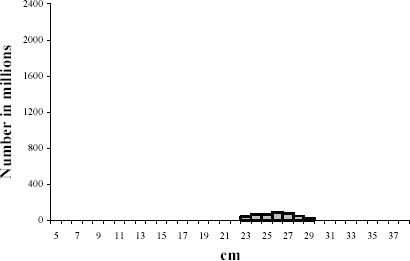
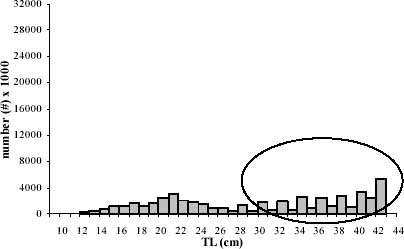
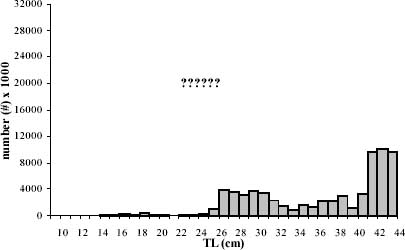
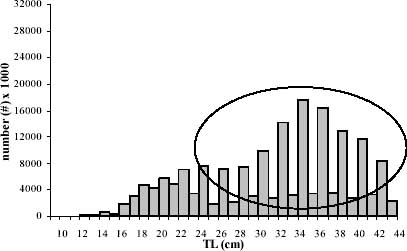
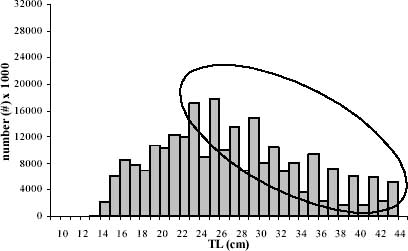
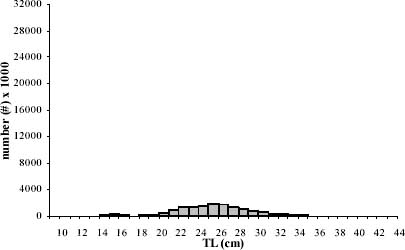
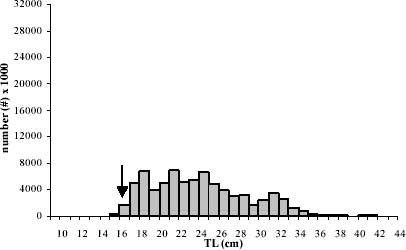
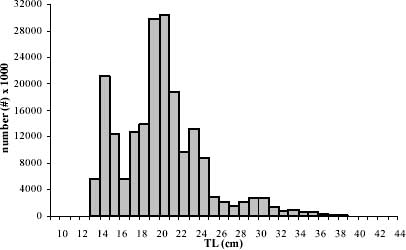
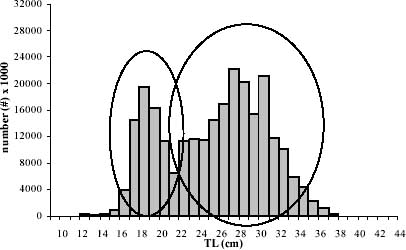
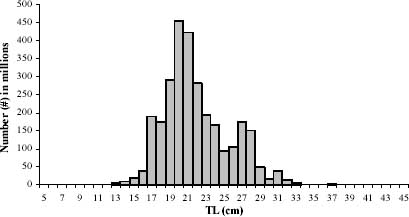
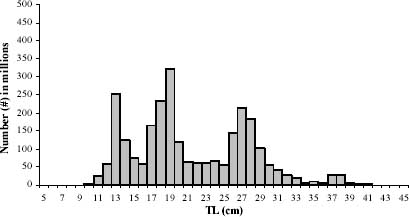
Figure 2.3.3a,b,c,d: Length-frequency
distribution (2002) of Sardina pilchardus in zone Cape Cantin-Cape Juby (a),
zone Cape Juby-Cape Bojador (b), zone Cape Bojador-Cape Blanc (c) and zone Cape
Blanc-Cape Timiris (d) (in millions)/Distribution de fréquence des
tailles (2002) de Sardina pilchardus dans la zone Cap Cantin-Cap Juby (a), la
zone Cap Juby-Cap Bojador (b), la zone Cap Bojador-Cap Blanc (c) et la zone Cap
Blanc-Cap Timiris (d) (en millions)
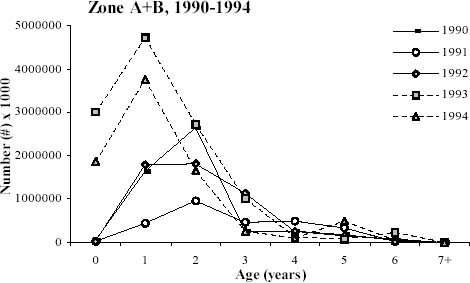
Figure 2.6.3a: Catch-at-age by year
class (1990-1994) for Sardina pilchardus in zone A+B (in thousands)/Capture par
classe d'âge (1990-1994) de Sardina pilchardus (en milliers) dans les
zones A+B
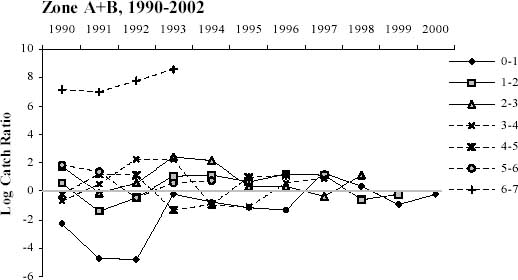
Figure 2.6.3b: Log catch ratio
(1990-2000) for Sardina pilchardus in zone A+B/Log du taux de capture
(1990-2000) de Sardina pilchardus dans les zones A+B
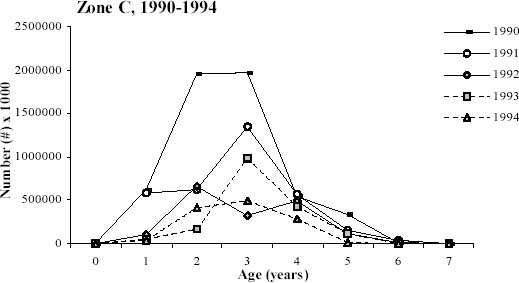
Figure 2.6.4a: Catch-at-age by year
class (1990-1994) for Sardina pilchardus in zone C (in thousands)/Capture par
classe d'âge (1990-1994) de Sardina pilchardus (en milliers) dans la zone
C.
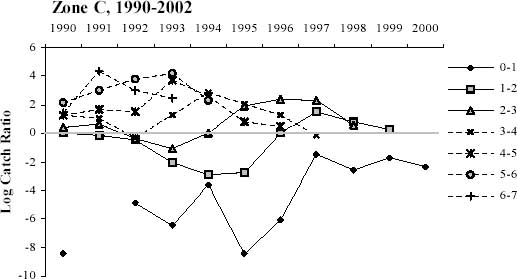
Figure 2.6.4b: Log catch ratio
(1990-2000) for Sardina pilchardus in zone C/Log du taux de capture (1990-2000)
de Sardina pilchardus dans la zone C
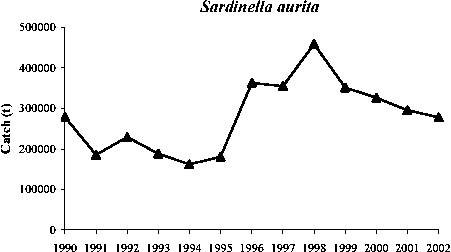
Figure 3.2.1a: Catches (1990-2002) of
Sardinella aurita by year (weight in tonnes)/Captures (1990-2002) de Sardinella
aurita par année (poids en tonnes)
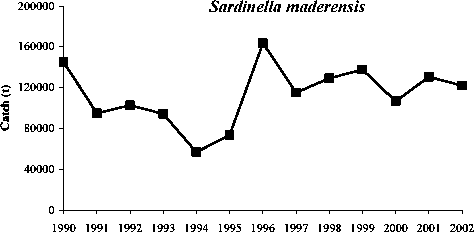
Figure 3.2.1b: Catches (1990-2002) of
Sardinella maderensis by year (weight in tonnes)/Captures (1990-2002) de
Sardinella maderensis par année (poids en tonnes)
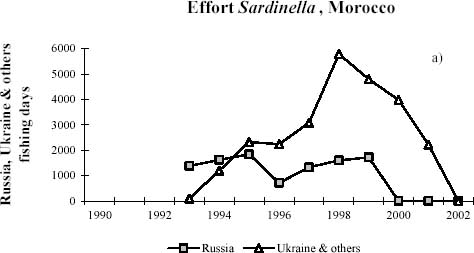
Effort Sardinella, Morocco
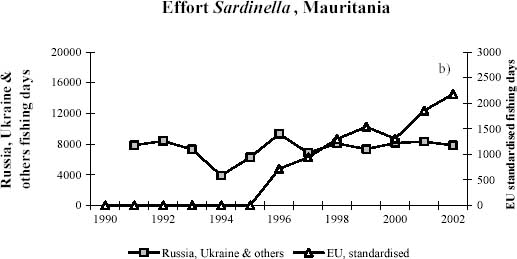
Effort Sardinella, Mauritania
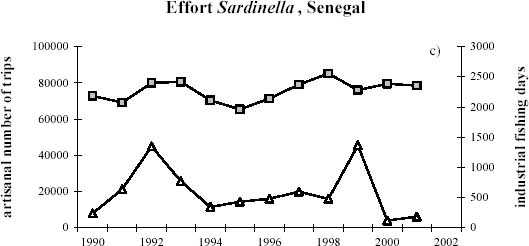
Effort Sardinella, Senegal
Figure 3.2.2a,b,c: Effort (1990-2002)
of Sardinella spp. by fleet and year in Morocco (a), Mauritania (b) and Senegal
(c) (effort in fishing days or number of trips)/Effort (1990-2002) de Sardinella
spp. par flottille et année au Maroc (a), en Mauritanie (b) et au
Sénégal (c) (effort en jours de pêche ou nombre de
sorties)
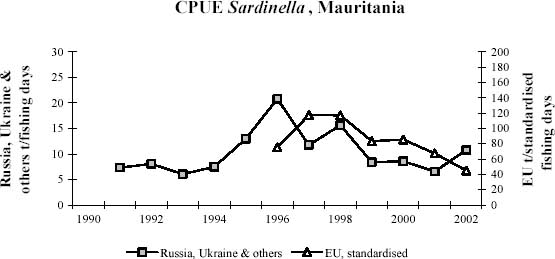
Figure 3.3.1.1: CPUE (1990-2002) of
Sardinella spp. by fishery in Mauritania (catch in tonnes; effort in fishing
days)/CPUE (1990-2002) de Sardinella spp. par pêcherie en Mauritanie
(capture en tonnes; effort en jours de pêche
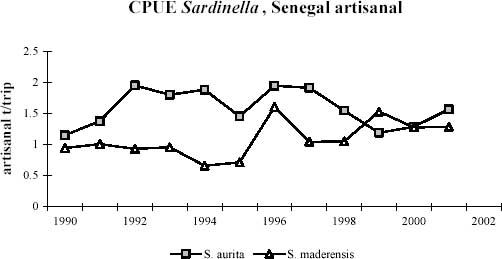
Figure 3.3.1.2: CPUE (1990-2002) of
Sardinella spp. by species for artisanal fishery in Senegal (catch in tonnes;
effort in number of trips)/CPUE (1990- 2002) de Sardinella spp. par
espèces pour la pêcherie artisanale au Sénégal
(capture en tonnes; effort en nombre de sorties)
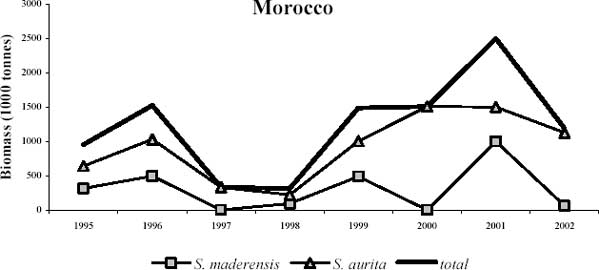
Figure 3.3.2.1: Biomass estimates
(1995-2002) of Sardinella aurita and S. maderensis for Morocco, R/V DR. FRIDTJOF
NANSEN (weight in thousand tonnes)/Evaluations de la biomasse (1995- 2002) de
Sardinella aurita et S. maderensis pour le Maroc, N/R DR. FRIDTJOF NANSEN (poids
en milliers de tonnes)
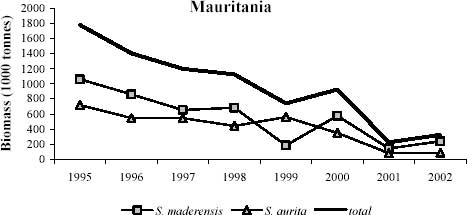
Figure 3.3.2.2: Biomass estimates
(1995-2002) of Sardinella aurita and S. maderensis for Mauritania, R/V DR.
FRIDTJOF NANSEN (weight in thousand tonnes)/Evaluations de la biomasse (1995-
2002) de Sardinella aurita et S. maderensis pour la Mauritanie, N/R DR. FRIDTJOF
NANSEN (poids en milliers de tonnes)
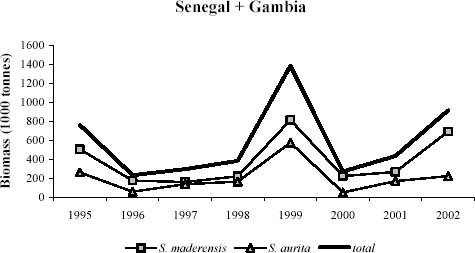
Figure 3.3.2.3: Biomass estimates
(1995-2002) of Sardinella aurita and S. maderensis for Senegal and the Gambia,
R/V DR. FRIDTJOF NANSEN (weight in thousand tonnes)/Evaluations de la biomasse
(1995-2002) de Sardinella aurita et S. maderensis pour le Sénégal
et la Gambie, N/R DR. FRIDTJOF NANSEN (poids en milliers de
tonnes)
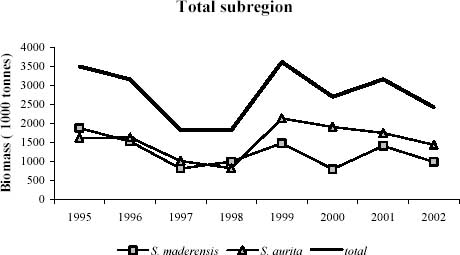
Figure 3.3.2.4: Biomass estimates
(1995-2002) of Sardinella aurita and S. maderensis for the northern subregion,
R/V DR. FRIDTJOF NANSEN (weight in thousand tonnes)/Evaluations de la biomasse
(1995-2002) de Sardinella aurita et S. maderensis pour la sousrégion
nord, N/R DR. FRIDTJOF NANSEN (poids en milliers de tonnes)
Morocco May-July 2002
Morocco Nov.-Dec. 2002
Mauritania May-July 2002
Mauritania Nov.-Dec. 2002
Senegal + Gambia May-July 2002
Senegal + Gambia Nov.-Dec. 2002
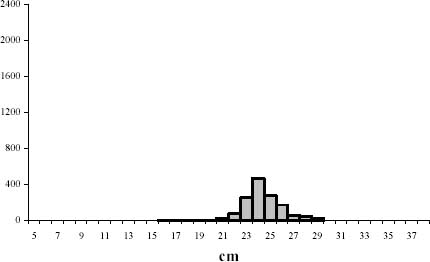
Figure 3.5.1: Length-frequency
distribution (2002) of Sardinella aurita in Morocco, Mauritania, Senegal and the
Gambia, May-July and November- December in millions of individuals/Distribution
de fréquence des tailles (2002) de Sardinella aurita au Maroc, en
Mauritanie, Sénégal et le Gambie, mai-juillet et
novembre-décembre (en millions)
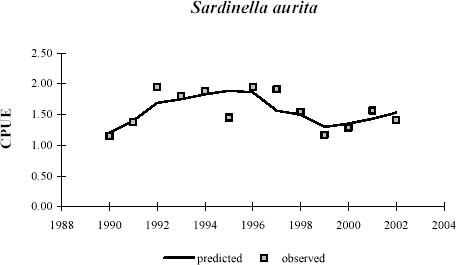
Figure 3.6.1: Observed and predicted
CPUE index using CPUE (tonnes/trips) of Senegal artisanal fishery (1990-2002)
for Sardinella aurita/Indices des CPUE observés et prévus en
utilisant les indices de CPUE (tonnes/voyages) de la pêcherie artisanale
du Sénégal (1990-2002) pour Sardinella aurita
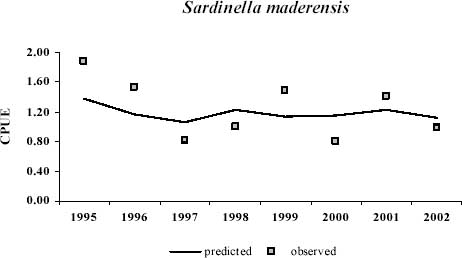
Figure 3.6.2: Observed and predicted
CPUE index using biomass estimates from R/V DR. FRIDTJOF NANSEN (1995-2002) for
Sardinella maderensis/Indices des CPUE observés et prévus en
utilisant les estimations de biomasse du N/R DR. FRIDTJOF NANSEN (1995-2002)
pour Sardinella maderensis
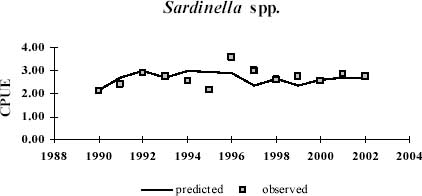
Figure 3.6.3: Observed and predicted
CPUE index using (1990-2002) CPUE from Senegal artisanal fishery for Sardinella
spp./Indices des CPUE observés et prévus en utilisant les indices
de CPUE de la pêcherie artisanale du Sénégal (1990-2002)
pour Sardinella spp.
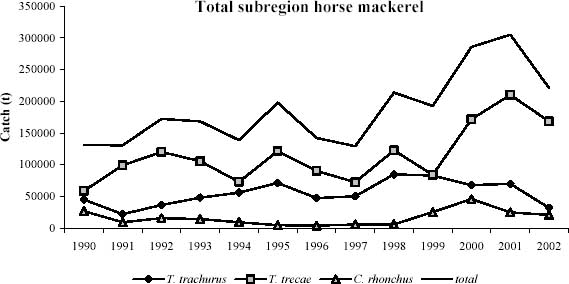
Figure 4.2.1: Total catches
(1990-2002) of horse mackerel in the subregion by species and year (weight in
tonnes)/Captures totales (1990-2002) de chinchards dans la sous-région
par espèce et par année (poids en tonnes)
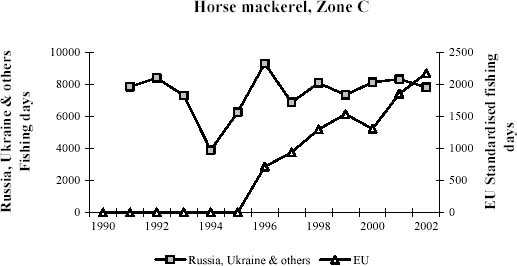
Figure 4.2.2: Effort (1990-2002) of
horse mackerel by fleet and year in zone C + Mauritania (effort in fishing
days)/Effort (1990-2002) de chinchards par flottille et par année dans la
zone C + Mauritanie (effort en jours de pêche)
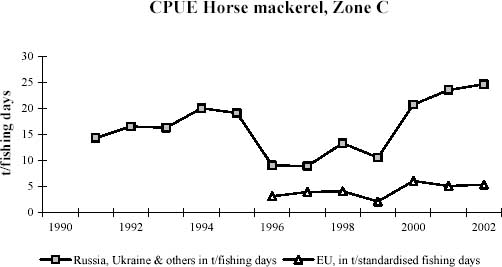
Figure 4.3.1: CPUE (1990-2002) of
horse mackerel by fishery and year in Zone C + Mauritania (catch in tonnes;
effort in fishing days)/CPUE (1990-2002) de chinchards par pêcherie et par
année dans la Zone C + Mauritanie (captures en tonnes; effort en jours de
pêche)
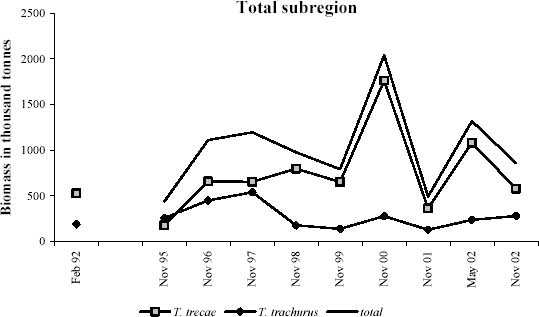
Figure 4.3.2: Biomass estimates
(1995-2002) of Trachurus trachurus and Trachurus trecae for the subregion, R/V
DR. FRIDTJOF NANSEN (weight in thousand tonnes)/Estimation de biomasse
(1995-2002) de Trachurus trachurus et Trachurus trecae pour la
sous-région, N/R DR. FRIDTJOF NANSEN (poids en milliers de
tonnes)
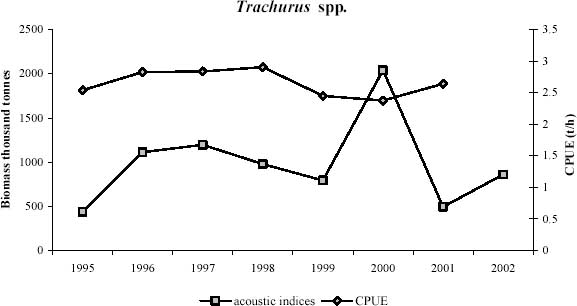
Figure 4.3.3: Trends in biomass
indices and CPUE of Trachurus spp. in the subregion (biomass in thousand tonnes;
catch in tonnes; effort in fishing hours)/Tendances dans les indices de biomasse
et les CPUE de Trachurus spp. dans la sous-région (biomasse en milliers
de tonnes; capture en tonnes; effort en hors de pêche)
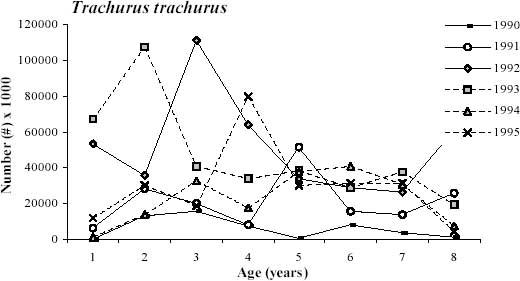
Figure 4.6.1: Catch-at-age by year
class (1990-1995) for Trachurus trachurus in the northern subregion (in
thousands)/Capture par âge par classe d'année (1990-1995) pour
Trachurus trachurus dans la sous-région nord (en milliers)
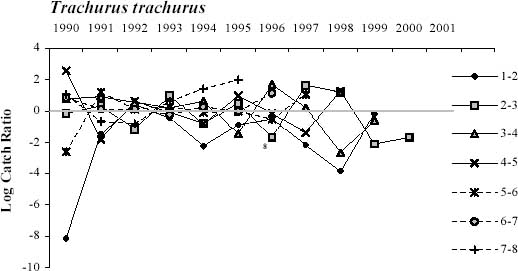
Figure 4.6.2: Log catch ratio
(1990-2000) for Trachurus trachurus in the subregion/Log du taux de capture
(1990-2000) de Trachurus trachurus dans la sous-région
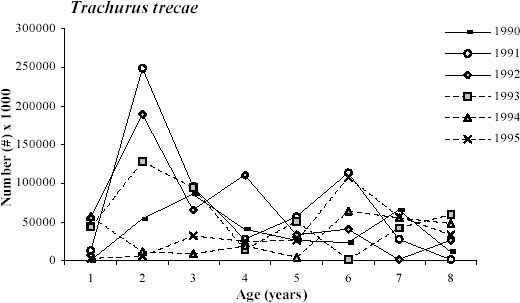
Figure 4.6.3: Catch at age by year
class (1990-1995) for Trachurus trecae in the subregion (in thousands)/Capture
par âge par classe d'année (19901995) de Trachurus trecae dans la
sous-région (en milliers)
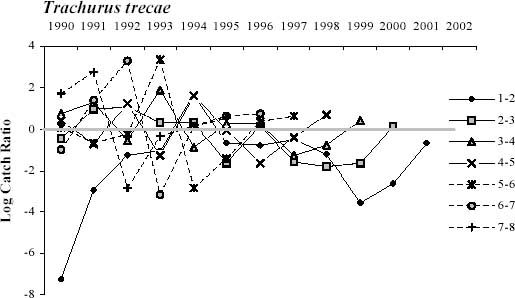
Figure 4.6.4: Log catch ratio
(1990-2001) for Trachurus trecae in the subregion/Log du taux de capture
(1990-2001) de Trachurus trecae dans la sousrégion
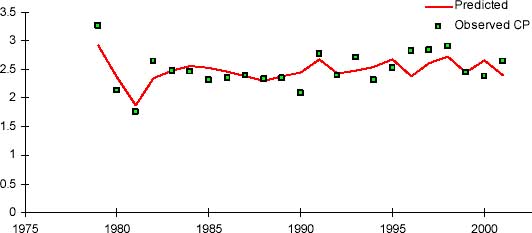
Figure 4.6.5: Observed and predicted
CPUE index using (1979-2001) effort standard effort from Mauritanian zone for
Trachurus spp./Indices des CPUE observés et prévus en utilisant
les estimations de CPUE avec l'effort standard de la zone Mauritanie (1979-2002)
pour Trachurus spp.
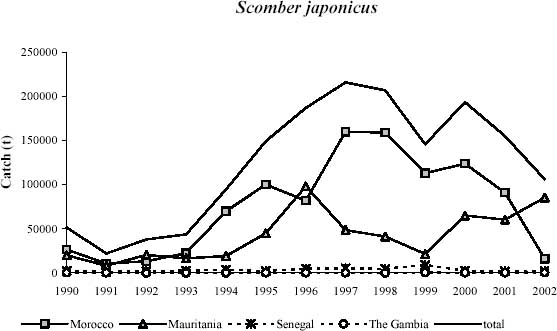
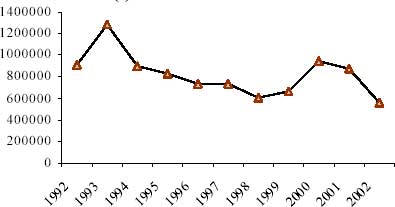
Figure 5.2.1: Catches (1990-2002) of
Scomber japonicus by countries and year (weight in tonnes)/Captures (1990-2002)
de Scomber japonicus par pays et par année (poids en
tonnes)
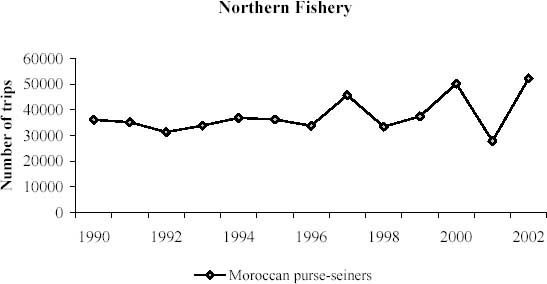
Figure 5.2.2a: Effort (1990-2002) of
Scomber japonicus by fleet and year for the northern fishery (effort in fishing
days)/Effort (1990-2002) de Scomber japonicus par flottille et par année
pour la pêcherie du nord (effort en jours de pêche)
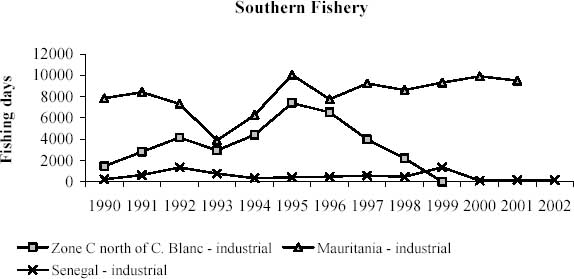
Figure 5.2.2b: Effort (1990-2002) of
Scomber japonicus by fleet and year for the southern fishery (effort in fishing
days)/Effort (1990-2002) de Scomber japonicus par flottille et année pour
la pêcherie du sud (effort en jours de pêche)
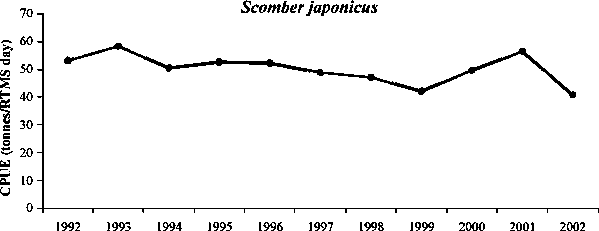
Figure 5.3.1: CPUE (1992-2002) of
Scomber japonicus by year for the total (northern+southern) fishery (catch in
tonnes; effort in RTMS days)/CPUE (1992-2002) de Scomber japonicus par
année pour la pêcherie totale (nord+sud) (capture en tonnes; effort
en jours RTMS).
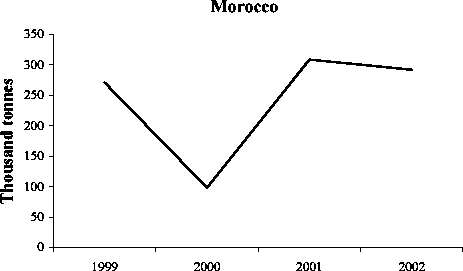
Figure 5.3.2: Biomass estimates
(1999-2002) of Scomber japonicus for Morocco, R/V DR. FRIDTJOF NANSEN (weight in
thousand tonnes)/Estimations de biomasse (1999-2002) de Scomber japonicus pour
le Maroc, N/R DR. FRIDTJOF NANSEN (poids en milliers de tonnes)
Year 1992
Year 1993
Year 1994
Year 1995
Year 1996
Year 1997
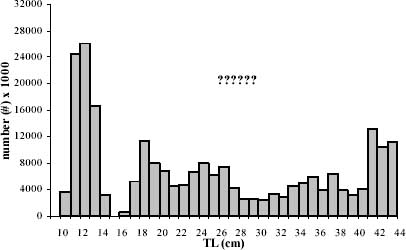
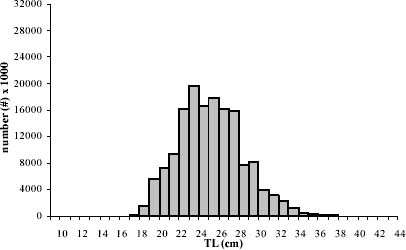
Figure 5.5.1a: Length-frequency
distribution (1992-1997) of Scomber japonicus for the northern fishery (numbers
in thousands)/Distribution de fréquence des tailles (1992-1997) de
Scomber japonicus pour la pêcherie du nord (en milliers)
Year 1998
Year 1999
Year 2000
Year 2001
Year 2002
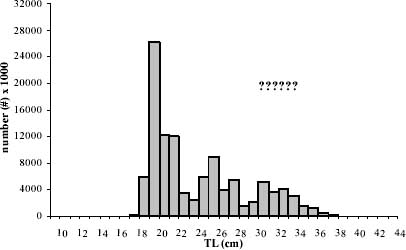
Figure 5.5.1b: Length-frequency
distribution (1998-2002) of Scomber japonicus for the northern fishery (in
thousands)/Distribution de fréquence des tailles (1998-2002) de Scomber
japonicus pour la pêcherie du nord (en milliers)
November-December 2000
November-December 2001
May-July 2002
November-December 2002
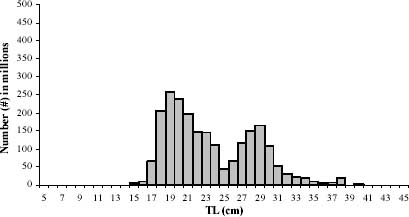
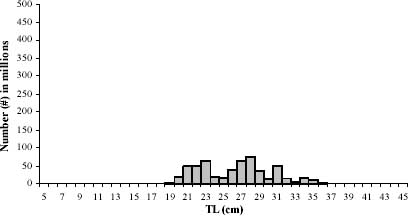
Figure 5.5.2: Length-frequency
distribution (2000-2002) of Scomber japonicus for Morocco, R/V DR. FRIDTJOF
NANSEN (in millions)/Distribution de fréquence des tailles (2000-2002) de
Scomber japonicus pour le Maroc, N/R DR. FRIDTJOF NANSEN (en
millions)
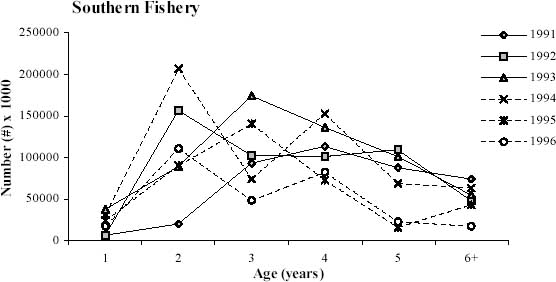
Figure 5.6.1: Catch at age by year
class (1991-1996) for Scomber japonicus for the southern fishery (in
thousands)/Capture par âge par classe d'année (1991-1996) de
Scomber japonicus pour la pêcherie du sud (en milliers)
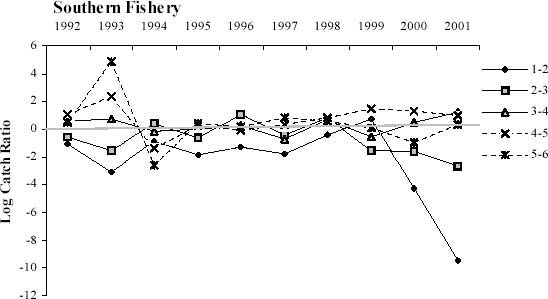
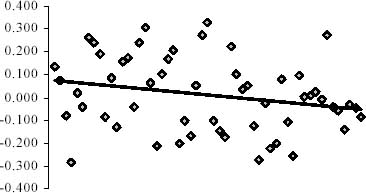
Figure 5.6.2: Log catch ratio
(1992-2001) for Scomber japonicus for the southern fishery/Log du taux de
capture (1992-2001) de Scomber japonicus pour la pêcherie du
sud
Figure 5.6.3: Catch at age by year
class (1991-1996) for Scomber japonicus for the total (northern+southern)
fishery (in thousands)/Capture par âge par classe d'année
(1991-1996) de Scomber japonicus pour la pêcherie totale (nord+sud) (en
milliers)
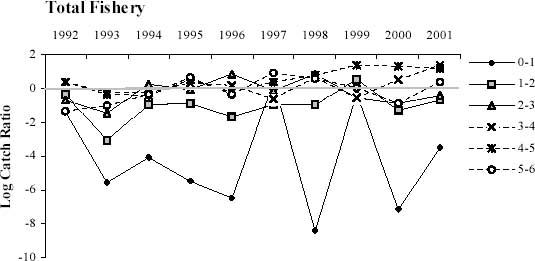
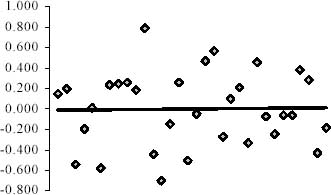
Figure 5.6.4: Log catch ratio
(1992-2001) for Scomber japonicus for the total (northern+southern) fishery/Log
du taux de capture (1992-2001) de Scomber japonicus pour la pêcherie
totale (nord+sud)
All residuals -XSA
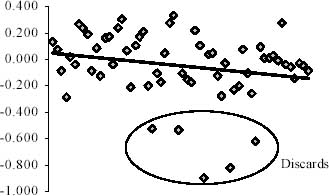
All Residuals -ICA
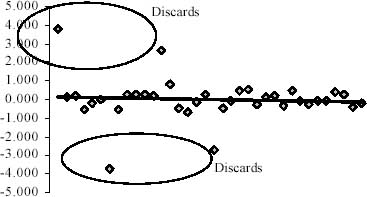
Some discard Residuals -XSA
Some discard Residuals -ICA
SSB (t) -XSA
SSB (t) -ICA
Fbar -XSA
Fbar -ICA
Figure 5.6.5: Output data from
assessment of Scomber japonicus using XSA and ICA for the total
fishery/Données de sortie à partir de l'évaluation de
Scomber japonicus en utilisant XSA et ICA dans la pêcherie
totale
