![]()
![]()
![]()
by
B.P. Das
717, Saheed Nagar,
Bhubaneshwar, India, 751007
India, with arable land of 169.70 million hectares (mha), has large irrigation systems commanding a gross area of almost 90 mha. India has the distinction of being the country with the largest irrigation coverage in the world. Per capita availability of land and fresh water is shrinking for the large population of 1 billion. Because of erratic distribution of monsoon rainfall (June through October), varying from 200 mm in the arid west to 10 000 mm in the mountainous northeast, provision of irrigation has been given a thrust to sustain agriculture. Irrigation coverage has expanded from 21 mha in 1951 to 90 mha in 2000. A major component of the irrigation sector is large (generally multipurpose), medium and minor reservoirs. These reservoirs have a combined volume of 250 billion cubic metres (BCM) and water area of around 40 000 km2. The largest man-made lake in southern Asia is Hirakud reservoir (740 km2) built (1957) on the Mahanadi River in Orissa. Very large canals carrying up to 1 000 m3/sec, such as the Rajasthan canal, form another major component of irrigation systems. These man-made waterbodies have large fish production potential. Annual fish yields in large Indian reservoirs range from 0.5 to 109.2 kg/ha. Smaller medium and minor reservoirs have yields of up to 300 kg/ha, with enhancement. Overall annual production from all inland waterbodies in India is at present 2.5 million tonnes against the potential of at least 10 million tonnes. In a large canal with cages and in smaller outlet channels a low-through culture system trials yielded 100 tonnes/ha/year. Stocking, appropriate water release schedule, fishing gear regulation, appropriate management of the upstream zone, maintaining migratory path, self reliance and people’s participation have been identified as beneficial to fisheries.
India, which covers an area of 329 mha, is a country endowed with vast water and land resources. With arable land of 169.70 mha, it ranks third to Russia’s 208.4 mha and the United States of America’s 187.76 mha. With its population of one billion accounting for one sixth of the world population, its renewable water resources are only 4 percent of global availability. Per capita availability of land and fresh water in India is 0.2 ha and 220 m3 against the world average of 0.27 ha and 7 400 m3, respectively.
Indian economy has been based on traditional agriculture for centuries. The net cropped area of 140 mha experiences erratic monsoon both spatially and temporally (June through October), with precipitation ranging from a meager 200 mm in the western Rajasthan desert to 10 000 mm in the northeastern Himalayan states. India frequently experiences drought and floods that seriously affect crop yields. Since independence (1947), in order to sustain agriculture, water resources development projects with major objectives of irrigation, flood control and power generation have been implemented to progressively harness the annual precipitation of 4 000 billion cubic metres (BCM) of which the utilizable quantity is 1 122 BCM as shown below.
|
Classification |
Quantity (in BCM) |
|
Surface water |
690 |
|
Ground water |
432 |
|
Total |
1122 |
Between 1951 and 2000 the population of India grew from 361 million to a billion. Food production has also caught up, with an increase from 51 million tonnes in 1951 to 200 million tonnes in 1999, primarily attributable to the implementation of irrigation schemes comprising of 311 major projects, 944 medium projects and 40 000 minor projects.
India has achieved the gigantic task of harnessing its water for managing and sustaining agriculture primarily through large flow irrigation projects having major, medium and minor reservoirs as head works. While surface water irrigates almost 46 mha, ground water irrigates another 46 mha of arable land.
Over the last 50 years there has been a steady increase in irrigated lands (Table 1). Additional 6 mha is likely to be irrigated by 2002 during the 9th plan.
Table 1
Chronological increase in irrigated lands
(in million hectares)
|
PLAN |
Potential created in mha |
||||
|
Major & medium |
Minor |
Total |
|||
|
Surface water |
Ground water |
Total | |||
|
Pre-plan to 1951 |
9.70 |
6.40 |
6.50 |
12.90 |
22.60 |
|
I Plan (1951-56) |
12.20 |
6.43 |
7.63 |
14.06 |
26.26 |
|
II Plan (1956-61) |
14.33 |
6.45 |
8.30 |
14.75 |
27.08 |
|
III Plan (1961-66) |
16.57 |
6.48 |
10.52 |
17.00 |
33.57 |
|
Annual Plan (1966-69) |
18.10 |
6.50 |
12.50 |
19.00 |
37.10 |
|
IV Plan (1969-74) |
20.70 |
7.00 |
16.50 |
23.50 |
44.20 |
|
V Plan (1974-78) |
24.72 |
7.50 |
19.80 |
27.30 |
52.02 |
|
Annual Plan (1978-80) |
26.61 |
8.00 |
22.00 |
30.00 |
56.61 |
|
VI Plan (1980-85) |
27.70 |
9.70 |
27.82 |
37.52 |
62.22 |
|
VII Plan (1985-90) |
29.92 |
10.99 |
35.62 |
46.61 |
76.53 |
|
Annual Plan (1990-92) |
30.74 |
11.46 |
38.89 |
50.35 |
81.09 |
|
VIII Plan (1992-97) |
33.82 |
12.24 |
45.73 |
57.97 |
91.79 |
|
End of IX Plan (likely) 1997-2002 |
38.00 |
18.00 |
47.00 |
60.00 |
98.00 |
An examination of the investment in irrigation development in India through major and medium projects shows that from the irrigation of a gross area of 85 mha, at least 70 million families having a population of 350 million, have benefited (Fig. 1). Currently it costs Rs. 90 000 (US $ 2 000) to bring 1 ha of land into production.
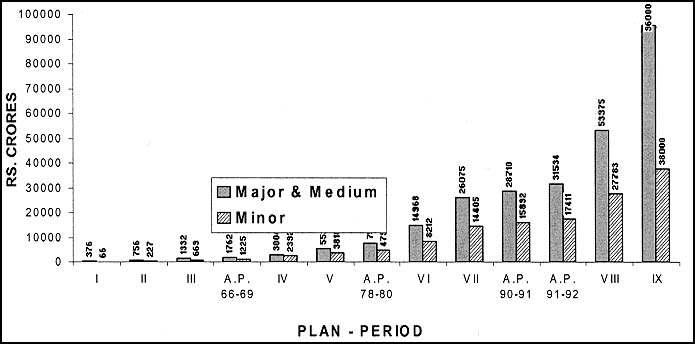
Fig. 1 Planwise financial expenditure (cumulative) at
current prices
(Note: crore = 10 million)
It is obvious that the extremely high investment India makes in irrigation development must aim at integrated utilization of the harvested water for sustainable rural development such as horticulture, pasture, aquaculture and capture fisheries, in addition to agriculture. Appropriate investment in the socio-economic fields and for research, extension and training is imperative for the irrigation sector.
Of the gross cropped area of 190 mha in the country, food grain accounts for 126 mha and the rest are cash crops. The gross irrigation coverage is 85 mha/annually. Irrigation in India is supplemental during the Kharif season (June to October) for the principal cereal crops rice, maize, jowar, etc., and almost total during the Rabi season (November to April) for wheat and other cash crops. With 45 mha under rice, of which 23 mha is irrigated, and 27 mha of under-irrigated wheat, the bulk of consumption of the reservoir water is for these crops due to continuous irrigation for four months for each principal crop. Cash crops consume almost 25 percent of the stored water but with intermittent irrigation. The average irrigation supplementation for typical crops, which varies significantly from loamy soil to clayey soil and from low rainfall areas (less than 600 mm annually) to high rainfall areas (around 2 000 mm annually or more), is as follows:
|
Crop |
Supplementation in mm |
|
|
Kharif |
Rabi |
|
|
Rice |
700 - 1600 |
1600 |
|
Maize |
100 - 300 |
500 - 600 |
|
Groundnut |
300 - 400 |
500 -700 |
|
Cotton |
150 - 300 |
600 - 800 |
|
Sugar cane (perennial) |
600 -800 |
|
In India the man-made reservoirs harnessing water for irrigation, flood control and hydroelectric power are large waterbodies with a combined water surface area over 30 000 km2 and a combined storage volume of 250 BCM. The reservoir development history for the major and medium reservoirs, expressed as water storage volume, is shown in Fig. 2. Reservoirs have a large fisheries potential, which has not yet been fully realized.
Fig. 2 Creation of storage during Plan Development
In an irrigated area the pattern of drawing irrigation water is not only related to the crop water needs, but also has to respond to a large number of other water users. During droughts when water management is not well formulated, interference with operation, unauthorized water diversion and improper irrigation practices such as ponding, are common. These factors can be redressed by social involvement of a group of farmers through Participatory Irrigation Management (PIM), which is proving to be a great success in economizing water use and concurrent maintenance of the health of the system. Institutional strengthening incorporating beneficiary participation is therefore a priority.
Excessive water withdrawal leads to accumulation of surplus water over lowlands, causing waterlogging and also increase in the ground water table. It is recognized that of the 255 mha of area irrigated worldwide one third is threatened by waterlogging and salinity. Almost 3 mha out of 65 mha of net irrigated land in India is already suffering from waterlogging. For irrigation to be efficient, participatory and integrated management of irrigation and drainage is essential.
Currently 38 mha is irrigated through 1 300 major and medium Flow Projects and 13 mha through minor Flow Projects. This includes almost 25 mha of arid/semi-arid lands. These projects essentially have a reservoir whose area varies from less than 1 km2 to 740 km2. The Hirakud project (Fig. 3), with a largest reservoir in India covering 740 km2, has a large network of canals and provides irrigation to 0.16 mha. The main canal (130 m3/sec) of up to 50 m bed width is 95 km long, feeding almost 3 000 km of secondary canals of up to 20 m bed width.
Fig. 3 Hirakud reservoir, Orissa
Apart from irrigation from reservoirs, eastern and southern India have large delta irrigation systems fed by diversion structures such as those on the rivers Mahanadi, Godavari, Krishna and Cauvery, and the rivers Kosi, Sone, Gandak, Damodar in Bihar and West Bengal, and the Ganga and Yamuna canals in the alluvial plains of Uttar Pradesh. These long anicuts/barrages up to 4 km long support large but shallow reservoirs of 3 to 5 m depth, with areas of up to 2 000 ha, which provide a continuous water supply to canals. Fish yields in these shallow reservoirs are estimated to range from 5 to 10 kg/ha. Fish production could possibly be higher if fish were allowed to migrate in and out of these reservoirs and if quick releases of water were avoided. The largest irrigation canal of India currently operating is the Rajasthan canal which receives water from a reservoir stored behind the 255 m high Bhakra dam. The reservoir supplies water for irrigation of 4 mha.
Table 2
Surface area of some major reservoirs in
India and their fish production
|
Reservoir, state |
Surface area |
Annual |
Fish yield (kg/ha) |
|
Hirakud,Orissa |
74 000 |
600 |
6.6 |
|
Gandhi Sagar, Madhya Pradesh |
66 000 |
607 |
9.21 |
|
Ukai, Gujarat |
52 000 |
3989 |
109.2 |
|
Rihand, Uttar Pradesh |
46 538 |
329 |
10.91 |
|
Kakrapar, Gujarat |
44 200 |
NA |
NA |
|
Sharavaty, Karnataka |
40 500 |
NA |
NA |
|
Jay Kwadi, Maharashtra |
39 777 |
305 |
25 |
|
Tungabhadra |
37 814 |
4200 |
111 |
|
Nagarjuna Sagar, Andhra Pradesh |
28 475 |
173 |
9.4 |
|
Rengali, Orissa |
28 000 |
14.5 |
0.52 |
|
Pong, Himachal Pradesh |
24 529 |
797 |
53.1 |
|
Balimela, Orissa |
19 440 |
23 |
15.7 |
|
Bhakra, Himachal Pradesh |
16 867 |
964 |
96.4 |
|
Kadana, Gujarat |
16 600 |
NA |
NA |
|
Mettur, Tamil Nadu |
15 346 |
434 |
28.5 |
|
Banswada, Rajasthan |
13 500 |
40 |
3 |
|
Krishnaraj Sagar |
13 200 |
271 |
20.53 |
|
Maithan, Bihar |
11 490 |
NA |
NA |
The major reservoirs (surface area over 3 000 ha) and medium reservoirs (up to 3 000 ha surface each), together with the major canals, possess the highest potential for fisheries because they convey water continuously for 5 to 6 months in one irrigation season. The reservoir dead storage does not dry out 90 percent of time and thus can function as a permanent habitat. It represents 20 to 30 percent of the gross storage. The gross storage volume is about 300 000 m3 for every km2 of catchment area intercepted by the dam. As major and medium projects have catchment areas of 100 to 50 000 km2 or even more, substantial reservoir capacity, as much as 11 560 million m3 for Nagarjuna Sagar alone, has been created.
Shallow and flat Indian reservoirs have a higher fish yield than deep and elongated reservoirs. The operational trend for a reservoir is to go from the dead storage level (DSL) in June to full reservoir level in October, followed by water depletion. This profoundly influences fish production. Salandi reservoir in Orissa, with 3 100 ha of surface area, depletes quickly in drought years and this results in lower fish yields, i.e. about 10 kg/ha against 20 kg/ha in normal years.
Simulation of the past hydrological data, including topography and deposition of sediments, may assist in the preparation of a rational plan for maintaining optimal sustainable level of fishing effort. In smaller reservoirs appropriate stocking in June-July and harvesting in April-May have given good results, but this is yet to be achieved for large reservoirs.
Canals also have a great potential for fisheries. Limited data on cage culture under controlled conditions between cross-regulators in some large canals such as in the Mahanadi delta system with the main canal of 45 m bed width, and Hirakud canal of 40 m bed width, have shown promise for cost-effective aquaculture, provided that a people’s participation programme is functional.
The institutional arrangement for obtaining optimal fisheries production needs attention. Water resources organizations which build and operate reservoirs focus primarily on meeting the irrigation or other needs without an established or formulated linkage to fisheries. In India every major reservoir is operated by following a "rule curve", which maintains certain levels at a certain period in the year, which is linked with the hydrology of the basin and consumptive/non-consumptive requirements. As soon as a reservoir in India becomes operational, fisheries is generally initiated by a public sector corporation. Alternately the reservoir fishing rights are leased to a fishermen cooperative society at a particular royalty rate. Generally there are two types of cooperative societies, viz. the primary cooperative engaged in fishing, and the apex society engaged in marketing and providing marketing infrastructure and logistics. The fishery development scheme applying stock enhancement, tried in Malampuzha Reservoir in Kerala (Drewes, 1994) through an Indo-German fisheries development project, seems appropriate for Indian conditions (Natarajan et al., 1979).
India’s inland water area has kept increasing with the completion of new irrigation reservoirs. The two large reservoirs in India prior to 1956, when dam construction was accelerated, were Mettur in Tamil Nadu, with water surface area of 15 346 ha, and Tungabhadra in Karnataka, with a surface of 37 814 ha. Fisheries production in Tungabhadra increased from 15 tonnes in 1958 to 156 tonnes in 1965, and to 4 200 tonnes in 1981-82. Between 1980 to 1987, it was fluctuating between 2 000 and 1 800 tonnes/year and had fallen to 1 600 tonnes in 1993. The large reservoirs which appeared since 1957, such as Hirakud, Bhakra, Nargarjuna Sagar, Pong, Rihand and Ukai have average yields of 10 to 60 kg/ha, whereas in the 500 medium reservoirs the yields have been 20 to 30 kg/ha.
With more than 3 million ha of reservoirs in India, freshwater fish production had gone up from 0.22 million tonnes in 1951-52 to 1.6 million tonnes 1990-91 and to 2.5 million tonnes in 1997.
Due to inherent logistical advantage the small and medium reservoirs show consistently higher yields than large reservoirs.
The fish production potential of all freshwaterbodies of India is estimated to be at least 10 million tonnes provided appropriate and scientific management is practised.
A firm institutional linkage between the Water Resources Department and the Fisheries Department in the states of India has not yet been established and information on fisheries practices is not yet available for all reservoirs.
Table 3
Freshwater fish production in India in
million tonnes
|
Year |
Inland fish production |
|
1950-51 |
0.218 |
|
1960-61 |
0.280 |
|
1970-71 |
0.670 |
|
1980-81 |
0.887 |
|
1990-91 |
1.536 |
|
1997-98 |
2.438 |
Fisheries scientists and managers need to be acquainted with the average pattern of irrigation water demand so as to adjust their stocking and harvesting programmes accordingly. Rapid fluctuation of reservoir water level, which is common especially in irrigation reservoirs, has been the primary cause of low yields (Jhingran, 1988). Detailed evaluation of this impact is urgently required. For each reservoir maps of shoreline at different water levels need to be made available to assist in the decision on positioning of enhancement facilities, such as cages and pens. On large canals there is a need for fish culture pilot trials. Some information is already available from the canal fish production studies conducted in Orissa (Anon., 1991; Saha and Paul, 2000).
Any irrigation system has two major components: the headworks, and the distribution network. Reservoirs forming the headworks constitute the major habitat for fish. The large and medium reservoirs do not dry up which is a major benefit from a conservation viewpoint. Reservoir management using fish stock enhancement results in significant increases in fish yield (Table 4).
Table 5 shows the extreme variability in fisheries production among Indian states: West Bengal with 865 700 tonnes, as compared with 70 330 tonnes in Gujarat.
Table 4
Reservoirs showing the enhancement impact
on fish yields
|
Years |
Average yield kg/ha/year |
||
|
Kerala |
Bhakra |
Ukai |
|
|
1978-79 |
6.60 |
75 |
21 |
|
1987-88 |
6.70 |
38 |
79 |
|
1988-89 |
15.10 |
77 |
109 |
|
1989-90 |
17.50 |
81 |
|
|
1990-91 |
20.40 |
80 |
|
|
1991-92 |
25.50 |
85 |
|
|
1992-93 |
23.38 |
95 |
|
Table 5
Fisheries production by state
|
State |
Annual freshwater fish production in thousand tonnes |
Waterbodies ha x 105 |
Reservoirs ha x 105 |
|
West Bengal |
865.70 |
5.45 |
NA |
|
Bihar |
254.74 (not confirmed) |
1.60 |
0.97 |
|
Uttar Pradesh |
192.91 |
4.45 |
3.35 |
|
Assam |
159.77 |
1.35 |
NA |
|
Maharashtra |
135.39 |
3.39 |
2.74 |
|
Orissa |
135.30 |
9.67 |
2.56 |
|
Madhya Pradesh |
127.43 |
4.13 |
4.60 |
|
Karnataka |
126.64 |
6.42 |
4.38 |
|
Kerala |
73.90 |
3.03 |
NA |
|
Gujarat |
70.33 |
7.02 |
2.87 |
Fisheries production benefits from the following:
stocking and stock enhancement; annual evaluation;
self reliance; fishing gear mesh size regulation;
nutrient enrichment during floods;
appropriate management in the reservoir shallow upper zone with lotic environment which serves as breeding and nursery ground;
the middle and lower lacustrine zone should be developed for year-round commercial fishing; in the early part of monsoon, with the reservoir at the lowest drawdown level, flood water enters the reservoir at a higher current velocity of up to 3 m/sec, and dam spilling may wash out the fry and fingerlings, as observed for example in Konar reservoir in Bihar (Parameshwaran, Khan and Ramakrishnaya, 1978). Quick filling up of a reservoir during the first week of July (without any spilling) will reduce this hazard to fish stocks.
Fish production may face the following constraints:
aquatic macrophytes in the reservoir, which retard increase in stocks of some fish species. Submerged weeds also provide shelter for some weed fish;
decomposition of large quantities of aquatic plants will result in reduced dissolved oxygen levels or complete deoxygenation;
presence of dead trees which were not clear-felled prior to flooding, obstructs the use of fishing gear.
When a dam is constructed, riverine fish species suffer from the loss of their habitat due to changes in water current and turbidity, loss of breeding grounds and changes in fish food organisms.
A dam also represents an obstruction to fish migration. Very few dams have fish ladders, and those which do are mostly unsuitable for the migration of the Indian fish species. An example is the dammed Cauvery River where, after the construction of anicuts in the coastal region, the upriver fish migration was totally blocked.
Among the states of India Orissa has the largest waterbody area of almost one million hectares. This offers a large scope for fisheries in reservoirs, rivers and canals. Reservoirs cover an area of 256 000 ha, the largest component of all waterbodies in this state.
Eastern, southern and southwestern India, except the states Rajasthan, Haryana, Punjab, Jammu-Kashmir, get a high (up to 1 500 mm) monsoon rainfall, which results in substantial filling (3 out of 4 years) of the irrigation reservoirs, 75 percent of the year. Surface areas of these reservoirs (Sugunan, 1995) represent almost 90 percent area of all Indian reservoirs.
Reservoirs in Orissa have lower fish yields than rivers, canals, ponds and tanks (Table 6). The main reason is probably the low stocking rate which, according to the recommendation of the Fish Seed Committee of the Government of India (1966), should be 500 fingerlings of 40 to 150 mm size per ha. As in other states of India, the medium and minor reservoirs with enhanced fisheries show considerably higher yields than large reservoirs with poor rates of enhancement.
The Mandira reservoir on the Sankh River is exclusively meant to provide water to a large steel plant with a steady water supply of 5 to 10 m3/sec. The reservoir fills up in July, receiving water from a forested catchment of 3 000 km2. The reservoir remains full until December, with occasional spill of perhaps 10 days during the monsoon. The reservoir provides good environment for fish. The stocking rate is 300 to 400 fingerlings per hectare. With a ready market of 300 000 people in the nearby steel city, there is a good tie-up between marketing and producer.
Table 6
Waterbodies in Orissa
|
Year |
Reservoirs |
Rivers & canals |
Ponds & tanks |
|||
|
Production |
Yield |
Production |
Yield |
Production |
Yield |
|
|
1995-96 |
12 506 |
49 |
12 509 |
81 |
93 079 |
810 |
|
1996-97 |
14 652 |
57 |
14 556 |
93 |
92 927 |
800 |
|
1997-98 |
14 628 |
56 |
16 664 |
107 |
99 980 |
870 |
|
1998-99 |
16 202 |
63 |
26 318 |
169 |
98 386 |
860 |
|
1999-2000 |
13 809 |
54 |
20 873 |
134 |
88 107 |
767 |
|
Reservoir |
Surface area (ha) |
Yield (kg/ha) |
|
Hirakud |
74 000 (average 50 000) |
6.6 |
|
Mandira |
3 330 |
55.13 |
|
Pilasalki |
120 |
152.75 |
Pilasalki reservoir (established in 1976 in Phulbani district), is drought prone. The 7-m deep reservoir spills only 10 to 20 percent of its volume. The reservoir is close to a district town. Good breeding in sheltered inshore areas and stocking have resulted in a high yield of 152.75 kg/ha.
The large Hirakud reservoir has low fish yield (Yadav and Sugunan, 1992), partially due to the live storage capacity being only 15 percent of the annual runoff. In a medium rainfall year the fish production is 700 to 800 tonnes (12 to 15 kg/ha), but drops to 300 tonnes in high rainfall years, as both fingerlings and small fish are washed out over the spillways. Stocking is not very systematic. In shallow parts of the reservoir influenced by the inflowing river the yield reaches 20 kg/ha.
Recent research on a flow-through system, carried out at the Central Institute for Fresh Water Aquaculture at Bhubaneshwar, India, using canal water in the Mahanadi delta irrigation system, gives promising results. In the Kanas Branch Canal System (15 m3/sec head discharge) water was passed through 27 tanks, each of 10 m3 volume constructed on a small off-take channel carrying up to 20 litre/sec. The main advantage of the flow-through system was good water oxygenation. With pelletted food and stocking density of 800 per 10 m3, the fish production was 15 kg/10 m3/three months, which is the time during which the water flow in the canal is maintained in one irrigation season. The highest production achieved was 100 tonnes/ha/year at a stocking density of 500. A prototype trial in a large canal can provide a good yield of 10 tonnes/ha/year even with stocking density of 100 fingerlings per 10 m3, provided the inlet and outlet of the canal are suitably blocked to prevent the escape of fish.
Following the experience in Kyrdenkulai reservoir in N.E. India, cage and pen culture has been tried in a limited way in running canals and in Kolab reservoir. Yields up to 100 kg/ha have been reached using cage culture.
Small reservoirs achieve the best fish yields when practicing enhanced capture fisheries. Capture-cum-culture approach is recommended for fisheries in medium reservoirs. Achieving a yield of 100-300 kg/ha from the almost 25 mha of medium and small waterbodies which exist in India is a key management issue.
Large reservoirs of India have high fisheries potential if adequate stocking and good management are practiced. These reservoirs are currently producing only 100 000 tonnes of fish per year, but have an estimated potential of 300 000 tonnes. A difficult issue is pollution from industries and other sources.
Cage and pen fish culture in reservoirs and irrigation canals should be practiced on a much larger scale.
People’s participation is a necessary condition for successful fisheries management of the large diversity of waterbodies serving and arising from irrigated agriculture.
Anon., 1991. Proc. National Symposium on Freshwater Aquaculture. News Item, CIFA. Bhubaneshwar, India.
Drewes, E. 1994. Reservoir fisheries management by co-operatives: issues and scope. Indo-German Reservoir Fisheries Development Project PN: 882134 0-01.200. Malampuzha, Kerala, India.
Jhingran, A.G. 1988. Reservoir Fisheries Management in India. Bulletin 45, CICFRI. Barrackpur, India. 68p.
Natarajan, A.V. 1979. Planning strategies for development of reservoir fisheries in India. Madras J. Fish. 8: 69-77.
Parameshwaran S., Khan, M.A. & Ramakrishnaya, M. 1978. Pre-recruitment studies in Konar reservoir, Bihar. Proc. Seminar on Ecology and Fisheries of Freshwater reservoirs. CICFRI, Barrackpore.
Saha, C. & Paul, B.N. 2000. Flow through system for industrial aquaculture in India. Aquaculture Asia 5(4): 3.
Sugunan, V.V. 1995. Reservoir Fisheries of India FAO Fisheries Technical Paper No. 345. Rome, FAO. 423p.
Yadav, Y.S. & Sugunan, V.V. 1992. Hirakud reservoir - strategies for fisheries Development. Bulletin 66. CICFRI, Barrackpore, India. 18p.
![]()
![]()
![]()