|
Country |
1990 |
2000 |
||||
|
Imports metric tonnes |
Total value thousand US$ |
Average price US$/tonne |
Imports metric tonnes |
Total value thousand US$ |
Average price US$/tonne |
|
|
Not land-locked |
|
|
|
|
|
|
|
Angola |
31 994 |
14 161 |
443 |
23 947 |
7 100 |
296 |
|
Mozambique |
17 667 |
10 600 |
600 |
3 700 |
1 600 |
432 |
|
Namibia |
8 000 |
5 333 |
667 |
3 183 |
1 935 |
608 |
|
South Africa |
14 823 |
6 608 |
446 |
55 882 |
16 772 |
300 |
|
All not land-locked |
72 484 |
36 702 |
506 |
86 712 |
27 407 |
316 |
|
Land-locked |
|
|
|
|
|
|
|
Botswana |
780 |
749 |
960 |
6 462 |
5 559 |
860 |
|
Lesotho |
5 000 |
2 067 |
413 |
1 200 |
470 |
392 |
|
Malawi |
77 |
131 |
1 698 |
527 |
318 |
604 |
|
Swaziland |
0 |
0 |
|
3 234 |
1 892 |
585 |
|
Zambia |
311 |
145 |
467 |
3 124 |
1 661 |
532 |
|
Zimbabwe |
304 |
240 |
790 |
2 543 |
2 688 |
1 057 |
|
All land-locked |
6 473 |
3 332 |
515 |
17 091 |
12 589 |
737 |
|
All countries |
78 957 |
40 034 |
507 |
103 803 |
39 997 |
385 |
/1. All figures are three-year averages.
Source: FAOSTAT
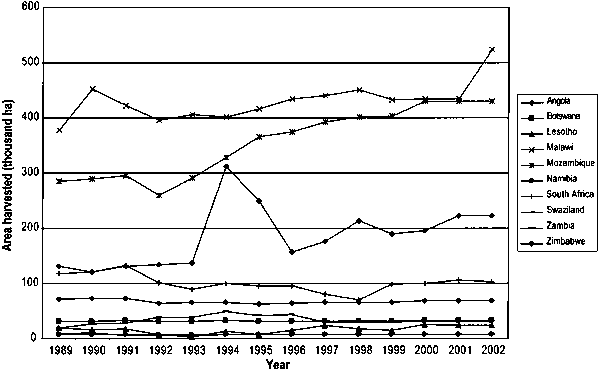
CHART A2.7
Area harvested

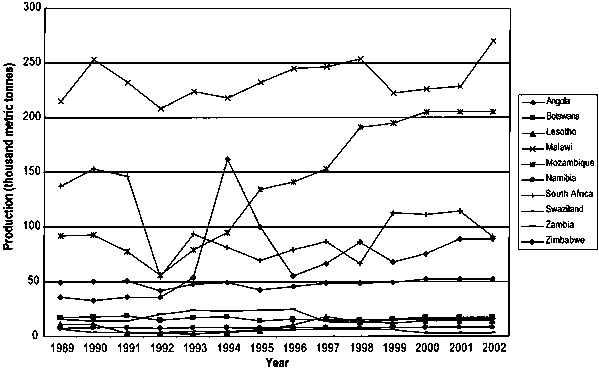
CHART A2.8
Pulses - Production

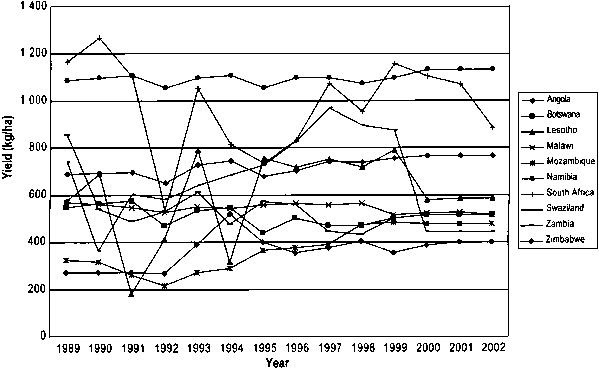
CHART A2.9
Pulses - Yield
