|
Country |
1990 |
2000 |
||||
|
Total imports metric tons |
Total value thousand US$ |
Average price US$/ton |
Total imports metric tons |
Total value thousand US$ |
Average price US$/ton |
|
|
Not land-locked |
|
|
|
|
|
|
|
Angola |
0 |
0 |
|
0 |
0 |
|
|
Mozambique |
0 |
0 |
|
0 |
0 |
|
|
Namibia |
0 |
0 |
|
1 477 |
511 |
346 |
|
South Africa |
0 |
0 |
|
92 |
32 |
349 |
|
All not land-locked |
0 |
0 |
|
1 568 |
543 |
346 |
|
Land-locked |
|
|
|
|
|
|
|
Botswana |
2 877 |
1 284 |
446 |
12 331 |
2 966 |
241 |
|
Lesotho |
3 788 |
1 550 |
409 |
4 000 |
1 600 |
400 |
|
Malawi |
2 |
3 |
1 600 |
7 |
6 |
818 |
|
Swaziland |
37 |
7 |
188 |
1 344 |
347 |
258 |
|
Zambia |
956 |
114 |
120 |
21 |
8 |
397 |
|
Zimbabwe |
1 |
0 |
0 |
381 |
73 |
192 |
|
All land-locked |
7 660 |
2 958 |
386 |
18 085 |
5 001 |
277 |
|
All countries |
7 660 |
2 958 |
386 |
19 653 |
5 544 |
282 |
/1. All figures are three-year averages.
Source: FAOSTAT
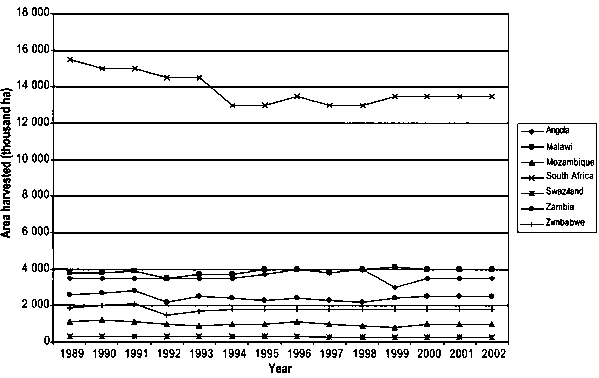
CHART A3.1
Tomato - Area harvested

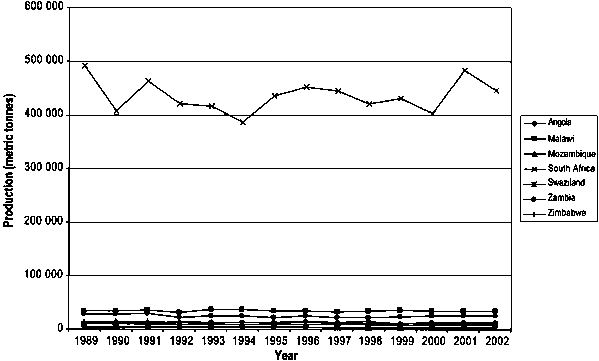
CHART A3.2
Tomato - Production

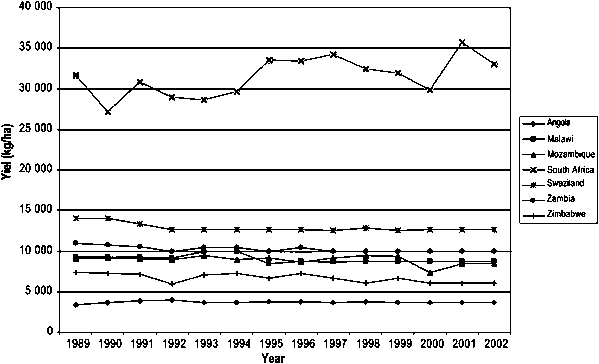
CHART A3.3
Tomato - Yield
