|
Country |
1990 |
2000 |
||||
|
Total imports metric tonnes |
Total value thousand US$ |
Average price US$/ton |
Total imports metric tonnes |
Total value thousand US$ |
Average price US$/ton |
|
|
Not land-locked |
|
|
|
|
|
|
|
Angola |
700 |
320 |
458 |
5 367 |
1 100 |
205 |
|
Mozambique |
0 |
0 |
|
0 |
0 |
|
|
Namibia |
0 |
0 |
|
2 346 |
430 |
183 |
|
South Africa |
3 |
1 |
333 |
247 |
41 |
168 |
|
All not land-locked |
703 |
321 |
457 |
7 960 |
1 572 |
197 |
|
Land-locked |
|
|
|
|
|
|
|
Botswana |
1 727 |
576 |
334 |
8 045 |
1 563 |
194 |
|
Lesotho |
0 |
0 |
|
1 250 |
380 |
304 |
|
Malawi |
0 |
0 |
|
48 |
24 |
497 |
|
Swaziland |
2 247 |
415 |
185 |
2 364 |
332 |
140 |
|
Zambia |
1 |
0 |
500 |
1 006 |
196 |
194 |
|
Zimbabwe |
0 |
0 |
|
1 683 |
334 |
198 |
|
All land-locked |
3 974 |
992 |
250 |
14 397 |
2 828 |
196 |
|
All countries |
4 677 |
1 313 |
281 |
22 357 |
4 400 |
197 |
/1. All figures are three-year averages.
Source: FAOSTAT
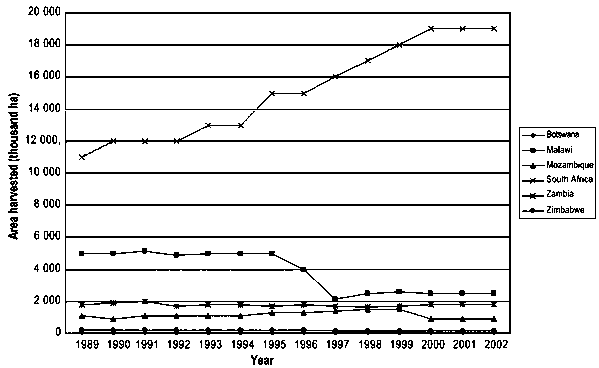
CHART A3.4
Onion - Area harvested

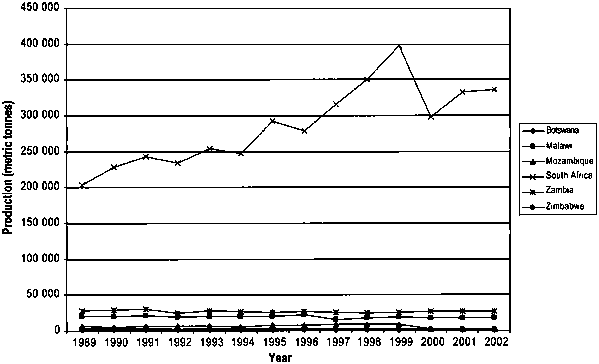
CHART A3.5
Onion - Production

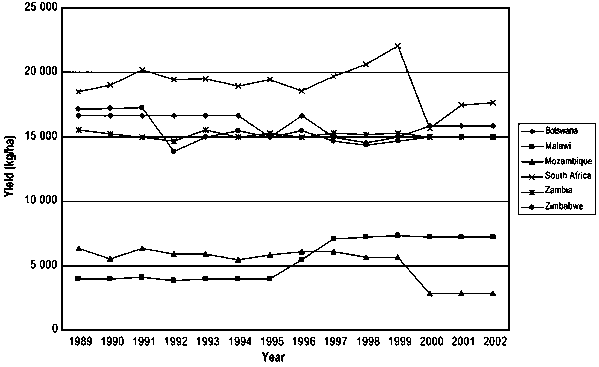
CHART A3.6
Onion - Yield
