The main constraints to crop production in Mediterranean environments are shortage of water and extreme temperatures. This chapter describes how they impact at particular stages on the growth and development of the crop and on building of the components of yield. It introduces in general terms how the farmer can work around them by avoiding having sensitive yield-generating stages and periods of stress occurring simultaneously.
Methods of measuring crop yield components, water use and water use efficiency and how they might be used to assess what might have gone wrong with the crop are described.
Finally, it introduces trials that might be required to optimize on-farm productivity in Mediterranean environments. Such optimization trials are the subjects of the “Explore On-farm” series of chapters. The series is far from complete. If you would like to add other topics for chapters and even better, write an article for the series, do this via the web site. For help, contact by email, the contributor listed at the top of any of the e-article windows by clicking on their name.
Water shortage is the major abiotic factor limiting growth and yield of cultivated rainfed crops in Mediterranean environments. The damaging effect of a drought period will depend on its duration, on how much water is stored in the soil and the proportion that the crop can access, how fast it is used or lost, and on the crop developmental stage at that time.
Crop management should aim to make as much of the season’s rainfall available to the crop as possible and at the right times to form the yield components that maximize grain production. Above all, crop growth and development should be manipulated so that during the final stages of the crop cycle enough rainfall or stored water remains to fill the grain.
Other factors besides water shortage that may reduce yield significantly are late frosts, high temperatures that accelerate transpiration and development, and any predominant damaging pests, diseases or weeds. Understanding the relationships between all these factors and crop growth and yield is a first critical step towards developing management strategies for the special conditions of any farm.
Before launching into any trials to optimize production on any farm, ensure the collaborating farmer has some basic idea of how the crop grows and develops and what processes s/he can manipulate. The following gives a simple outline.
How it all works
It is probably worth explaining that crops both need to grow (get bigger) and develop (add more parts of the same type and more parts that are different).
The simplest way of thinking about development is to split it into two categories, vegetative development that includes production of leaves, tillers and roots, and reproductive development, meaning the parts that finish up as the stalk and ear (head or spike) with its grains.
There are many steps within each of these processes of vegetative and reproductive development but there is one big step that switches the plant from predominantly vegetative to predominantly reproductive development. Without that switch wheat would continue to produce only leaves and tillers for several seasons.
The switch involves length of day (longer day for a faster switch) and temperature (warmer conditions make the plant’s internal clocks go faster towards the switch but semi-winter wheat requires low temperature first to accelerate the switch).
The plant senses day length and temperature continuously and records and sums them until it reaches the numbers required by the variety to make the switch. More details of these processes are in the chapter Optimizing variety x sowing date for the farm, where the concept of heat sums is explained and the factors that make different varieties develop at different rates.
Growing bigger
Plants grow bigger by absorbing carbon dioxide (CO2) from the air through tiny controlled apertures (stomata) in their green surfaces.
The carbon of the CO2 is built into sugars inside the plant using energy from sunlight in a process called photosynthesis. These sugars, in different forms and combinations with inorganic nutrients extracted from the soil via the roots, become the bricks from which the plant is built. Some sugars go straight into growth while others are put into a storage bank for later withdrawal and use, particularly for filling the grains. The stems can be a good sugar store (see the chapter Optimizing nitrogen use on the farm for how N can affect this and yield).
It follows that as long as the crop has enough sunlight and CO2, water and inorganic nutrients, and it is warm enough, all organs will grow as big as their potential allows.
There is one drawback to photosynthesis, water leaks out through open stomata as the CO2 diffuses in. The hotter, drier and windier the air is, the faster the precious water is lost for each unit of CO2 that enters. Though some passage of water from the roots to the leaves is necessary to extract nutrients from the soil, the plant must retain adequate water for essential growth processes.
Cross section of a wheat leaf
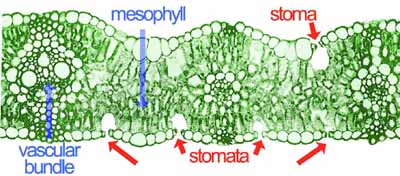
A severely droughted crop keeps its stomata closed to stop water loss, but this prevents CO2 from entering which concomitantly prevents growth. This is why crops that run out of water soon die. They starve as well as dehydrate.
Hopefully, the farmer will appreciate from the previous discussion that the plant must use water to grow and the hotter it gets the less efficiently it uses available water to grow. When the crop is under water stress, the organs growing at that time will be proportionately less able to reach their potential size.
Plants continually sense their environment and adjust their overall growth and the blend of the components of growth and yield to current weather. They also continually adjust their growth to their neighbours in the crop.
Developing: more parts of the same type
To a degree, the more sunlight that the crop can absorb to drive photosynthesis, the better it grows. As more of the ground is covered by green leaf the more sunlight is intercepted.
So before a crop can grow at its greatest absolute rate, it must have many leaves. Every leaf takes approximately the same time to expand (measured in temperature time) and the next one queued on any shoot cannot start to expand until the previous one is well under way.
Development is all about waiting turn in a sequence. The size that any unit achieves is dependent on how much plant substrate is available when its turn comes to grow.
The crop can produce many shoots (tillers) that eventually grow fairly independently and each tiller has its own leaves. However, tillers are subject to the same queuing rules that apply to leaves and even more so to being dependent on the amount of substrate the plant has available when its turn comes to grow.
If the plant is short of substrate (because of a drought or low light or nitrogen shortage) when a tiller’s turn comes to grow, it will remain dormant and possibly never grow. The next tiller in the sequence will start if conditions improve again.
The picture that the farmer should have in mind now is that the crop is continuously sensing its environment and adjusting its size, shape and types of components to match the constraints. The farmer’s job is to ensure that the crop’s composition leads to best yield within the constraints.
Stepping from vegetative to reproductive development
Crops do not really stop one process and then start another.
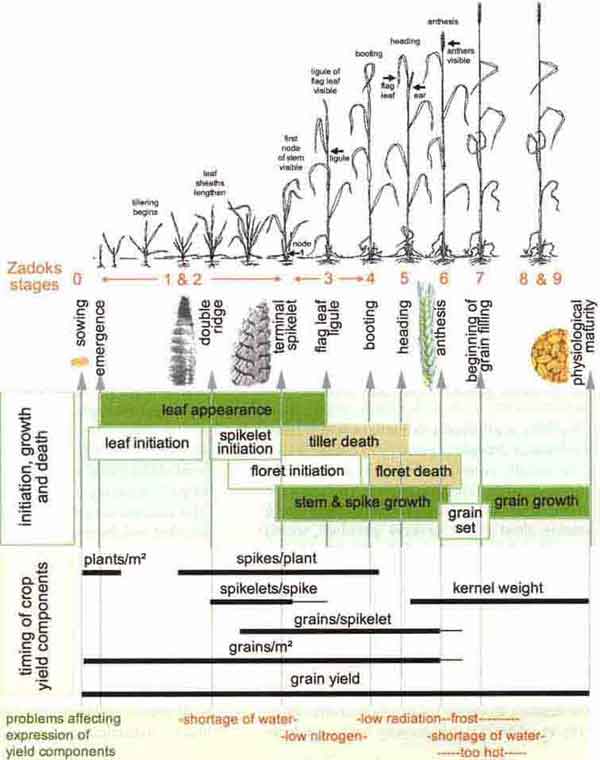
There is always an overlapping progression: so new leaves are still expanding long after the crop starts to grow its microscopic ears. This can be seen in the next figure where the green bar labelled leaf appearance extends beyond the picture of the ear at terminal spikelet.
However, just like each leaf and tiller queues to develop and have their final size set by plant substrate at the time of their growth, the reproductive parts, ears, spikelets, florets and finally grains, are subject to those rules. Whether the next floret starts to grow depends on the state of the previous floret and whether substrates are available to support it.
The figure attempts to show this interplay. It may seem complex but it is very much simplified compared with what the plant in the crop does. It shows when the plant components that bear the yield structures are forming. It also identifies when the processes are potentially most sensitive to stresses and might require higher inputs. This is when the farmer can have an impact on yield.
Discuss the figure with the farmer and use it to introduce how the crop must fit its key stages within the limiting characteristics of the rainfed Mediterranean environment. Some of these special characteristics are highlighted now.
|
How the crop develops, continually sensing and responding to its environment. The top section shows pictures of the crop and names of some stages possibly familiar to the farmer. The next section shows pictures of two internal flowering stages, double ridges and terminal spikelet and when they occur. Below again are the components of growth, overlapping in their timing and competing for resources. Next are the yield components and when they form in relation to everything else. Finally at the bottom on a green background are stages when the crop is particularly sensitive to certain stresses or lack of resources. |
Minimizing risk
In rainfed agriculture, farmers have an intimate relationship with the prevailing weather because they depend on it. After generations of farming under erratic weather, local experience is the base of crop managing decisions.
Memories are stronger for events that caused greater crop losses. Fear of those events recurring can lead to over conservative management decisions. Minimizing risks ensures a crop will be harvested every year. However, minimizing risks every year for the occasional bad year also reduces the opportunities to capitalize on the good years in a region of erratic weather.
Traditional practices may be reliable but they leave little room for advance. New technologies and improved varieties may require different management decisions to realize their potential for increased yield.
Merging the wealth of on-farm experience with an improved understanding of when in crop growth and by how much the weather impacts yield is the route to reliable improvements in yield through adapted methods of management.
Water and frost constraints
In Mediterranean environments seasonal rainfall is limited and in most years crops suffer a terminal drought during grain filling. If this description fits the region of your interest discuss the following questions with local farmers.
Could the traditional sowing date be advanced so terminal drought is partially avoided? Which date actually corresponds to the average break of season when rainfall is sufficient to work the ground and sow? Is it earlier than the traditional sowing date? If sowing were advanced, would flowering date also be advanced? Would then the risk of frost during flowering be increased? When is the last probable frost date?
Break of season
The break of season can be considered as 15 mm of rain in two consecutive days. Though it may be talked of as a particular date or period and the farming calendar set by it in advance, it is very variable from year to year. For example, in Córdoba (Spain) the recognized time of sowing for the region is the first week of December. The dates of opening rains for the past 24 years are shown in the following table.
Date of break of season in Córdoba (blue columns) and date of the last frost for the same crop season (grey columns). Year refers to that when the crop was sown
|
year |
Sep |
Oct |
Nov |
Dec |
Jan |
Feb |
Mar |
|
1978 |
|
12 |
|
|
|
5 |
|
|
1979 |
|
|
2 |
|
|
16 |
|
|
1980 |
1st |
|
|
|
1 |
|
|
|
1981 |
|
|
19 |
|
|
|
7 |
|
1982 |
|
|
|
27 |
29 |
|
|
|
1983 |
|
2 |
|
|
|
24 |
|
|
1984 |
|
16 |
|
|
|
|
5 |
|
1985 |
|
|
15 |
|
10 |
|
|
|
1986 |
|
|
|
11 |
28 |
|
|
|
1987 |
26th |
|
|
|
|
|
31 |
|
1988 |
|
6 |
|
|
|
14 |
|
|
1989 |
|
|
10 |
|
|
|
2 |
|
1990 |
|
5 |
|
|
1 |
|
|
|
1991 |
|
16 |
|
|
|
24 |
|
|
1992 |
|
|
|
14 |
|
24 |
|
|
1993 |
25th |
|
|
|
|
14 |
|
|
1994 |
|
|
2 |
|
|
|
13 |
|
1995 |
|
|
3 |
|
16 |
|
|
|
1996 |
|
|
2 |
|
|
10 |
|
|
1997 |
|
12 |
|
|
|
20 |
|
|
1998 |
|
9 |
|
|
|
|
7 |
|
1999 |
|
4 |
|
|
28 |
|
|
|
2000 |
12th |
|
|
|
1 |
|
|
|
2001 |
|
15 |
|
|
|
|
|
|
N° |
4 |
10 |
7 |
3 |
8 |
9 |
7 |
This table shows that the traditional planting date is reliable. Only in three out of 24 years were the opening rains later than that date. However, there were many occasions in October and November when the required rain fell allowing earlier planting if the farmer wished.
Planting at the safe time in December effectively wasted two months of crop growth in 50percent of years. Planting in December rather than earlier also increases the risk of running the crop into hot weather and drought at the end of the crop cycle.
What is required is for the farmer to be able to adapt approaches each year to the prevailing weather.
For example, it may be necessary to plant a different variety onto opening rains in November than in December to take full advantage of the early season break without increasing the risk of frost at anthesis.
Date of last frost sets earliest anthesis
In most cases, earlier sowing of a cultivar means earlier flowering. However, the earliest flowering date that can be planned is determined by the probability of frost. The relationships between the level and duration of low temperature and crop damage around anthesis are not fully understood, but a good policy is that frost should be avoided.
Look again at the data from Córdoba, but check on the dates of last frost for each of the 24 seasons. Just as with the date of opening rain the range spreads over several months. The safe time is early April when there were no frosts. Consequently to be certain that anthesis processes would not be damaged by frost, this should be the date of anthesis in the region. Note that there is no link between date of opening rains and frost.
However, only one year in 24 had a frost after 13 March and only two years in 24 had problems after 7 March, so this would be a better date to aim for to reduce the chance of running the crop into terminal drought. Moving back a further two weeks would increase the risk of frost to one year in four. This would be too dangerous if the whole crop were planned around that date.
A variety to fit between opening rains and frost
Once you know the likely dates of the two constraints of opening rains and anthesis frosts you can start to plan for the variety you might use for the area.
The figure uses the Córdoba data again to show the number of days between planting at the normal time (early December) and the last frosts (first possible anthesis date, the blue curve).
Days from normal sowing time to last frost (blue) and from opening rains to last frost (red) over 24 crop seasons in Córdoba (Spain). This indicates minimum days to anthesis to avoid frost damage
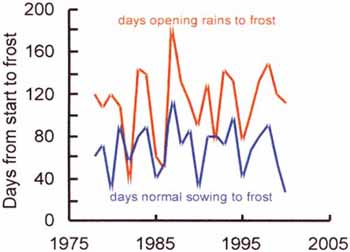
You will see that only in one year does the dark blue curve rise above 100 days. So a variety taking 100 days to anthesis would be completely safe to use in 23 of the 24 years. If sowing on the first rains (the red curve) longer duration varieties would be needed in most years to avoid the last frost. These issues are dealt with in the chapter Optimizing variety x sowing date for the farm.
Rainfall during the season
Just as opening rains and frosts are variable in timing and amount, so too is total season rainfall variable in timing and amount between seasons. All farmers are aware of this whether they maintain records of weather or not. Total water available to the crop is the first determinant of yield while its distribution in relation to the formation of crop yield components is next.
Wheat requires at least 200 litres of water during grain filling to produce each 1 kg grain and up to twice that amount in very hot, dry areas.
Scaling that ratio up, a 3 000 kg (3 t ha-1) crop will need 600 000 litres either from stored soil moisture or from rain. This is equivalent to 60 mm rain (1 mm rain falling on 1 m2 is 1 litre or over 1 ha is 10 000 litres).
The crop also needs water to grow prior to anthesis. For a 3 t ha-1 yield the crop will need to have more than 6 t ha-1 of biomass (total dry matter) produced by anthesis, requiring around 160 mm rain or equivalent stored moisture (a clay near field capacity could contain this amount).
If long-term weather data show this amount of water is not available in most years, yields will be less than 3 t ha-1 and a short duration variety might be most efficient for the area.
There is no point producing a lot of biomass before anthesis, as is possible with a long duration variety, if there is no water remaining after anthesis to fill the grains.
Data from Tel Hadya (Arab Republic of Syria), illustrate the variability of rainfall in the Mediterranean region. Over 23 years the average seasonal rainfall has been 337 mm, most falling between November and April and sufficient for good crops. However, there have been severe droughts. In February for example, average rainfall is 52 mm but this has ranged between 6 and 140 mm. Depending on interactions with developmental stage of the crop, yield in those years could be 0 and 4 t ha-1.
The soil as a bank for rainfall
The soil provides a store for rain water that the crop can access between rainfall events. If the soil is porous and deep, rainfall variability has less impact on specific yield components. Stress will develop more slowly and the plant will have time to adjust its structure without death of components.
If stress develops quickly during grain filling, as happens in shallow soils, the plant may not even have time before it dies to move stored carbohydrates from stems to help fill the developing grain.
It will be worth assessing with local farmers the depth and structure of their soils. Soils may change over short distances particularly where topography is undulating and steep. Discuss the farmers’ observations of crop performance across the region that might bear on soil type. Do some digging or soil tests if necessary to determine whether soils can be improved in their ability to capture and carry available water better between rainfall events.
Water at the right time for optimizing yield
The pattern of water availability and use within the season can alter not only biomass production and grain yield but also the apportioning of dry matter between them (Harvest Index). The sliding relationships are shown in the figure.
You need to be careful how you assess harvest index (HI). Ahigh value towards 0.50 (50percent of crop weight being as grain) is usually considered to be good. High HI can however, occur when yield is poor as well as when yield is high. The following circumstances illustrate the possibilities. Check the figure as you read on.
How apportioning of the season’s water before and after anthesis can change yield, biomass (the dry weight of the crop), and the ratio of yield to biomass (harvest index)
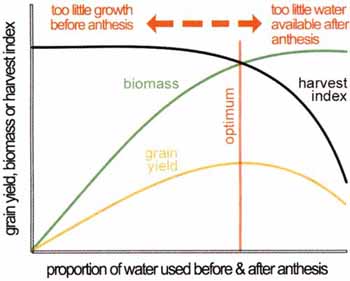
To the left of the optimum, low yield results from the crop growing poorly before anthesis. It is unable to use its water supply fully. Though this leaves ample water for grain filling, the crop has been unable to produce enough grain sites by anthesis to exploit water to generate a big yield. Though this is an undesirable outcome, harvest index will be high and thus, low biomass can lead to high HI.
To the right of the optimum the crop has grown vigorously and used up its water supply before anthesis in making biomass. Although it has adequate grain sites for a large yield, the grains are not filled because water is exhausted too early. Then the harvest index is low.
What the farmer should aim for is a balance between the previous two situations, aiming to have just enough water remaining in the soil at anthesis to completely fill all grain sites. This will produce a high HI in association with high yield.
HI is used later in association with values of water use efficiency to assess how well crops have performed and identify what might have gone wrong. The farmer may find these concepts too difficult.
However, measuring the proportions of different yield components at maturity can also help to identify when and where the problems of a crop occurred.
The farmer should have little difficulty understanding yield components if the ideas behind the earlier figure of plant development are clear.
When should you analyse yield components?
Wheat crops are quite plastic in the way they can allocate growth to different components, putting more or less into particular structures depending on current weather.
This flexibility aims to preserve yield potential despite intermittent weather constraints. The composition of yield components at maturity is a reflection of the history of the plant’s coping with the weather. Consequently, analysing the yield components at maturity can help unravel what went right or wrong during growth of the crop. It helps to show what an experimental treatment did.
Yield component analysis is not something that you always need to do. It can be very time consuming. Plot grain yield and biomass may be all you need. However, in case you and the farmer decide that it is necessary for your study, you can follow the detailed procedures below.
Measurements of fresh crop material to determine yield and yield components
The least measurements to take at maturity are plot grain yield and harvest index. Also take 100-grain weights from the grain threshed from the harvest index sample. From these you compare kernel (individual grain) weights and estimate kernel number across your treatments.
Record the information for each plot, together with the plot identifier and date, on a table that was prepared in advance of harvest time. The chapter Optimizing variety x sowing date for the farm explains how to design tables.
For these measurements it is vital to measure and record the plot areas actually harvested to work out production per unit area. Otherwise the comparisons between treatments become nonsense.
It is also vital to bring all samples to similar water content before making comparisons, as water is very heavy. Spreading out and quickly drying all samples on a hot day in the sun, at the same time before weighing, may achieve this satisfactorily. Preferably use a dehydrator oven at a set temperature as this standardizes the water content of samples.
The sooner this is done after harvest the better, as any losses of material to respiration or accidents will negate the work of the studies.
At anthesis (a hand-harvest)
Collecting samples for a detailed study
1. As each treatment reaches anthesis, walk down one side of the plot and in three places grab four to eight culms including the stem, leaves and spike and cut them off at ground level with a serrated knife or secateurs. Repeat down the other side of the plot keeping the bundle of culms in one hand and adding to it with each grab. Try and retain as much dead leaf as possible. You should end up with about 35-55 culms. Do not sample from edge rows. Sampling in the early morning or late in the day is best.
2. If you have large plastic bags, put each sample into a bag with a dated identifying tag and go onto the next plot ready to harvest, take grabs, and put into another bag with a tag and so on until all plots that are ready have been sampled. Move all bags to a cool room with a bench. Keep samples out of the sun until they can be processed. It is possible to sample 30 plots per hour per person using this method.
3. Count fertile culms (stems with heads expected to produce grain) and sterile culms (stems which will not produce grain) in each grab sample. Do not lose dead leaf. Measure average height (not including the awns) of the bundle and estimate the average head length from four to five heads. Record plot and treatment identifiers and estimates and measurements on your previously prepared sheets.
4. Fold the sample several times, put in a paper bag and staple closed. Put into a dehydrator at 70-80 °C. You can process 20 to 30 samples per hour per person using this method.
5. Depending on the capacity of your dehydrator, samples will dry in two to three days. If empty bags representative of those containing the samples are also placed into the dehydrator, these can be used as tare bags when weighing samples as they come out of the dehydrator.
At maturity (a hand-harvest)
6. Follow the collecting methodologies 1 and 2 exactly as described for the anthesis harvest.
7. Count fertile culms (stems with heads containing grain) and any sterile stems in the grab sample. Do not lose dead leaf. Measure average height of the bundle not including the awns and estimate average head length from four to five heads. Record treatment identifiers and measurements.
8. Cut the fertile spikes from the sample and place into a paper bag. Fold the remaining part of the sample (straw) several times, place into another paper bag and staple closed. Put into a dehydrator at 70-80 °C. You will process 10-20 samples/hour/person using this method.
9. After two to three days the straw sample bags can be removed from the dehydrator and weights recorded using a tare bag as for the anthesis sampling. The spikes should be kept in the dehydrator for seven days or until the dry weight is stable. Water loss from the grain is slow while spikes are intact.
At maturity (a machine harvest)
10. As soon as possible after the latest maturing plots are harvest ripe, trim the ends of plots and measure and record the harvestable plot length.
Do not harvest the edge rows of plots. They overestimate yield due to access to additional nutrients and soil water from the pathways between plots.
If you do not have the option to exclude the edge rows during machine harvest then some estimate of their contribution to yield must be made. Grain yield of edge rows can be 1.4 to 1.75 times the yield of inner rows.
11. As the total grain harvested from each plot is weighed, a grain sample of 500g needs to be separated and retained for determination of water content, hectolitre weight and screenings.
These 500 g subsamples are important because together with the harvest index samples they are used to calculate spike density, biomass and yield components for both anthesis and maturity.
The rest of the bag can be disposed of unless seed is needed for later trials.
Calculating yield and yield components
The calculations use some shorthand as below:
strawdw = dry weight of straw sample
spikedw = dry weight of sample of spikes
spikes = number of spikes in sample
graindw = dry weight of grain threshed from spike sample
100 kw = dry weight of 100 kernels
hsubgraindw = dry weight of 500 g subsample of grain from plot harvester
hgrainfw = fresh weight of grain harvested from plot harvester
The calculations of yield components follow:
subsample dry weight (subdry) = strawdw + spikedw
culm weight (culm) = subdry/spikes
grain weight/spike = graindw/spikes
harvest index (HI) = graindw/subdry
kernel weight (kernel) = (100 kw + 100 kw)/0.2
kernels/spike = (graindw/(kernel x 0.001))/spikes
dry yield = ((hsubgraindw/500) x hgrainfw)/(plot length x cutting width of harvester) i.e. yield for 70-80 °C oven dry weight expressed as g/m2
kernel number = dry yield/(kernel x 0.001)
biomass = dry yield/HI
spikes/m2 = biomass/culm
Calculating anthesis biomass
Anthesis culm = anthesis subdry/anthesis spikes
Anthesis biomass = anthesis culm x spikes/m2
As yield in Mediterranean environments is so commonly limited by water, it is vital to measure not only the total amount of rainfall but also its distribution within the season, as this affects the composition of the yield components.
Furthermore, it will be very useful to know how much water gets into the soil store and is extracted from the soil.
These measurements will enable you to calculate crop water use and crop water use efficiency (WUE).
They will tell you whether the available rainfall is being converted optimally into yield or whether some is being wasted.
They will also show what impact your experiment treatments are having on the use of available water to produce yield.
Next figure gives an example of how nitrogen applications can alter the amount of yield that can be produced per unit of water the crop uses.
How N can change the relationship between yield and water use
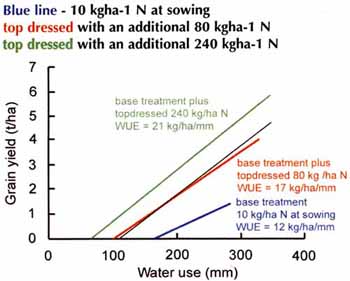
Measurements needed to calculate crop water use and water use efficiency
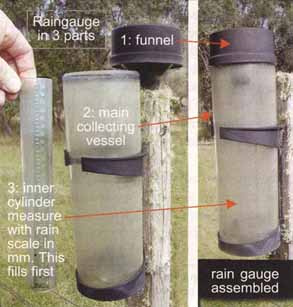
Before sowing a rain gauge should be installed near the farmer’s dwelling or at the trial site to measure rain throughout the season. Readings should be taken on a regular (weekly) basis, recorded and the gauge emptied. The gauge is estimating the amount of rain the crop receives so it should be well away from overhanging trees or other structures. This basic measurement takes only five minutes each week and is vital.
The three parts of a rain gauge
You need to take soil samples to estimate the amount of water stored in the soil at the beginning of the crop cycle and the unused water at the end. These measurements could take up to half a day twice in the season.
At sowing and harvest use a hand auger or thin walled tube to sample to 0.6 m deep. Bulk the sample into a plastic bag. Take two or more samples from each plot. Record their plot location on the bag.
Weigh the extracted ‘wet’soil samples and then mix each sample well within its plastic bag before subsampling. Weigh the subsamples ‘wet’ and then dry at about 104 °C before reweighing.
Measure the diameter of the cutting surfaces of the auger so that bulk density of the soil and volumetric water content can be calculated as below. Write down all weights and measurements in prepared tables as you go.
Assuming that no water drains below the soil depth tested or that run off occurs during high intensity rainfall events (see the chapter on Suitable methods of tillage for the farm for how to measure runoff), these on-site soil and rainfall measurements enable you to estimate crop water use as follows.
Calculating crop water use
These calculations may seem complex, but try them and you will find they look more difficult than they are.
Gravimetric water content (%) =
((weight wet soil subsample -weight dry soil subsample)/weight of dry soil subsample)*100.
Dry weight of soil extracted from hole (g) =
(weight dry soil subsample/weight wet soil subsample) x weight all wet soil taken from hole.
Volume of soil extracted from hole (cm3) =
(diameter of soil auger/2)2 x 3.14 x depth of hole (e.g. for a 10 cm auger and a 60 cm hole the volume would be 4710 cm3).
Bulk density of soil (g/cm3) =
Dry weight of soil extracted from hole/volume of soil extracted from hole. Expect about 1.45 for loam and 1.37 g/cm3 for deep sands.
Volumetric water content of soil =
Gravimetric water content (%) x bulk density (g/cm3) x depth of sampling (cm) x 0.1 (multiplier to give mm water).
Crop water use (mm) =
(Volumetric water content at sowing -volumetric water content at maturity) + rainfall between two periods of soil sampling.
|
You can get a rough idea of crop water use by totalling rainfall in mm between sowing and three weeks before the crop is ripe minus 110 mm for losses to evaporation. Also you can estimate water use efficiency (WUE) roughly by dividing grain yield in kg by the above-mentioned crop water use in mm. You should get WUE values between 10 (poor) and more than 15 kg ha-1 per mm water (good). |
Calculating crop water use efficiency
Water use efficiency is a measure of grain yield expressed per mm of water that the crop uses.
You can get a first approximation of WUE by dividing harvested grain yield by rainfall totalled over the season (as measured by the farmer using the rain gauge). It is usually suggested that you subtract 110 mm from your total rainfall to allow for unmeasured losses. You would use this calculation if you had not had time to collect any soil samples.
Values of more than 15 kg grain per hectare per mm of water used means that the crop has performed well. Less than 10 kg ha-1 per mm of water used indicates that the crop has been limited by something other than water such as disease, poor nutrition, or Estimating crop cover frost.
If you have these numbers for your crops you can calculate the potential yields for the region as limited by water. For example, the Tel Hadya area (Syrian Arab Republic, see earlier) should produce yields of over 3 t ha-1 from its average season rainfall of 337 mm.
Calculating WUE more accurately
Though the simple way to estimate WUE is to divide harvested grain yield by crop water use as above, such a calculation includes the water that the crop cannot access and thus underestimates efficiency.
This inaccessible water includes:
1. Water that is lost through evaporation from bare soil between the crop plants, sometimes assumed to be about 110 mm;
2. Water that is so tightly held by the soil that the crop cannot extract it. This lower limit of extractable water varies between soil types.
Assuming a 60 cm deep soil, the approximate lower limits of water remaining after extraction are 110 mm (red-brown earth), 80 mm (loam red earth), and 30 mm (deep sands).
If you can more closely estimate (1) and (2) you can improve your assessment of WUE, although, if you measure water in the soil at sowing and again at maturity, (2) is not important.
Estimating evaporation from bare soil (1)
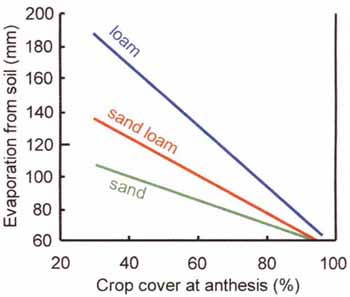
Do this by first estimating crop ground cover at anthesis. Look at the crop in several places around the field at an angle of 45° through the hole created by putting the tip of your index finger and thumb together and estimating the percentage of the hole covered by crop, not soil. A denser crop at flowering intercepts more sunshine over the whole season and consequently has lower total soil evaporation (see figure of soil evaporation).
Estimating crop cover

H.M. RAWSON
Use your percentage crop cover in association with the soil evaporation figure and for the nearest soil type, read off your value of soil surface evaporation for the season. For example if crop cover at anthesis was 70 percent and your soil was a sandy loam, evaporation will be about 90 mm. This is the value you subtract from seasonal rainfall (instead of 110 mm) to give a more accurate crop water use in (1).
Once you have adjusted your crop water use for crop cover at anthesis, recalculate the more accurate estimate of WUE. Use this new estimate to assess how efficiently your crop really is using its water.
Season evaporation from the soil surface for three soil types as related to percent crop cover at anthesis
You may have some data from an old trial that allows you to roughly calculate WUE from seasonal rainfall.
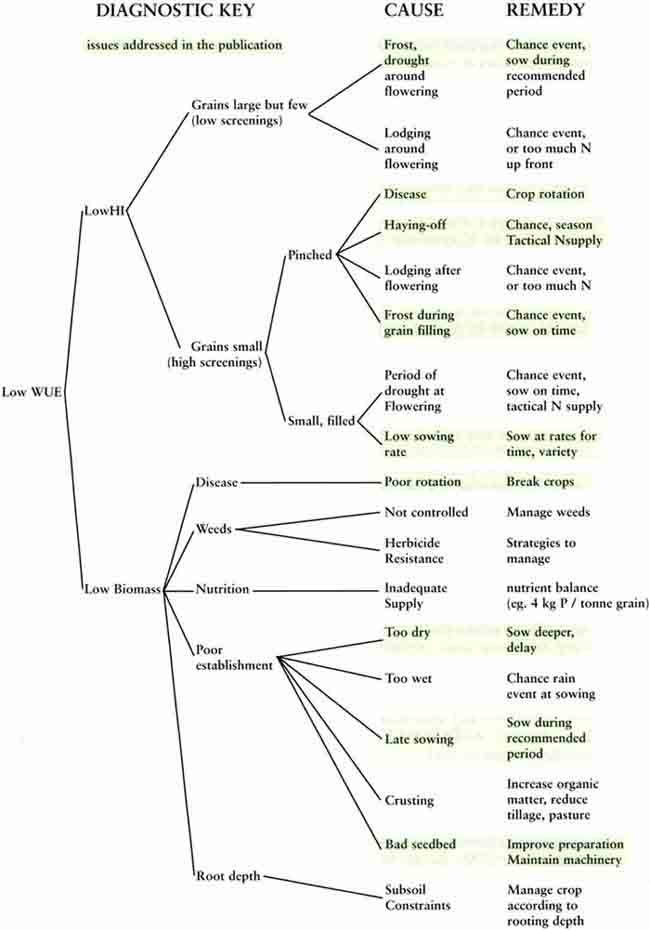
Try the diagnostics key over page to see how well it identifies any problems you observed. The key also highlights in green, some problem areas that are addressed in the chapters accompanying the current chapter.
A set of trials addressing major yield determining crop management issues is proposed. These five trials are designed with the expectation that they will need some modifications to adapt them to local questions and circumstances. They clearly do not cover all possible questions but are conceived as a core set that will be added to by other experimenters. Contributions are invited from anyone who feels they can cover a topic of their choice. Guidelines are available explaining how to write a chapter. It is simple to produce an e-article (chapter) on Ecoport that will be available immediately to other Internet users.
Due to climate variability, trials designed to optimize crop production through changed farm methodologies should be repeated for at least three years. In fact, as farmers adopt changed technologies resulting from the trials, further experiments are likely to be needed to readapt the farm to the new situation. Changed economics, considered within the trials, may play a part. This is a dynamic building process.
The proposed trials are independent but at the same time are related showing where addressed issues interact. For example, a change from conventional to zero tillage will require a re-evaluation of varieties and sowing dates.
Optimizing variety x sowing date for the farm
The combinations ensure that the varieties reach anthesis at the optimum date for the location. The experiment also assesses the loss in yield due to straying from those dates. It will help to answer questions like: i) when is the optimum period for anthesis? ii) could a slightly longer or shorter cycle variety be better suited to the farm than conventional ones and when should it be sown? iii)what is the yield penalty for sowing later than the conventional date?
Optimizing plant population, crop emergence and establishment
Farmers may reduce their costs of seed and weed control through adjustment of seed rate. Furthermore, crop yields can be increased through improved seeding methods. The trial uses techniques to work out optimum plant population. It is of particular interest in areas using seed rates over 100 kg ha-1 yet failing to achieve good plant populations. It will be useful where there are weed problems, particularly where weeds are emerging before the crop and reducing grain yields.
Suitable methods of tillage for the farm
This trial compares crops grown under three tillage systems: full or conventional tillage, minimal tillage and no tillage. It focuses on long- term protection of the soil resource; reduced machinery wear and savings in fuel costs and labour. It is a potentially important trial in areas where water is a major limitation to production and where soil structure is poor and erosion a problem. It could also be important where the optimal sowing date is frequently missed because of time lost through conventional tillage.
Optimizing nitrogen use on the farm
Growers should aim to match the supply of nitrogen with the requirements of the crop. Crop requirements constantly change depending on available soil water and rainfall.
The trial will help to identify if nitrogen is a prime limitation to yield. It explains how to calculate how much N should be applied and when it should be applied to ensure that yield responses are more consistent from year to year. It is of particular interest where little or no nitrogen is applied to crops either directly or via rotation crops; where lower yields than reported from regional research trials are obtained; where symptoms of haying-off appear and where rainfall during the season and across years is very variable.
What is the best cropping sequence for the farm?
This trial will be of particular interest where wheat has been cropped continuously for many seasons; where yields have declined inexplicably; where root diseases or nematodes are a problem; or where there are markets for crops other than wheat. The trial shows how to introduce alternative species (break crops) into the cropping sequence. It explains that interactions between the wheat and break crops, including the roles of nitrogen, water, disease and weather are complex. It examines these complexities and explores how and why they might influence the performance of wheat in different sequences.
Finally:
Why do any of your research on-farm?
If you are not convinced that you should do your trials on-farm, read this chapter that explains why. It also defines trials, how to approach and design them, and how to interact with collaborating farmers.
You may find one or more chapters seem suitable for local use without change, at least initially. However as you use them in interaction with farmers describing their local circumstances, you will find they need adaptation. Modify them as the need arises because your modifications will be useful to other farmers in the region. Optimizing production locally or within a small region is the base aim of the guidelines.
The present chapters address single factor limitations (e.g. nitrogen) but also complex interlinked issues such as sowing date and nitrogen. Trials addressing single or interlinked subjects will often give confusingly different results when the trials are done across regions. This may be because third, fourth or more factors including water and temperature dominate response.
The final design of such prospectively complex trials where large interactions are expected is best decided by specialists from appropriate disciplines in discussion with extension workers and farmers.
This is particularly appropriate when the same guidelines are to be used across regions, such as if a National Extension Service decides to use them as a general means for reaching farmers. The following steps are contemplated in this initial adaptation:
1. Where? Identify the zone or regions where the approach would be of potential economic benefit or encourage sustainability.
2. What? Organize a workshop for a selected small group of specialists from varying disciplines, extension workers and farmers. Decide there what topics and linked trials are required and adapt the guidelines accordingly.
Review the guidelines and identify and remove the parts that do not apply locally. Replace any example data with local data;
Identify topics not covered by the chapters but considered critical to the region. Target them for new chapters;
Invite participants singly or in pairs to develop and draft these new chapters.
This active personal involvement at the outset should stimulate commitment to the project, but only by those with genuine interest.
3. Workplan developed with local community.
Discuss the adapted and new chapters with prospective participating farmers and invite them to collaborate in the trials on their farms. Explain the benefits and drawbacks. Enlist those with firm commitment;
In discussion with committed farmers, develop a work plan for conducting trials. Discuss and define activities, measurements and recordings to be taken during the trial;
Together identify any training needs;
Consider parallel trials on the research station.
4. Training. During the initial interactions the need for specific training may emerge. Consider the following areas:
Participatory methodologies: learning from each other for researchers, farmers and extension officers; how to approach sharing skills and knowledge;
Sustainability concepts and indices and their application within the chapter topics;
How crops develop and what drives them;
How to conduct demonstration trials;
Involving local manufacturers in adapting and developing machinery for tillage systems;
Discussing target markets, diversifying market opportunities, farmers’ organizations, integrating livestock into farming systems;
Organizing study tours within or outside the country to learn how others approach problems;
Consider new and specific activities carried out by women: e.g. seed production and particularly storage, quality and nutrition.
5. Conducting trials
6. Evaluation at the conclusion of the project.
Analyse and discuss the results when all participants are present;
Identify and record any problems experienced by the farmer, specialists and extension agents. Discuss how to avoid them in future trials.
During discussion, modify the chapters in view of the experience of the trials.
The pamphlets will now be ready for broader use.
Writing chapters
Current chapters only cover a nucleus of topics. If you perceive a need for a further topic and would like to contribute guidelines on that topic, please do so. The instructions below will help.
Structure and contents of each chapter
A simple explanatory title.
A summary of the chapter noting where and why the experiment should be done, its core treatments, the potential benefits, its duration and which other chapters are required for additional methodologies.
A list of the characteristics of farms that could benefit from the proposed trials.
Explanation of any special terminology used.
Background information required so reasons for and results of the study can be understood.
Description of a case study, no more than two pages long. This may be one you have done, one extracted from the literature, or a study combined from several sources. It should be similar to the trial that you are proposing and illustrate likely responses with real numbers.
The trial you are proposing. This is the core of the chapters and should include aims; what materials or facilities you will need before starting; the methods to be used; a list of treatments, the way they should be laid out in the field and their physical dimensions; observations and measurements to make during the study and ways of recording them including perhaps example tables; details of any methods of calculation and data analysis; a discussion of how to interpret the results.
How to interpret the results of the proposed trial. Maybe do this by presenting an imaginary study containing examples of several scenarios. Alternatively, you can refer back to your case study to discuss likely scenarios. Finally you could describe possible scenarios without using numbers. All these approaches are used in example chapters.
Gross margins calculations. This is to enable the researcher and collaborating farmer to see at a glance the possible economic impact of the trial. Additionally it shows farmers how to construct their own analyses.
A conclusion and a list for further reading.
Each chapter must provide enough background to the subject so that even the non-specialist reader understands reasons for the approaches.
General tips for writers
Provide only the information that is necessary to get over your message. Hold back the strong temptation to be expansive.
Keep your language simple. Avoid complicated sentences and particularly ambiguities. Preferably use short sentences.
Use plenty of headers and sub headers and pictures and graphs where appropriate.
Only include methodologies that are going to be used to explain a result in the experiment. Do not mention approaches that might be nice to use or that are common practice if they have no function in your study.
EXPLORE ON-FARM is on the web
The core chapters are on the web for reading and printing at www.ecoport.org as e-articles.
Use the following hyperlinks to go to them.
Why do any of your research
on-farm?
http://www.ecoport.org/EP.exe$EAFull?ID=165
Constraints to cereal-based rain-fed cropping in
Mediterranean environments and methods to measure and minimize their
effects
http://www.ecoport.org/EP.exe$EAFull?ID=164
Optimizing nitrogen use on the
farm
http://www.ecoport.org/EP.exe$EAFull?ID=161
What is the best cropping sequence for the
farm?
http://www.ecoport.org/EP.exe$EAFull?ID=160
Suitable methods of tillage for the
farm
http://www.ecoport.org/EP.exe$EAFull?ID=159
Optimizing plant population, crop emergence and
establishment
http://www.ecoport.org/EP.exe$EAFull?ID=163
Optimizing variety x sowing date for the
farm
http://www.ecoport.org/EP.exe$EAFull?ID=157
The self-help booklet
Irrigated wheat: managing your crop,
is
http://www.ecoport.org/EP.exe$EAFul?ID=62
Most figures and tables in the web presentations appear only when you mouse click on their underlined or highlighted links in the text (e.g. see figure 5). The linked figure will then be displayed on-screen in a separate pane.
You will need structured records to remind you of any special observations made of your experimental crop and any management actions taken. The usual way to make such records is on a date basis in a diary. If you can make them on both a date and a crop development basis on field sheets, this will make them even more useful when the time comes to interpret the trial. Basing observations on development allows you to make comparisons between crops in different locations. You can compare their state at equivalent stages of development.
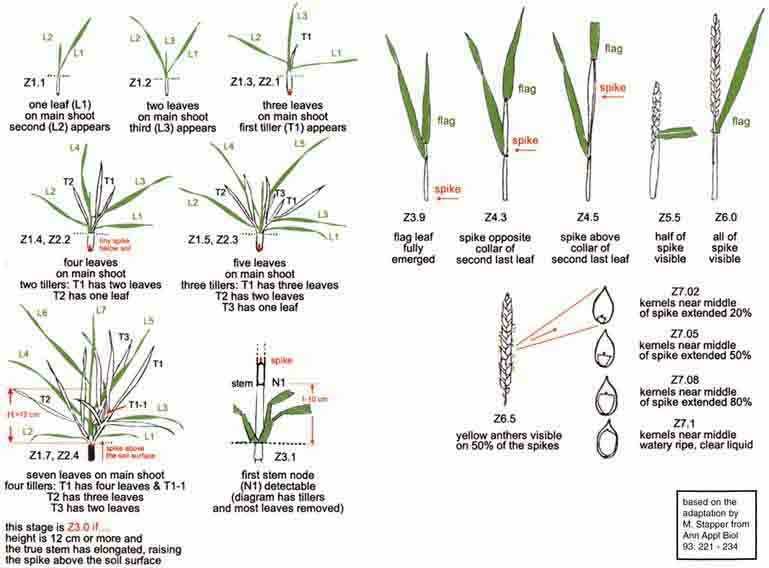
You will find example field sheets on the following pages. They already have example entries in red (whiteout those entries and then photocopy the cleaned sheets for your trials if you like). The blue entries are descriptions of good crops that you might like to aim for as the experiment progresses. You can use your observations to calculate whether you are ahead of or behind the blue targets. If your calculated numbers disagree substantially with the blue targets, things that you might like to check in your crop are also listed. Use the pictures of the Zadoks growth stages on later pages to help you enter the stages of development correctly.
|
The blue targets may be different in your region. Change them if you know the values. If not, do the required trials to estimate them. |
Take field sheets with you to the field. Use the same field sheet each time you visit that field. At each visit, make notes of unusual conditions of the crop such as herbicide damage, frosted leaf tips, frost damage on spikes and any leaf curling. An accurate record of crop management as the season progresses (sowing, fertilizers, weed and disease control, irrigations, harvest) will help you to identify which factors limit yield most.
At each visit, write down the date in the first column opposite the plant growth stage that you have identified. Notes in the second column and pictures on the sample sheets will help you to decide on the plant growth stage. The third column is for your estimate of ground cover as it increases from seedling emergence towards flowering and green leaf number reductions thereafter. The fourth column is for a summary of your management decisions as the crop advances and for dates of your actions. The rows that cut across the full table width are for your calculations of the state of your crop.
The field sheet calculations assume that you have drilled your crop in 18 cm rows but they will be equally useful if you have used other row spacings or broadcast your crop. Check in the chapter on crop establishment for comparisons between drilled and broadcast crops.
The example numbers in the field sheets assume also that you take measurements based on several samples within your crop using 1 metre length of rows as the basic sample. You will need a stick or other measuring tool 1 m long as your standard to lay down next to rows so you can count plants or spikes along that measured section. It is good policy to return to the same row sections for subsequent measurements, so preferably mark the random measured sections on your first visit. At least ten measured samples give a good average, but go for a number you can reasonably achieve, and preferably more than ten.
You will find that field sheets are an efficient way of keeping records. They are altogether in just two pages. Imagine unscrambling a whole season’s worth of data spread throughout a diary with several trials all jumbled together. Even worse is a set of data written on your palm; handy but biodegradable.
The field sheets are a way of keeping a crop diary, but you may have a number of harvests that cannot be added to those field sheets. The chapter on Optimizing variety x sowing date for the farm provides guides to designing tables for harvests while the detailed section in this introductory chapter on yield components tells how to sample your crop and calculate yield components from the samples.
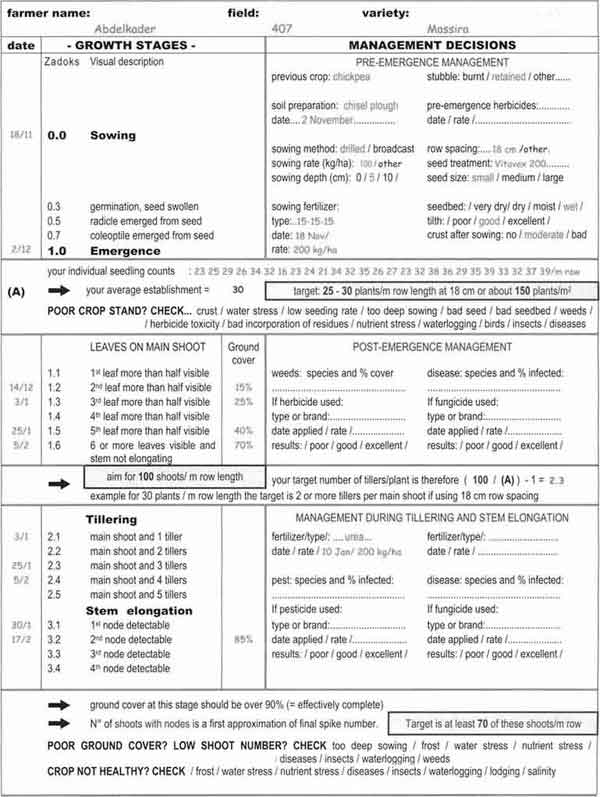
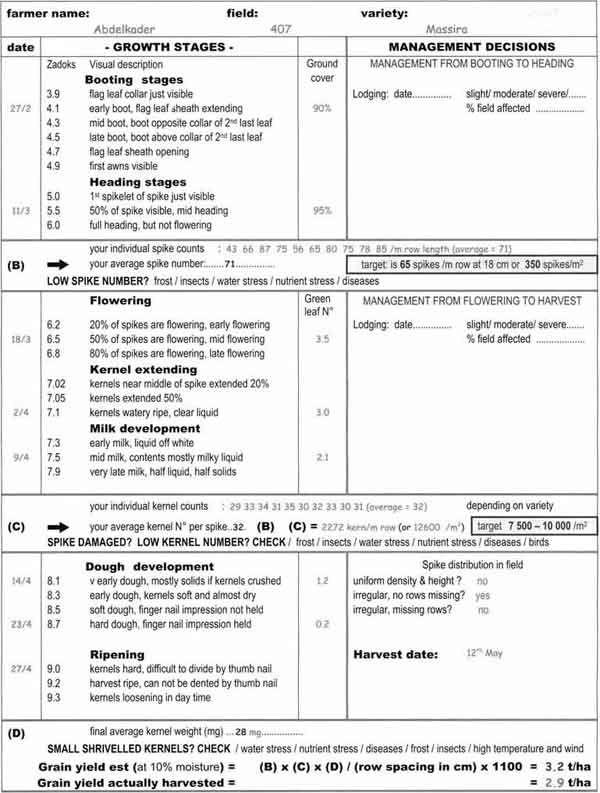
Field sheets adapted from Maarten Stapper and David Murray (SIRAGCROP)
Zadoks development stages
