![]()
![]()
![]()
A number of methods exist that can be used to select a sample. In the next paragraphs the most common sample designs are described.
Simple random sampling is a method of selecting n units out of the N such that everyone of the NCn distinct sample has an equal chance of being drawn. In practice a simple random sample is drawn unit by unit. The units in the population are numbered from 1 to N. A series of random numbers between 1 and N is then drawn, either by means of a computer programme that produces such table. Random samples are particularly useful when little is known about the target population.
When a number that has been drawn is removed from the population for all subsequent draws, the method is also called random sampling without replacement. Random sampling with replacement is entirely feasible: at any draw, all N members of the population are given an equal chance of being drawn, no matter how often they have already been drawn.
In stratified sampling the population of N units is first divided into subpopulations of N1, N2,...,NH units, respectively. These subpopulations are non-overlapping, and together they comprise the whole of the population, so that:
N1 + N2 +...+ NH = N (6)
The subpopulations are called strata. To obtain the full benefit from stratification, the values of the Nh must be known. When the strata have been determined, a sample is drawn from each, the drawings being made independently in different strata. The sample sizes within the strata are denoted by n1, n2, ..., nH, respectively. If a simple random sample is taken in each stratum, the whole procedure is described as stratified random sampling.
Given the above definition, we can state that stratified random samples take advantage of additional information of the fishery. For example, if boat length information was available, the survey could be stratified on the basis of this variable. The idea is to group boats into (what are considered to be) relatively homogeneous groups. For example, the boats could be grouped into several strata on the basis of the region they belong to.
Stratification is a common technique. There are many reasons for this; the principal ones are the following.
1. If data of known precision are wanted for certain subdivisions of the population, it is advisable to treat each subdivision as “population” in its own right.
2. Administrative convenience may dictate the use of stratification; for example for socio-economic indicators in the Mediterranean stratification per management units could be advisable.
3. Sampling problems may differ markedly in different parts of the population.
4. Stratification may produce a gain in precision in the estimates of characteristics of the whole population. It may possible to divide a heterogeneous population into subpopulations, each of which is internally homogenous. This is suggested by the name strata, with its implication of a division into layers. If each stratum is homogeneous, in that the measurement vary little from one until another, a precise estimate of any stratum mean can be obtained from a small sample in that stratum. These estimates can then be combined into a precise estimate for the whole population.
5. The potential for sample bias is reduced through using a stratified random sample. Since the population has been stratified, a balanced sample can be chosen that is more likely to be representative of the population than a purely random sample. Consequently, smaller samples can be selected than using a purely random sample
The theory of stratified sampling deals with the properties of the estimates from a stratified sample and with the best choice of the sample size nh to obtain maximum precision. The problems of how to construct strata and of how many strata there should be are presented in the next paragraph.
In the planning of a sample survey, a stage is always reached at which a decision must be made about the size of the sample. The decision is important. Too large a sample implies a waste of resources, and too small a sample diminishes the utility of the results. The decision cannot always be made satisfactorily; often we do not possess enough information to be sure that our choice of sample size is the best one. Sampling theory provides a framework to solve these problems.
The principal steps involved in the choice of a sample size are as follows.
1. There must be some statement concerning what is expected of the sample. This statement usually is in terms of desired limits of error.
2. Some equation that connects n with the desired precision of the sample must be found. The equation will vary with the content of the statement of precision and with the kind of sampling that is contemplated. One of the advantages of probability sampling is that it enables this equation to be constructed.
3. This equation will contain, as parameters, certain unknown properties of the population (for instance the variability of the investigated phenomenon). These must be estimated in order to give specific results.
4. Finally, the chosen value of n must be appraised to see whether it is consistent with the resources available to take the sample. This demands an estimation of the cost, labour, time and material required to obtain the proposed size of sample.
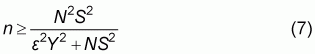
In the case of simple random sampling, the formula for the definition of the sample size, n, is the following:
where:
N is the number of units in the population,
e is equal to q/2, where q is the maximum error that is accepted for the final estimates,
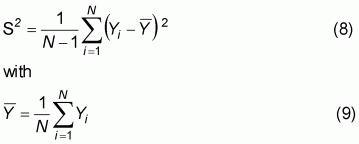
S2 is an estimate of V(Y), total variance of the phenomenon in the population and is given by:
In the case of single stage stratified sampling, and in the hypothesis of extracting the sampling units with equal probability and without re-pooling, the formula to calculate the sample size, for a maximum error of 2q, and with a probability equal to P=95%, is the following:
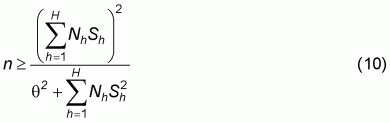
where, H is the total number of strata, Nh is the population size in the stratum h, S2h is the estimate of the variance in the stratum h.
Once the sample size has been obtained, the allocation among strata has to be defined. The allocation across strata can be assessed on the basis of two different methods:
the proportional criterion, in each stratum we have the same number of units:
nh = n/H
the Neyman criterion, by which a variable percentage of elements is drawn from each stratum in order to minimise the value of the variance. In this case, the formula is:
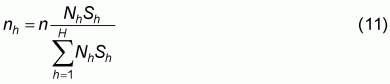
In order to apply the previous formulas No. 7, 10 and 11 a pre-estimate of the S2(h) variances is required; in other words, the variances of the target variables of the survey must be known. For this purpose, the results of previous sampling survey can be used. In the case this information is not available, a pilot study can be developed to have an indication of the variability of the investigated phenomenon.
In most surveys information is collected on more than one item. Sometimes the number of items is large. In particular, fisheries surveys are generally multivariate, that is, the variables investigated are more than one (revenues, costs, employment, etc.).
If a desired degree of precision is prescribed for each item, the calculations lead to a series of conflicting values of n, one for each item. It may happen that the n’s required are all reasonably close. If the largest of the n’s falls within the limits of the budget, this n is selected. More commonly, there is a sufficient variation among the n’s so that we are reluctant to choose the largest, either from budgetary considerations or because this will give an over-all standard of precision substantially higher than originally contemplated. In this event the desired standard of precision may be relaxed for certain of the items, in order to permit the use of a smaller value of n.
However, nowadays with progress in sampling theory and software technology some methods are available to menage the problem of the sample size with more than one item.
In particular, we give a brief description of the Bethel method that is the application of Neyman’s method to the multivariate case. The approach used by this method is to transform the analysis into a linear programming model that allows the identification of the sample size and the allocation across strata, minimising the variances of all variables simultaneously (see also Bethel, 1989).
The optimal allocation across strata for multi-scope studies has been solved by Bethel using the Kuhn-Tucker theorem and then deriving the expressions for the optimal allocation in terms of the LaGrange multipliers. The Bethel method has been implemented on SAS basis (the implementation algorithm is reported in appendix D). Appendix E reports a comparison of the results and relative costs of the two different statistical sampling techniques (Neyman and Bethel).
In the previous chapters we saw how sampling theory can be employed to obtain information about samples drawn at random from a known population. From a practical viewpoint, however, it is also very important to be able to infer information about a population by use of samples drawn from it. Such problems are dealt with in statistical inference, which uses principles of sampling theory.
One important problem of statistical inference is the estimation of values referred to the population (such as population totals, means, variances, etc.) from the corresponding sample data.
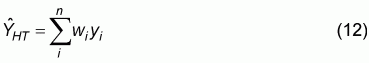
In this manual, the Horvitz-Thompson estimator is reported, but a lot of other estimators exist that have been studied by the sampling theory.
The Horvitz-Thompson estimator is used to estimate the total values (for examples total catches, total revenues, total employment, total costs, and so on).
In the case of simple random sampling, and in the hypothesis of extracting the sampling units with equal probability and without re-pooling the formula is:
where wi = N/n, and yi are the observed values from the sample units.
In the case of a stratified random sampling, and in the hypothesis of extracting the sampling units with equal probability and without re-pooling, the formula is:
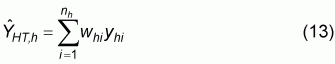
with:
nh sample size in the stratum h;
whi = Nh/nh:
yhi, sample data of the unit i in the stratum h.
The sample theory assumes that some kind of probability sampling is used and that the observations yi on the ith unit is the correct value for that unit. The error of estimate arises solely from the random sampling variation that is present when n of the units are measured instead of the complete population of N units.
These assumptions hold reasonably well in the simpler types of surveys in which the measuring devices are accurate and the quality of work is high. In complex survey, particularly when difficult problems of measurement are involved, the assumptions may be far from true. Three additional sources of error that may be present are as follows.
1. Failure to measure some of the units in the chosen sample. This may occur because of their refusal to answer the questions.
2. Errors of measurement on a unit. The measuring device may be biased or imprecise. The respondents may not possess accurate information or they may give biased answers
3. Errors introduced in editing, coding and tabulating the results.
These sources of error necessitate to develop methods for computing standard errors and confidence limits that remain valid when the other errors are present.
The standard deviation is used to provide information about the relative distribution around the estimates. The level of confidence is related to the amount of variation around the estimates, so it is related to the standard deviation. Also, from the Central limit Theory, the larger the sample size, the greater the confidence in the estimate. Therefore the level of confidence is related also to the size of the sample.
The standard error is an indicator of the level of confidence in the estimate. In the case of stratified random sampling, the standard error is given by
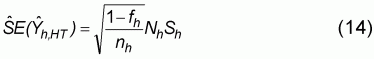
where s is the standard deviation of the sample and fh is equal to nh/Nh.
Standard errors are often expressed as relative standard errors in survey reports. These are the standard error expressed as a percentage of the mean. The relative standard error is given by
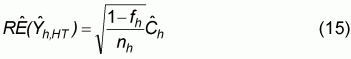
where Ch is the estimate of the variation coefficient.
Standard errors provide information about the confidence interval around the estimates. Assuming that the distribution is normally distributed around the estimate value, there is a 95 per cent probability that the true population value is within 2 standard errors of the sample value. That is, there is a 95 per cent probability that

For small samples, the confidence interval is defined by the t distribution, such that

where t0.025,n-1 is the critical value of the t-statistic at the 5 per cent level of significance and n-1 degrees of freedom. This value can be read off any t-statistic table. For the number of observations in the sample, the critical values of the t-statistic ranged from roughly 2.1 to 2.6 depending on the number of observations in each size class. For the sample as a whole, the critical value is approximately 2. As the standard error is dependent upon the number of observations in the sample, the larger the sample, the smaller the standard error and the tighter the confidence interval around the mean. Consequently, the larger the sample, the more confidence that can be placed on the sample estimate.
Information can only be collected from those individuals selected willing to participate in the survey. However, a rejection may occur for a number of reasons, such as bad timing of the survey. A problem with rejection is that there is no guarantee that the individual who does not want to participate is the same as those who do participate. In some cases, there may be a correlation between rejection and the characteristics of the individual being surveyed. In such cases, exclusion of these individuals may result in a biased sample.
An advantage of the stratified approach is that another individual in the group can be selected to replace the reject. While this still may lead to some bias in the sample, the bias is not likely to be as great as in a purely random sample. This is because the reject is being replaced by another individual with similar characteristics, and the assumption is made that any individuals within the group are representative of the group. The greater the degree of stratification, the more likely this assumption is to hold.
Another way to treat the non-response is to adjust the initial weights whi on the basis of data referring to the responses (rh) and the non-responses (sh) of the sample (nh). The method consists in multiplying the initial weights (whi) by a factor (dh) equivalent to:
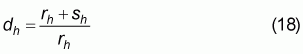
The hypothesis under this method is that a homogeneity of response exists within strata (Sarndal, Swensson and Wretman 1992). And in fact, the related estimator is called RHG (response homogeneity group).
![]()
![]()
![]()