![]()
![]()
![]()
Summary
The genetic relationship among Nigeria’s breeds of sheep and their crosses was studied using microsatellite DNA polymorphisms. DNA samples extracted from four Nigeria’s breeds of sheep (West African Dwarf, the Balami, Uda and Yankassa) and their crosses were analysed using 30Bovine microsatellite markers for diversity studies. Twenty of the markers were amplified by the sheep genome. Nineteen of the loci were polymorphic and were used to calculate genetic distances (Ds) between the breeds based on allele frequencies of the microsatellite. The phylogenetic relationships between the breeds were similarly estimated.
With the total number of loci studied, 285alleles were generated and a high degree of heterozygosity was recorded (0.57 to 0.72). A relatively high degree of reliability could be placed on the tree topology with the relationship between breeds displaying a closer relationship between the Yankassa and Uda (Ds 0.356). The genetic distance was 0.432, 0.534 and 0.665between the West African Dwarf (WAD) and the Yankassa, Uda and Balami respectively which also indicated a closer relationship between the Yankassa and the WAD compared to the essentially Northern breeds (Uda and Balami). This further confirms the evolutionary divergence of the breeds which makes them distinct entities.
The data suggests that microsatellite DNA markers are very useful tools for studying the genetic relationships among these sheep breeds. The highly polymorphic alleles could similarly be exploited in breed improvement and development.
Resumen
Se estudió la relación genética entre la raza ovina Nigeria y sus cruces utilizando microsatélite de polimorfismo de ADN. Las muestras de ADN extraídas de la raza Nigeria (West African Dwarf, Balami, Uda y Yankassa) y sus cruces, fueron analizadas utilizando 30 marcadores microsatélite bovino para el estudio de la diversidad. Veinte de estos marcadores fueron amplificados por el genoma ovino. Diecinueve de los loci fueron polimórficos y se utilizaron para calcular las distancias genéticas (Ds) entre las razas en base a la frecuencia de alelos del microsatelite. Las relaciones filogenéticas entre las razas fueron estimadas en modo similar.
Con el total de loci estudiados, se generaron 285 alelos y se anotó un elevado grado de heterocigosis (0,57 a 0,72). Podemos otorgar un cierto nivel de fiabilidad debido a la topología de los árboles junto con la relación entre las razas más cercanas como Yankassa y Uda (Ds 0,356). La distancia genética fue de 0,432, 0,534 y 0,665 entre la West African Dwarf (WAD) y la Yankassa, Uda y Balame, respectivamente; lo que también indica una relación más estrecha entre la raza Yankassa y la WAD en comparación con las razas provenientes del norte (Uda y Balami). Esto viene a confirmar ulteriormente la divergencia de evolución de las razas que hace de ellas entidades distintas.
Los datos sugieren que los marcadores microsatelites de ADN son una herramienta útil para el estudio de las relaciones genéticas entre estas razas ovinas. El elevado polimorfismo alélico puede también ser utilizado en la mejora de las razas y en su desarrollo.
Keywords: Sheep, Microsatellite DNA, Polymorphisms, Genetic Distance.
Introduction
The domestic sheep (Ovis aries) has, during the last 10000 years attained a relatively significant increase in body size, a decrease in horn size and a change from a hairy, moulty fleece to a white woolly fleece (Ryder, 1983). Hundreds of local breeds and strains have been developed for different production systems throughout the world.
Further genetic improvement has occurred in the last 50 years as a results of the application of quantitative genetics and selective breeding. In addition, studies of the physiology of the sheep have contributed to improved agricultural production and highlighted the sheep as a useful model in the study of mammalian reproduction and neurology (Crawford, et al., 1995). Many economically important traits in sheep such as growth rate, body composition, and disease resistance are multigenic in nature. If we are to understand the genetics of these complex traits, we need to know and exploit the wide genetic diversity that is present in the domestic sheep.
Mapping of highly informative markers covering the majority of the sheep genome (Lander and Bostein 1989) and the utilization of highly polymorphic microsatellite markers (Litt and Luty 1989; Tautz 1989) are the essential first steps.
Microsatellites are highly polymorphic two to five nucleotide repeat sequences (for example, CA, GT), repeats that are widely dispersed in the mammalian genome. They have been shown to be powerful tools in the genome mapping of man and his animals (Cornall, et al., 1991; Estoup et al., 1993).
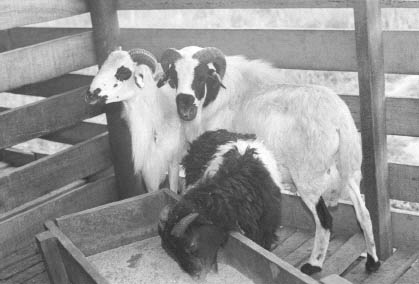
With a relatively unselected sheep population of more than 14 million in Nigeria, widely dispersed throughout the country, yet highly localized in their existence and adaptation, the need to characterize and exploit these diverse genotypes can not be over-emphasized. Nigeria has basically four definitive breeds of sheep - the West African Dwarf (WAD) (Figure 2), the Uda (UD) (Figure 3), Balami(BAL) (Figure 4 and 5) and the Yankassa (YANK) (Figure 2, 5 and 6). These are all adapted to different ecological niches except for the Yankassa which is widely spread across the country.
Figure 1. Dendrogram showing genetic similarities among four Nigerian and exotic sheep breeds from microsatellite data file. This tree is constructed from neighbour joining methods. Numbers at the nodes represent the percentage of a group occurrence in 100 boot strap replicates.
Figure 2. West African Dwarf (the smallest of the three) and Yunkassa (the bigger ones).
It is the aim of this study to utilize microsatellite DNA markers to genotype these sheep breeds and to determine their allelic differences and genetic relationship for future exploitation of their genes in breed improvement and development.
Materials and Methods
Animals
7 mls blood samples were collected from the jugular vein of 60unrelated sheep from Ogun, Oyo Plateau and Kaduna States of Nigeria (i.e. Southwest Middle-belt and North West) comprising the Uda(6), West African Dwarf (6), Balami (4) Yankassa (38) Uda x Yankassa cross (4) and an exotic breed the Merino (ME)(2). The buffer coat was extracted from these blood samples and was transported in 2 mls, Urea/Tris/EDTA solution, to Roslin Institute, Scotland, for the DNA extraction and analyses. The DNA was extracted using the Phenol/Chloroform extraction method with the DNA dissolved in 500 ml of sterile distilled water and stored at 4oC before analyses.
Genetic Loci
30 microsatellite markers, widely distributed across the cattle genome, and represented on the International Panel of Markers were used to screen the DNA samples. 20 of these markers amplified the sheep genome. Table1 shows the primer sequences, chromosomal location and accession numbers in the cattle genome database. The 10 loci that were not amplified by the sheep genome are also presented in Table 2.
Table 1. Primer sequences, assession numbers and allele sizes found in Nigeria's cattle and sheep.
|
S/N |
Marker |
CHR/DYE |
PRIMER sequences |
Species |
All size |
All no |
Ta |
Mg |
PCR Diln |
|
1 |
ETH 225 |
9 FAM |
GATCACCTTGCCACTATTTCCT |
CAT |
139-161 |
20 |
65 |
2 |
1:10 |
|
(D9S1) |
|
ACATGACAGCCAGCTGCTACT |
(SH |
132-154 |
17 |
65 |
2 |
1:05 |
|
|
2 |
INRA 35 |
16 TET |
ATCCTTTGCAGCCTCCACATTG |
CAT |
104-127 |
17 |
55 |
3 |
1:02 |
|
(D16S11) |
|
TTGTGCTTTATGACACTATCCG |
(SH) |
106-122 |
10 |
55 |
3 |
1:05 |
|
|
3 |
ILSTS 5 |
10 TET |
GGAAGCAATGAAATCTATAGCC |
CAT |
181-196 |
12 |
55 |
3 |
1:10 |
|
(D10S25) |
|
TGTTCTGTGAGTTTGTAAAGC |
(SH) |
189-204 |
16 |
55 |
3 |
1:05 |
|
|
4 |
ETH 152 |
5 FAM |
TACTGGTAGGGCAGGCTGCCTG |
CAT |
179-205 |
16 |
65 |
1.5 |
1:05 |
|
(D5S3) |
|
GAGACCTCAGGGTTGGTGATCAG |
(SH) |
190-205 |
11 |
65 |
1.5 |
1:02 |
|
|
5 |
ETH 10-2 |
5 FAM |
GTTCAGGACTGGCCCTGCTAACA |
CAT |
199-226 |
19 |
60 |
2.5 |
1:20 |
|
(D5S3) |
|
CCTCCAGCCCACTTTCTCTTCTC |
(SH) |
206-214 |
9 |
60 |
2 |
1:10 |
|
|
6 |
INRA 63 |
18 HEX |
ATTTGCACAAGCTAAATCTAACC |
CAT |
176-197 |
17 |
60 |
1.5 |
1:02 |
|
(D18S5) |
|
AAACCACAGAAATGCTTGGAAG |
(SH) |
162-182 |
12 |
60 |
3 |
1:05 |
|
|
7 |
INRA 5-2 |
12 HEX |
CAATCTGCATGAAGTATAAATAT |
CAT |
110-179 |
31 |
60 |
2.5 |
1:05 |
|
(D12S4) |
|
CTTCAGGCATACCCTACACC |
(SH) |
|
|
|
|
|
|
|
8 |
HEL 9 |
8 FAM |
CCCATTCAGTCTTCAGAGGT |
CAT |
149-171 |
21 |
60 |
1.5 |
1:05 |
|
(D8S4) |
|
CACATCCATGTTCTCACCAC |
(SH) |
94-108 |
4 |
60 |
2 |
1:03 |
|
|
9 |
HEL 1 |
15 TET |
CAACAGCTATTTAACAAGGA |
CAT |
101-125 |
22 |
50 |
1.5 |
1:20 |
|
(D15S10) |
|
AGGCTACAGTCCATGGGATT |
(SH) |
107-157 |
24 |
55 |
2 |
1:05 |
|
|
10 |
CSSM 66 |
14 TET |
ACACAAATCCTTTCTGCCAGCTGA |
CAT |
179-200 |
20 |
60 |
2 |
1:10 |
|
(D14S31) |
|
AATTTAATGCACTGAGGAGCTTGG |
(SH) |
173-213 |
22 |
60 |
2 |
1:10 |
|
|
11 |
MM 12 |
9 HEX |
CAAGACAGGTGTTTCAATCT |
CAT |
105-164 |
26 |
60 |
2 |
1:05 |
|
(D9S20) |
|
ATCGACTCTGGGGATGATGT |
(SH) |
83-102 |
11 |
60 |
2 |
1:05 |
|
|
12 |
ETH 3 |
19 FAM |
GAACCTGCCTCTCCTGCATTGG |
CAT |
103-131 |
21 |
60 |
1 |
1:10 |
|
(D19S2) |
|
ACTCTGCCTGTGGCCAAGTAGG |
(SH) |
96-119 |
17 |
55 |
2 |
1:05 |
|
|
13 |
BM 2113 |
2 FAM |
GCTGCCTTCTACCAAATACCC |
CAT |
124-147 |
16 |
60 |
1.5 |
1:05 |
|
(D2S26) |
|
CTTCCTGAGAGAAGCAACACC |
(SH) |
124-160 |
16 |
60 |
3 |
1:02 |
|
|
14 |
BM 1824 |
1 TET |
GAGCAAGGTGTTTTTCCAATC |
CAT |
180-199 |
12 |
60 |
3 |
1:05 |
|
(D1S34) |
|
CATTCTCCAACTTCTTCCTTG |
(SH) |
162-183 |
12 |
55 |
3 |
1:10 |
|
|
15 |
CSRM 60 |
10 HEX |
AAGATGTGATCCAAGAGAGAGGCA |
CAT |
91-108 |
15 |
60 |
1.5 |
1:05 |
|
(D10S5) |
|
AGGACCAGATCGTGAAAGGCATAG |
(SH) |
77-95 |
10 |
60 |
3 |
1:10 |
|
|
16 |
ILSTS 6 |
7 FAM |
TGTCTGTATTTCTGCTGTGG |
CAT |
285-306 |
17 |
60 |
2 |
1:05 |
|
(D7S8) |
|
ACACGGAAGCGATCTAAACG |
(SH) |
|
|
|
|
|
|
|
17 |
TGLA 122 |
21 HEX |
CCCTCCTCCAGGTAAATCAGC |
CAT |
134-167 |
20 |
60 |
2 |
1:05 |
|
(D21S6) |
|
AATCACATGGCAAATAAGTACATAC |
(SH) |
135-158 |
15 |
60 |
2 |
1:05 |
|
|
18 |
HEL 13 |
11 TET |
TAAGGACTTGAGATAAGGAG |
CAT |
184-196 |
10 |
50 |
1.5 |
1:20 |
|
(D11S15) |
|
CCATCTACCTCCATCTTAAC |
(SH) |
|
|
|
|
|
|
|
19 |
SPS 115 |
15 FAM |
AAAGTGACACAACAGCTTCTCCAG |
CAT |
244-260 |
14 |
65 |
2 |
1:02 |
|
(D15) |
|
AACGAGTGTCCTAGTTTGGCTGTG |
(SH) |
234-268 |
9 |
65 |
2 |
1:02 |
|
|
20 |
TGLA 126 |
20 HEX |
CTAATTTAGAATGAGAGAGGCTTCT |
CAT |
112-128 |
15 |
55 |
2 |
1:10 |
|
(D20S1) |
|
TTGGTCTCTATTCTCTGAATATTCC |
(SH) |
113-134 |
14 |
60 |
2 |
1:02 |
|
|
21 |
TGLA 226 |
2 TET |
AGTGGAATCCAGATAAGATGTATCA |
CAT |
126-158 |
18 |
55 |
1 |
1:10 |
|
(D2S6) |
|
ACATGAAAAGAAGCAATATCGTAAC |
(SH) |
|
|
|
|
|
|
|
22 |
HAUT 24 |
22 TET |
CTCTCTGCCTTTGTCCCTGT |
CAT |
100-134 |
34 |
55 |
3 |
1:02 |
|
(D22S26) |
|
AATACACTTTAGGAGAAAAATA |
(SH) |
|
|
|
|
|
|
|
23 |
BM 1818 |
23 TET |
AGCTGGGAATATAACCAAAGG |
CAT |
209-275 |
24 |
55 |
2 |
1:20 |
|
(D23S21) |
|
AGTGCTTTCAAGGTCCATGC |
(SH) |
261-279 |
11 |
55 |
2 |
1:05 |
|
|
24 |
TGLA 53 |
16 TET |
GCTTTCAGAAATAGTTTGCATTCA |
CAT |
143-186 |
34 |
55 |
1.5 |
1:20 |
|
(D16S3) |
|
ATCTTCACATGATATTACAGCAGA |
(SH) |
147-167 |
20 |
55 |
3 |
1.10 |
|
|
25 |
INRA 37 |
10 FAM |
GATCCTGCTTATATTTAACCAC |
CAT |
100-140 |
29 |
55 |
2 |
1:05 |
|
(D10S 12) |
|
AAAATTCCATGGAGAGAGAAAC |
(SH) |
109-141 |
18 |
55 |
2 |
1:05 |
|
|
26 |
HAUT 27 |
26 FAM |
TTTTATGTTCATTTTTTGACTGG |
CAT |
143-164 |
20 |
55 |
2 |
1:10 |
|
(D26S21) |
|
AACTGCTGAAATCTCCATCTTA |
(SH) |
|
|
|
|
|
Table 2. Microsatellites not amplified by the sheep genome under cattle amplifying conditions.
|
Marker |
CHR |
DYE |
Allele size |
Allele No |
Ta0C |
Mg |
PCR Diln |
|
INRA 5-2 |
12 |
HEX |
121-124 |
31 |
60 |
1.5 |
1:80 |
|
(D12S4) |
|
|
|
|
|
|
|
|
HEL 5 |
21 |
HEX |
NA |
|
|
|
|
|
(D21S15) |
|
|
|
|
|
|
|
|
INRA 023 (D3S10) |
3 |
HEX |
NA |
|
|
|
|
|
INRA 032 |
11 |
HEX |
NA |
|
|
|
|
|
(D11S9) |
|
|
|
|
|
|
|
|
ETH 185 |
17 |
HEX |
NA |
|
|
|
|
|
(D17S1) |
|
|
|
|
|
|
|
|
HAUT 27 |
26 |
FAM |
150-152 |
15 |
55 |
2.0 |
1:40 |
|
(D26S21) |
|
|
|
|
|
|
|
|
ILSTS 6 (D7S8) |
7 |
FAM |
285-306 |
17 |
60 |
2.0 |
1:05 |
|
HEL 13 |
11 |
TET |
184-196 |
10 |
50 |
1.5 |
1:20 |
|
(D11S15) |
|
|
|
|
|
|
|
|
TGLA 226 |
2 |
TET |
126-158 |
18 |
55 |
1.0 |
1:10 |
|
(D2S6) |
|
|
|
|
|
|
|
|
HAUT 24 |
22 |
TET |
100-134 |
34 |
55 |
3.0 |
1:02 |
|
(D22S26) |
|
|
|
|
|
|
|
NA - Not amplified in the cattle breeds.
Figure 3. The Uda sheep.
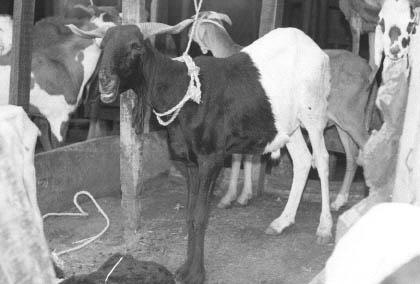
Table 3. Sheep PCR multiplexes.
|
Marker |
|
CHR No/DYE |
PCR DILN |
Ta °C |
Mg |
Allele Size |
All no. |
|
MULTIPLEX 1 |
ILSTS 5 |
10/TET |
1:05 |
55 |
3 |
189-204 |
16 |
|
INRA 35 |
16/TET |
1:05 |
55 |
3 |
106-122 |
10 |
|
|
BM 1818 |
23/FAM |
1:05 |
55 |
2 |
261-297 |
11 |
|
|
ETH 10-2 |
5/FAM |
1:10 |
60 |
2 |
206-214 |
9 |
|
|
ETH 225 |
6/FAM |
1:03 |
65 |
2 |
132-154 |
17 |
|
|
MULTIPLEX 2 |
HEL 1 |
15/TET |
1:05 |
55 |
2 |
107-157 |
24 |
|
CSSM 66 |
14/TET |
1:10 |
60 |
2 |
173-213 |
22 |
|
|
1NRA 37 |
11/FAM |
1:05 |
55 |
2 |
109-141 |
18 |
|
|
MULTIPLEX 3 |
ETH 152 |
5/FAM |
1:02 |
65 |
1.5 |
190-205 |
11 |
|
MM 12 |
9/HEX |
1:10 |
60 |
2 |
83-102 |
11 |
|
|
TGLA 122 |
21/HEX |
1.10 |
60 |
2 |
135-158 |
15 |
|
|
MULTIPLEX 4 |
SPS 115 |
15/TET |
1:02 |
65 |
2 |
234-268 |
9 |
|
BM 2113 |
2/FAM |
1:02 |
60 |
3 |
124-160 |
16 |
|
|
CSRM 60 |
10/HEX |
1:10 |
60 |
3 |
77-95 |
10 |
|
|
MULTIPLEX 5 |
ETH 3 |
19/FAM |
1:10 |
55 |
2 |
96-119 |
17 |
|
BM 1824 |
1/TET |
1:10 |
55 |
3 |
162-183 |
12 |
|
|
TGLA 53 |
16/TET |
1:10 |
55 |
2 |
147-167 |
20 |
|
|
MULTIPLEX 6 |
HEL 9 |
8/FAM |
1:05 |
60 |
2 |
94-104 |
3 |
|
MULTIPLEX 7 |
INRA 63 |
18/HEX |
1:05 |
55 |
2 |
162-182 |
12 |
|
TGLA 126 |
20/HEX |
1:02 |
55 |
2 |
113-134 |
14 |
Ta = Annealing temperature.
All no. = Number of alleles generated.
Mg = Magnesium chloride concentration.
Figure 4. Balami nursing ewes.
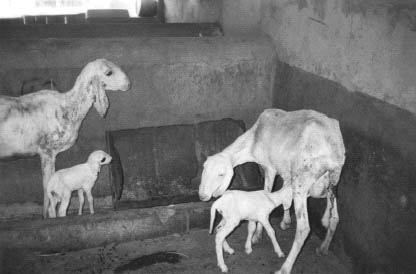
Figure 5. Yankassa ewe (with black around the eyes) and Balami ewe (totally white with droopy ear).
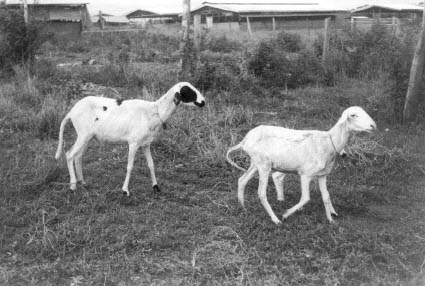
Table 4. Mean number of marker alleles for cattle and sheep breeds.
|
Cattle breeds |
ND |
BU |
NDBU |
GUD |
WAR |
HF |
HBUF1 |
HBUF2 |
HWAR |
|
| |
No |
76 |
63 |
6 |
6 |
16 |
20 |
39 |
20 |
3 |
|
Allele no |
14.77 |
10.73 |
3.77 |
4.06 |
8.23 |
7.73 |
10.92 |
8.42 |
3.69 |
|
|
Heterozygosity |
0.53 |
0.62 |
0.50 |
0.62 |
0.59 |
0.61 |
0.66 |
0.64 |
0.70 |
|
|
Sheep breeds |
|
YANK |
BAL |
UDA |
WAD |
ME |
UD/YANK |
|
|
|
| |
No |
|
38 |
4 |
6 |
6 |
2 |
4 |
|
|
|
Allele No |
|
11.5 |
3.9 |
5.85 |
5.05 |
2.85 |
4.6 |
|
|
|
|
Heterozygosity |
|
0.57 |
0.61 |
0.68 |
0.58 |
0.72 |
0.65 |
|
|
|
PCR conditions
The PCR analysis was carried out using fluorescently labeled PCR primers with 10 mM of each primer on 50ng of each DNA sample. The 10 ml reaction mixture was made up of 1 ml each of PCR buffer (Amersham) dCTP, dGTP, dTTP and dATP20 mM each with Taq Polymerase (1.5-3.0) 0.5 units per reaction and MgCl2 depending on the primer. The mixture was cycled on the Hybaid Omnigene thermal cycler. Cycling conditions were, 3 minutes at 93.5ºC followed by 30cycles at 94ºC, 30 secs at annealing temperatures of 55 65ºC and 30 secs and elongation at 72ºC. The last elongation step was prolonged to 9 minutes.
Half of the PCR product was loaded with 5 ml formamide dye before running on 1.5% agarose at 100 volts for 1 hour alongside a standard marker pBR322 having an allele size of 50-350 bps. The gel was viewed under semi-automated UV light to determine the dilution ratio and marker allele size.
Multiplexing and size characterization were carried out with the other half of the PCR product after dilution (Table 3). 1 ml of the diluted, multiplexed product was loaded with 3 ml of internal size standard (TAMRA), run on 6% polyacrylamide denaturing gel for 3-31/2 hours and sequenced using the Applied Biosystems 373A Gene Sequencer (Perking Elmer), after denaturing at 90oC for 4minutes and rapid cooling in ice. Gel analyses was performed with Genescan 672 (Version 1.2) software. Allele frequencies were determined by direct counting using the Excel format. Frequency distribution per locus per breed was compared using SAS 1989 package. Genetic distance (Ds) was calculated using Nei’s 1972 procedure as follows:
Nei’s 1972 standard genetic distance (Ds)
 where
where
 and
and
 are the average
homozygosities over loci in population X and Y respectively and
are the average
homozygosities over loci in population X and Y respectively and
 xij and
yij are the frequencies of the ith allele at the jth locus in populations X and
Y, respectively, mj is the number of alleles at the jth locus, and r is the
number of loci examined.
xij and
yij are the frequencies of the ith allele at the jth locus in populations X and
Y, respectively, mj is the number of alleles at the jth locus, and r is the
number of loci examined.
The distance, neighbor-joining trees (UPGMA method version 3.572c) and bootstrap values were generated with programs in the Phylip package (Felsenstein 1993). Bootstrap values were compared over100 replicates for trees by resampling loci.
Results and Discussions
All loci sampled were found to be polymorphic in the sheep breeds except Hel9 which is monomorphic in most breeds. The only alleles found in all the breeds was 102/103 which may be one and the same allele in the Yankassa, Balami and the UdaxYankassa cross. Allele 102 alone was found in the Merino and the West African Dwarf breeds whilst the Uda is the only breed in which both alleles 94 and 102 were found. A total of 285 alleles were generated ranging from 3 in Hel 9 to 24 in Hel 1, a large percentage of which showed very high degree of variation. The allelic mean per breed varied from 2.85 in the Merino to 11.55in the Yankassa (Table 4), with average heterozygosities of 0.57 to 0.72.
From the matrices of genetic distance (Table 5), populations were clustered by establishing the NJ (neighbor-joining method) dendograms. The dendograms based on Ds (Figure 1), showed that the breeds were clearly separated from each other. These native breeds stood out as three distinct groups on the evolutionary scale. The Uda and Balami which are basically Northern breeds are clustered together with a 65% occurrence bootstrap value, far from the West African Dwarf, whilst the Yankassa stood between the extremes of the West African Dwarf (a Southern humid zone breed) and the Uda and Balami (Northern arid Zone breeds). The Merino, an exotic breed, clustered with the Uda x Yankassa cross (73% occurrence) probably indicating a closer association between the two breeds despite the fact that the Uda cross is a Nigerian breed whilst the Merino is exotic.
Whilst genetic distances of 0.36 and 0.43were found between the Uda and Yankassa and the Uda and Balami respectively, distances of 0.66 were found between the West African Dwarf and the Balami as well as 0.53 between the West African Dwarf and the Uda, and as high as 0.71 to 0.80 between the Merino and these three breeds, showing that they might have diverged relatively early during evolution (Table 5). The efficiency of construction of phylogenetic trees by means of genetic distance is found to depend on linear relationships with time and the sampling error of the distance measures used (Nei et al., 1983; Goldstein and Pollock, 1994; Tajima and Takezaki 1994). The heterozygosity of 0.57 to 0.72 recorded in this study supports a very high heterozygosity for classical genetic markers (Nei, 1987). In the case of microsatellite loci, the average heterozygosity seems generally to be between 0.5 and 0.8(Bowcock et al., 1994; Forbes et al., 1995; Paetkau et al., 1995). They reported that heterozygosites, theoretically, are a function of an effective population size (N) and a mutation rate (V) per generation and that phylogenetic trees constructed with small number of loci, for example less than 10, are not always reliable. Here we were lucky to have found 20 amplified loci in these breeds. The data therefore generated could be considered reliable enough to portray the relative degree of divergence within this population.
Figure 6. Yankassa ram.
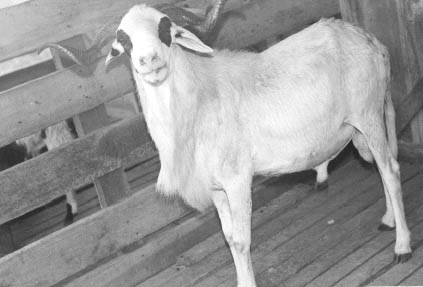
Table 5, Genetic distances between Nigerians sheep breeds and crosses.
|
Yankassa |
0.4761 |
|
|
|
|
|
Balami |
0.3561 |
0.4335 |
|
|
|
|
West African dwarf |
0.4318 |
0.6652 |
0.5343 |
|
|
|
Merino |
0.5597 |
0.8047 |
0.7425 |
0.7136 |
|
|
Uda x Yankassa crosses |
0.3874 |
0.6126 |
0.3491 |
0.661 |
0.5321 |
Moreover, polymorphic MS loci in some species have been reported to be monomorphic in others and even in breeds within the same species. This same situation was discovered with Hel 9 which is polymorphic in cattle but found to be monomorphic in these sheep breeds except in the Uda breed. The reason for the difference is still obscure. Despite the small numbers of animals used per breed and overall loci considered, the use of these MS loci demonstrated the ease with which polymorphism between breeds and between species could be examined. They have similarly proved very useful in studying the relationship of breeds within these Nigerian sheep populations.
The divergence established through the dendogram showed the Uda and Balami, which are basically Northern breeds, to be 0.534 and 0.665 gene distance away respectively from the West African Dwarf which is a Southern rain forest zone breed. Microsatellites are genes that generally reveal a large number of different alleles that are selectively neutral (i.e. genes that do not confer on the individual a selective advantage over others). The extent of divergence in allele frequencies for such selectively neutral loci is therefore considered as a function of the level of isolation of one population from another (Takezaki and Nei, 1996). Hence the microsatellite is preferred as a tool to study divergence. Since genetic diversity results from a particular historic development of the populations under consideration, the biological interpretation of the genetic distance depends largely on the divergence model used and the notion that the alleles are identical by descent. Genetic distance and tree construction methods give insight into the genetic uniqueness of breeds under investigation (Thaon d’Arnoldi et al., 1998). Hence from the NJ-UPGMA method thus utilized, the West African Dwarf with Ds values of 0.66 and 0.53 to Balami and Uda breeds respectively and 0.71 to the Merino cannot be said to be close when compared to the values of 0.43 to the Yankassa or 0.36 between the Yankassa and the Uda. This therefore goes some way towards offering an explanation as to why these breeds have persistently been difficult to raise outside their zone of origin. Despite the small sample sizes the differences found in these analyses are large enough to be apparent. The major contribution of this paper is simply to make this data public so that its findings can be incorporated into larger comparisons in further work on the breeds.
Acknowledgement
This study was supported by the research grant from Nigeria’s National Agricultural Research Project (RGS 025) [World Bank Assisted] during the first author’s sponsorship to Roslin Institute under the Royal Society of England’s Third World Fellowship Scheme, she is therefore grateful to both organizations for their assistance and all stations from which the animals were sampled.
References
Bowcock, A.M., A. Rutz-Linares, J.Tomfahrde, E. Minchand & J.R. Kidd. 1994. High resolution of human evolutionary trees with polymorphic microsatellites. Nature 368: 455-457.
Cornall, R.J., T.J. Aitman, C.M.Hearne & J.A. Todd. 1991. The generation of a library of PCR analyses microsatellite variants for genetic mapping of the mouse genome. Genomics 10: 874-881.
Crawford, A.M., K.G. Dodds, A.J.Ede, C.A. Pierson, G.W. Montgomery, H.G. Garmonsway, A.E. Beattie, K. Davies & J.F. Maddox. 1995. An autosomal genetic Linkage map of the sheep genome. Genetics 140: 703-724.
Estoup, A., P. Piesa, F. Krieg, D.Vaiman, & R. Guypmard. 1993. (CT) and (GT) microsatellites: a new class of genetic markers for Salmo trutta L. (Brown trout). Heredity 71: 488-496.
Forbes, S.H., J.T. Hogg, F.C.Buchanan, A.M. Crawford & F.W.Allendorf. 1995. Microsatellite evolution in congeneric mammals, domestic and bighorn sheep. Mol. Biol. Evol. 12: 1106-1113.
Goldstein, D.B. & D.D. Pollock. 1994. Least Squares estimation of Molecular distance-noise abatement in phylogenetic reconstruction. Theor. Pop. Biol. 45: 219-226.
Lander, E.S. & D. Botstein. 1989. Mapping Mendelian factors underlying quantitative traits using RFLP Linkage maps. Genetics 121: 185-199.
Litt, M. & J.A. Lutty. 1989. A hypervariable microsatellite revealed by in vitro amplification of a dinucleotide repeat within the cardiac muscle actin gene. Ame. J. Hum. Genet 44: 397-401.
Nei, M. 1972. Genetic distance between populations. Ame. Nat. 106: 283-291.
Nei, M. 1987. Molecular evolutionary genetics. Columbia University Press, New York.
Nei, M., F. Tajima & Y. Tateno. 1983. Accuracy of estimated phylogenetic trees from molecular data. J. Mol. Evol. 19: 153-170.
Paetkau, D., W. Calvert, I. Stirling & C. Strobelle 1995. Microsatellite analysis of population structure in Canadian Polar Bears. Mol. Ecol. 4: 347-354.
Ryder, M.L. 1983. Sheep and Man. Duckworth Press, London.
Satou N. & M. Nei.1987. The neighbor-joining method: A new method for reconstructing phylogenetic trees. Mol. Biol. Evol. 4: 406-425.
Tajima, F. & N. Takezaki. 1994. Estimation of evolutionary distance for reconstructing molecular phylogenetic trees. Mol. Biol. Evol. 11: 278-286.
Takezaki, N. & M. Nei. 1996. Genetic distances and reconstruction of phylogenetic trees from microsatellite DNA. Genetics 144: 389-399.
Tautz, D. 1989. Hypervariability of simple sequences as general source for polymorphic DNA markers. Nucleic acid Res. 17: 6463-6471.
Thaon d’Arnoldi, C., J.L. Foulley & L.Ollivier. 1998. An overview of the Weitzman approach to diversity. Genetics, Selection and Evolution 30: 149-161.
|
[9] Department of Animal
Breeding & Genetics, University of Agriculture, P.M.B. 2240,
Abeokuta, Nigeria [10] Department of Animal Breeding & Genetics, University of Agriculture, P.M.B. 2240, Abeokuta, Nigeria [11] Roslin Institute, EH25 9PS Midlothian, Scotland, UK [12] Department of Animal Breeding & Genetics, University of Agriculture, P.M.B. 2240, Abeokuta, Nigeria |
![]()
![]()
![]()