![]()
![]()
![]()
From the introduction it is clear that understanding existing animal production systems is a keystone of any decision-support system. Therefore, the initial step undertaken was to produce a spatial inventory of livestock production systems prevailing in West Africa within their respective ecogeographical settings. Underlined system dynamics are discussed by comparing spatial patterns with recognized livestock production systems.[2]
In any given ecogeographical setting the occurrence and development of livestock production systems can be described by three main factors: human population density, crop agriculture intensity and livestock density (FAO, 1997). While population maps at a useful resolution and at continental scale already existed (e.g. Center for International Earth Science Information Network [CIESIN]),[3] only recently has a continental 5-km grid data set, including satellitederived cropping[4] intensity and cattle distribution layers, been developed and made widely available (PAAT-IS).[5] The availability of such data layers allows the study of distribution patterns of single and combined variables at a subnational scale. The patterns observed and trends derived may prove invaluable for the understanding of occurring and current drifts of livestock production systems and for the planning of adequate pest management.
|
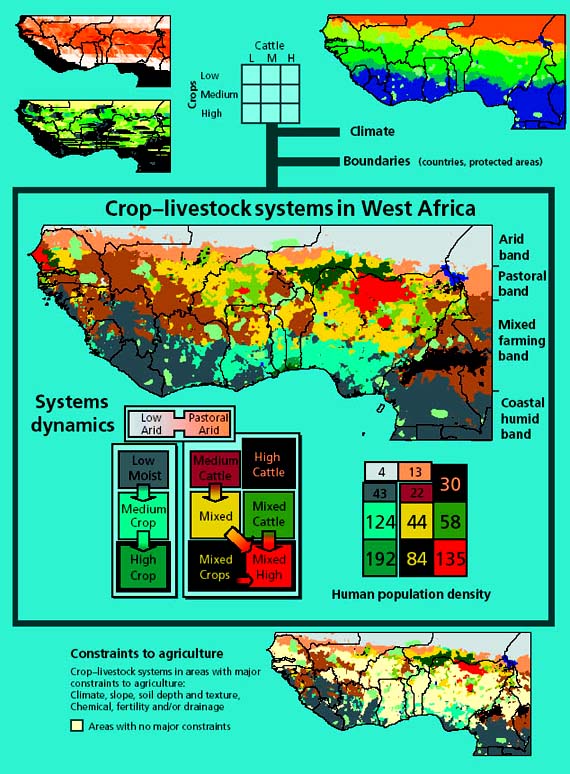
FIGURE 1 Observed crop-livestock systems patterns (central map) clearly show centripetal mixed farming aggregations around development poles. From east to west - Kano and Jos Plateau in Nigeria, Ougadougou in Burkina Faso and Dakar in Senegal. This is confirmed when comparing average population density numbers for each mixed farming type. See Box 1 for background information.
|
A study jointly initiated by FAO and IAEA aimed, inter alia, at analysing these patterns for West Africa (Hendrickx, 2001). Results obtained are summarized in Figure 1 and some methodological aspects are discussed in Box 1. The analysis revealed a set of distinct patterns (Figure 1, central map):
Low cereal and low cattle density systems are found in two distinct bands: the dry northern (light grey), and the humid southern and coastal area (dark grey). While in the north climate is a major constraint for crop agriculture, in the humid south perennial crops and forest areas dominate (e.g. Liberia, Côte d’Ivoire), and a higher incidence of diseases impairs economic livestock keeping.
In addition to forest areas (dark grey) the southern coastal band is further characterized by crop(cereal)-dominated systems ranging from medium to high intensity (light and dark blue). In these areas relatively few cattle are found. These systems cover most of the southern parts of Ghana, Togo, Benin and Nigeria.
Mixed systems (yellow, where both crops and cattle coexist) are mainly focused around high-intensity farming areas (red) in the medium to high cropping intensity band: the Jos Plateau and close-settled zone of Nigeria, southern Niger, central Burkina Faso (Ouagadougou area) and the Dakar area in western Senegal. Around these zones distinct patches of either crops or cattle-dominated mixed systems are also present. The former in southern Niger (dark green, high-surface/low-yield mixed crop systems) and the latter more scattered in Nigeria and Burkina Faso (light green).
Cattle-dominated systems with low cropping levels (brown) are found at the fringes of the mixed systems in the medium band. In the dryer areas they correspond to traditional pastoral zones (light brown northern band) while towards the south, in the more humid zones, stocking rates have greatly increased after the dry periods of the 1970s and 1980s. Most of those areas have now also been freed from onchocerciasis, further increasing the incoming flux of farmers. Typical “front pioneer” areas are (a) southern Mali, southern Burkina Faso and northern Côte d’Ivoire, (b) northwestern Ghana and (c) northeastern Benin. It is interesting to note that in the Niger the pastoral band (light brown) is disrupted by high-surface/low-yield mixed crop systems.
A distinct high-density livestock system is situated in the Alameda and Camilla Plateaus of Cameroon and Nigeria. Large parts of these areas, though under siege, are tsetse free.
|
BOX 1 Spatial definition of livestock production systems: some methodological aspects 1. Five-km raster data layers for agriculture intensity (mainly cereals, no data on tree crops and tubers included) and livestock density were reclassed in three classes (high, medium, low) based on expert knowledge. 2. Both data layers were overlayed (cross-tabulation principle) using commercial GIS software (Idrisi 32) and unique values were given to newly created classes, thus defining livestock production system categories, e.g. category medium cattle AND medium crops = mixed. 3. Based on the length of vegetation growing period, the northern pastoral band was defined. 4. Livestock production system categories were further grouped according to the emerging patterns and agro-ecological setting:
5. Average human population densities were calculated per livestock production system category to contribute to the system dynamics analysis. 6. The occurrence of a known set of physical constraints (International Institute for Applied Systems Analysis [IIASA]) was estimated per livestock production system category. |
As described above, the different livestock production system categories are not randomly scattered but a distinct north-south band-like pattern emerges. The given average population density figures per production system further highlight an overall humaninduced dynamic pattern of higher intensity linked to higher density (Figure 1, arrows). These findings can now be compared with livestock production systems as described in the LEAD (Livestock, Environment and Development initiative of FAO) toolbox (Box 2). It is important to note that these systems rarely occur in a separate fashion, but overlap in expanse.
Northern zero agriculture band (15 percent of the total land area): a low-intensity grazing system in arid areas where climate is the limiting factor for agriculture. An extensive cattle production system predominates; the agro-ecological setting governs seasonal livestock movements (transhumance) towards pastures (north and/or south). Population densities are low and no increase is expected. No tsetse are found in these arid conditions. Livestock is trypanosusceptible (Zebu cattle) and may be in contact with tsetse during southern transhumance. Pastoralists protect cattle using trypanopreventive drugs.
Northern pastoral band (8 percent): a traditional pastoral system dominates with possibility for some cropping. In southern Niger a large proportion of farmland is brought into the cultivation cycle, disrupting traditional pastoral movement patterns and possibly posing a major environmental hazard. In addition, crop agriculturists acquired cattle for draught power during the droughts of the 1970s and 1980s and they compete with pastoral systems. Except for the southern fringes, no tsetse are present. Pastoralists protect cattle using trypanopreventive drugs.
Mixed farming band (49 percent): complex, highly dynamic mixed systems with further population increase, around wellestablished centripetal development poles, result in higher agricultural intensity. The proportion of mobile grazing livestock farmers decreases southwards and towards higher-intensity poles where a higher proportion of livestock is managed by crop agriculturists. Mobile and sedentary livestock owners contribute, de facto, to improved mixed farming practices (agreements with crop and mixed farming agriculturists). Cattle are mainly herded on communal lands. Crop residue (cotton grains, groundnuts) supplementation is practised at different levels of intensity. Tsetse are present throughout the area. Traditional ways to control disease include the widespread use of trypanotolerant cattle and pasture management with limited opportunities for the development of sound mixed farming practices. The development of agriculture around populated places gradually encroached tsetse habitat allowing for increased numbers of cross-bred cattle to survive. This led eventually to the introduction of new breeds, such as the Borgou in Benin, and the development of mixed farming. The droughts of the 1970s and 1980s forced a significant number of trypanosusceptible cattle to enter this area. Cattle survival is only possible with intensive use of curative trypanocidal drugs. Cross-breeding of trypanotolerant and trypanosusceptible cattle is increasingly practised.
Coastal crop band (28 percent): crop-dominated systems in the humid south where population pressures are already high except in the forest zones. Here, small-scale and multispecies mixed systems prevail locally (chickens, pigs, small ruminants, trypanotolerant breeds, draught animals). Disease pressure is high and cattle densities are low. No major increases in cattle number are expected as a consequence of tsetse clearance. The capital cities of the coastal countries are located in this band creating opportunities for the development of semi-intensive and intensive (zero grazing) peri-urban livestock systems.
|
BOX 2 FAO-LEAD livestock production systems classification A set of livestock production systems is described per agro-ecozone in Figure 1 on page 6. Dominant West African systems are summarized below. 1. Grazing systems: highly dependent on the natural productivity of grasslands.
2. Mixed systems: conducted by households where crops and livestock are more or less integrated components of one single farming system.
|
One step further in understanding the evolving livestock production systems and the integration of cattle and crop agriculture, should the tsete and trypanosomiasis constraint be removed, could be achieved by analysing the potential environmental risks of a further intensification. Based on a joint IIASA(International Institute for Applied Systems Analysis)-FAO data set (FAO/IIASA, 2000), major climatic and physical obstacles to agricultural activity were mapped (IAEA, 2002). When combined with agriculture intensity, such data layers help highlight areas where soil degradation is a major risk at the regional level.
Results obtained are summarized in Table 1 and areas where physical factors are major impairments to crop agriculture development are depicted in Figure 1, bottom map. In general more than one-third (38 percent) of the total land area in West Africa copes with some form of major physical constraint to agriculture. Poor soil fertility is the most common problem (more than 25 percent) further stressing the urgent need for improved mixed farming practices in the entire area.
In conclusion, the farming systems’ analysis briefly outlined above revealed an important set of patterns. Livestock production systems appear not to be scattered but distributed in a band-like pattern throughout West Africa. The general agro-ecological setting, including climate and vegetation, appears to be the driving force behind this. The described analysis, i.e. spatial distribution patterns and levels of human density and livestock-agriculture intensity, contributes to a better understanding of the dynamics of production systems. Historically, livestock and crop agriculturists have developed different strategies to address the tsetse problem, for example, herd management and use of trypanotolerant domestic breeds together with trypanotolerant and trypanosusceptible crosses. Crop encroachment on tsetse habitat in areas of higher crop intensity and the widespread use of trypanocidal drugs allowed for influx of trypanosusceptible breeds in the semi-arid and subhumid agroecozones. Trypanotolerant livestock breeds are still the dominant breeds in the more humid agro-ecozone. These different agroecological settings should be duly considered in designing T&T control strategies.
TABLE 1
Percentage areas with major constraints per
crop-livestock system
|
System |
Slope |
Soil texture |
Soil depth |
Chemical |
Fertility |
Drainage |
Any physical constraint |
|
|
1.5%* |
8.5%* |
7.1*% |
4.5*% |
26.4*% |
6%* |
37.9%* |
|
Southern crop band |
|
|
|
|
|
|
|
|
Moist perennial |
1.8 |
1.3 |
3.6 |
2.4 |
75.3 |
4.3 |
78.7 |
|
Crops medium |
1.6 |
4.7 |
6.1 |
4.5 |
49.4 |
8.1 |
56.1 |
|
Crops high |
3.0 |
11.3 |
4.7 |
7.4 |
29.5 |
19.0 |
53.2 |
|
Pastoral arid plains |
|
|
|
|
|
|
|
|
Arid/semi-arid |
0.2 |
31.3 |
15.6 |
13.6 |
15.8 |
15.7 |
40.1 |
|
Pastoral arid |
0.4 |
18.9 |
9.5 |
12.1 |
12.3 |
11.8 |
34.3 |
|
Cattle systems |
|
|
|
|
|
|
|
|
Cattle medium |
2.7 |
8.5 |
14.6 |
2.0 |
37.8 |
4.3 |
54.3 |
|
Cattle high |
7.0 |
6.8 |
8.2 |
5.6 |
47.8 |
8.6 |
63.6 |
|
Mixed systems |
|
|
|
|
|
|
|
|
Mixed |
1.6 |
9.8 |
7.2 |
4.5 |
18.6 |
5.8 |
35.7 |
|
Mixed cattle |
3.2 |
10.0 |
9.3 |
5.3 |
19.3 |
10.5 |
42.6 |
|
Mixed crops |
1.3 |
11.2 |
2.3 |
6.1 |
8.0 |
5.4 |
28.1 |
|
High intensity |
2.7 |
6.0 |
4.7 |
5.6 |
20.2 |
5.5 |
34.4 |
* percentages mentioned in top row indicate total land area percent affected by respective constraint in West Africa
| [2] Livestock and Environment
Toolbox, FAO-LEAD, http://lead.virtualcentre.org/
en/dec/toolbox [3] Found at http://www.ciesin.org [4] Training data used to produce satellite-derived cropping-intensity prediction are mainly based on cereal crops and often do not include tree crops and tubercles. Therefore this layer is referred to as cereal cropping [5] Found at http://www.fao.org/ag/againfo/programmes/en/PAAT/home.html |
![]()
![]()
![]()