![]()
![]()
![]()
Some of today’s large fertilizer companies were already operating at the end of the 1940s and the beginning of the 1950s. Until the beginning of the 1960s, the domestic demand for fertilizer raw materials was met essentially by imports. Local production was limited to phosphate rock from a mine discovered in the 1940s in the State of São Paulo, to an ammonia, nitric acid, ammonium nitrate and calcium ammonium nitrate plant and to some producers of single superphosphate.
In the second half of the 1960s, new single superphosphate plants and the first complex fertilizer plant were constructed, marking the beginning of phosphoric acid production in the country. This enterprise also installed the first large-scale unit for the production of anhydrous ammonia, nitric and sulphuric acids, ammonium nitrate and DAP (diammonium phosphate). Other new projects became operational during the following decade.
Starting in 1971, the demand for fertilizers increased considerably, mainly as a consequence of agricultural development in the Cerrado in Central Brazil. This was constrained, however, by the need for additional imports at rising cost. This increasing demand, associated with high prices on the international market as a consequence of the conflict in the Near East and other factors, resulted, in 1974, in the development of the National Program for Fertilizers and Agricultural Limestone (PNFCA), whose main objective was the expansion and modernization of the fertilizer and agricultural limestone industry in Brazil. This program stimulated investment in several fertilizer and raw material complexes.
In the early 1990s, the fertilizer sector in Brazil underwent an intense privatization process, in which a substantial proportion of raw material production, until then undertaken the by state-owned companies, was transferred to the private sector.
The company responsible for the only production of potassium chloride in Brazil was transferred to the private sector. Some subsidiaries of a state-owned company producing a substantial portion of the nation’s phosphate and nitrogen fertilizers also were later privatized. Summaries of the capacities of the main producers of raw materials and fertilizers respectively are presented in Tables 8 and 9. Their geographical location is illustrated in Figure 6.
At least 250 mixed NPK compound fertilizers plants are located in the different agricultural areas of the country.
TABLE 8
Raw materials and intermediates capacities
(‘000 tonnes product per annum)
|
Product |
Location |
Capacity |
|
Ammonia |
Araucaria (PR) |
438 |
|
Camaçarí (BA) |
488 |
|
|
Cubatão (SP) |
191 |
|
|
Laranjeiras (SE) |
406 |
|
|
Total |
1 523 |
|
|
Phosphate rock |
Araxá (MG) |
799 |
|
Cajati (SP) |
536 |
|
|
Catalão (GO) |
2 253 |
|
|
Irecê (BA) |
150 |
|
|
Lagamar (MG) |
560 |
|
|
Patos de Minas (MG) |
150 |
|
|
Tapira (MG) |
1 688 |
|
|
Total |
6 136 |
|
|
Sulphuric acid |
Araxá (MG) |
343 |
|
Cajati (SP) |
580 |
|
|
Catalão (GO) |
432 |
|
|
Cubatão (SP) |
1 315 |
|
|
L. Eduardo Magalhães (BA) |
36 |
|
|
Paulínia (SP) |
330 |
|
|
Santa Luzia do Norte (AL) |
15 |
|
|
Uberaba (MG) |
1 762 |
|
|
Total |
4 813 |
|
|
Phosphoric acid (P2O5) |
Cajati (SP) |
164 |
|
Catalão (GO) |
118 |
|
|
Cubatão (SP) |
269 |
|
|
Uberaba (MG) |
496 |
|
|
Total |
1 047 |
Source: ANDA, 2003.
TABLE 9
Fertilizer plant capacities (‘000 tonnes
product per annum)
|
Product |
Location |
Capacities |
|
Ammonium sulphate |
Camaçari (BA) |
159 |
|
Cubatão (SP) |
34 |
|
|
Total |
193 |
|
|
Urea |
Araucaria (PR) |
630 |
|
Camaçari (BA) |
495 |
|
|
Laranjeiras (SE) |
594 |
|
|
Total |
1 719 |
|
|
Ammonium nitrate |
Cubatão (SP) |
406 |
|
Single superphosphate |
Araxá (MG) |
679 |
|
Camaçari (BA) |
230 |
|
|
Candeias (BA) |
150 |
|
|
Catalão (GO) |
908 |
|
|
Cubatão (SP) |
1 077 |
|
|
Guará (SP) |
342 |
|
|
L. Eduardo Magalhães (BA) |
108 |
|
|
Paranaguá (PR) |
400 |
|
|
Patos de Minas (MG) |
100 |
|
|
Paulínia (SP) |
675 |
|
|
Rio Grande (RS) |
983 |
|
|
Santa Luzia do Norte (AL) |
90 |
|
|
Uberaba (MG) |
463 |
|
|
Total |
6 205 |
|
|
Triple superphosphate |
Catalão (GO) |
37 |
|
Cubatão (SP) |
28 |
|
|
Rio Grande (RS) |
187 |
|
|
Uberaba (MG) |
435 |
|
|
Total |
687 |
|
|
Monoammonium phosphate |
Catalão (GO) |
113 |
|
Cubatão (SP) |
253 |
|
|
Uberaba (MG) |
610 |
|
|
Total |
976 |
|
|
Diammonium phosphate |
Cubatão (SP) |
8 |
|
Thermal phosphate |
Poços de Caldas (MG) |
150 |
|
Potassium chloride |
Taquari Vassouras (SE) |
541 |
Source: ANDA, 2003.
|
FIGURE 6
|
|
1 - Santa Luzia do Norte; 2 - Laranjeiras; 3 - Taquari Vassouras; 4 - Camaçari; 5 - Candeias; 6 - Luiz Eduardo Magalhães; 7 - Irecê; 8 - Catalão; 9 - Uberaba; 10 - Tapira; 11 - Patos de Minas; 12 - Lagamar; 13 - Araxá; 14 - Poços de Caldas; 15 - Cubatão; 16 - Cajati; 17 - Paulìnia; 18 - Guará; 19 - Araucária; 20 - Paranagua; 21 - Rio Grande. |
Source: Adapted from ANDA, 2003.
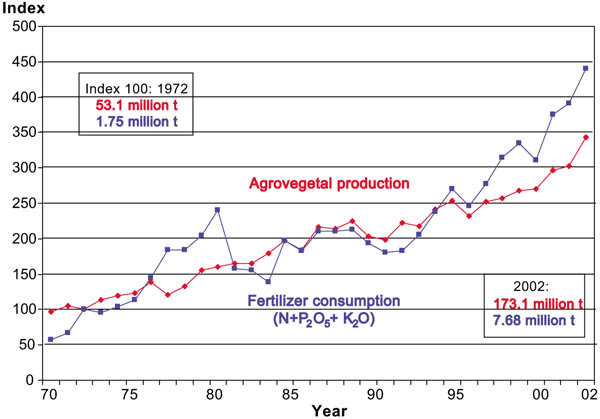
There is a close relationship between the consumption of fertilizers and crop production. Fertilizer consumption and the production of the 16 main crops (dry weight basis) between 1970 and 2002 are shown in Figure 7.
These data demonstrate that the development of the national production of these 16 crops in the last three decades was the result much more of an increase in the use of modern production technologies, especially on the efficient use of mineral fertilizers, than of the simple expansion of the area planted. On the one hand, during this period, the production of these 16 crops increased 3.4 times and the consumption of fertilizers increased by 4.4 times. On the other hand, the cropped area increased only 1.5 times, going from 36.4 million ha to 56.2 million ha.
|
FIGURE 7
|
Source: Lopes, Guilherme and Silva, 2003.
A better estimate of the above relationships can be obtained when the development is calculated on the basis of three-year averages, as shown in Table 10. For many years and until the beginning of the 1980s, the average consumption of fertilizers (N+P2O+K2O) in Brazil was around 50 kg/ha. It 5 was only during the 1990s that a substantial increase occurred, reaching 132 kg/ha in the three-year period from 1999/00 to 2001/02. Unofficial data for the year of 2002/2003 indicate a record production of cereals of around 120 million tonnes, with an average consumption of fertilizers (N+P2O+K2O) of 138 kg 5 per ha for the 16 major crops.
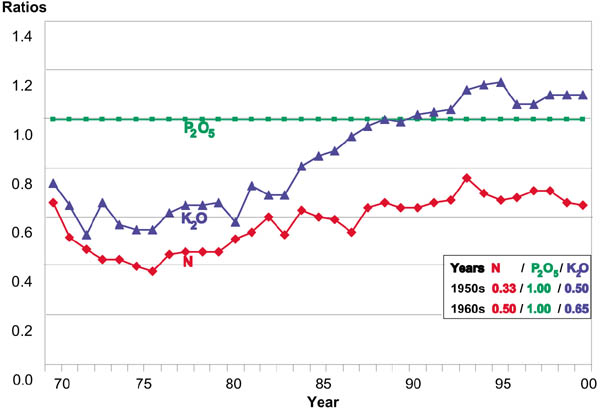
Another relevant aspect is the development of the N:P2O5:K2O consumption ratio in Brazilian agriculture, as shown in Figure 8. During the 1950s the ratio was 0.33:1.00:0.50. It changed to 0.50:1.00:0.55 in the 1960s, to 0.67:1.00 0.80 in 1970 then to 0.37:1.00:0.52 in 1976. Nitrogen and potash then tended to increase again in relation to phosphorus, with a ratio of 0.79:1.00:1.14 in 2002. The consumption of phosphate is relatively high partly as a consequence of the increasing cultivation of soils of the Cerrado area in the Centre West region of the country, which are extremely deficient in phosphorus.
TABLE 10
Agriculture, fertilizer use and population
(three year averages)
|
Item |
Unit |
1981/82 to |
1990/91 to |
1999/00 to |
|
Agricultural production(1) |
1 000 t |
90 226 |
112 696 |
154 993 |
|
Grain production(2) |
1 000 t |
50 299 |
64 077 |
92 823 |
|
Harvested area(3) |
1 000 ha |
44 087 |
45 984 |
47 655 |
|
Fertilizer consumption(4) |
1 000 t |
2 541 |
3 312 |
6 282 |
|
Yield |
kg/ha |
2 047 |
2 451 |
3 252 |
|
NPK consumption(5) |
kg/ha |
58 |
72 |
132 |
|
Population |
1 000 |
129 766 |
152 222 |
172 387 |
|
“Per capita” production(6) |
kg/person |
695 |
740 |
899 |
(1) Production of the 16 main crops, adjusted to a dry weight basis: sugar cane, cassava and potato (15 percent), citrus and tomato (10 percent).
(2) Cereals and oil crops.
(3) Sixteen main crops.
(4) N + PO + K2O consumption in the year of planting.
(5) Harvested area.
(6) Agricultural production per capita in the harvest year.
Source: ANDA, 2003.
|
FIGURE 8
|
Source: Lopes, Guilherme and Silva, 2003.
|
FIGURE 9
|
Source: Lopes, Guilherme and Silva, 2003.
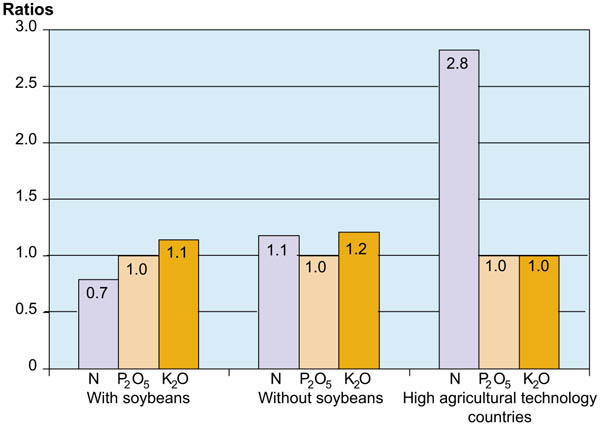
Excluding soybeans from the calculations, a crop that consumes almost no nitrogen fertilizers, the ratio is 1.18:1.00:1.21. If this ratio is compared with those of countries with a technically advanced agriculture, which average 2.82: 1.00:1.00, it can be concluded that the low rates of nitrogen are one of the main factors limiting yield increases in a number of crops (Figure 9).
The relatively low consumption of nitrogen in relation to phosphorus and potassium was confirmed by a study of Yamada and Lopes (1999), involving calculations of nutrients removed by the 16 main crops in Brazil (see Chapter 7).
A summary of the production, consumption, import and export of fertilizers in terms of N, P2O5 and K2O in Brazil from 1998 to 2002 is shown in Table 11. In 2002, national production supplied 41.5 percent of the N, 52.7 percent of the P2O5, but only 12.3 percent of the K2O consumed in the country.
Almost 50 percent of the nitrogen is accounted for by urea, 80 percent together with ammonium nitrate and ammonium sulphate. The ammonium phosphates (MAP/DAP) account for 45 percent of total phosphate consumption, mostly MAP. The proportion of P2O5 consumption accounted for by SSP (29 percent) is almost twice that of TSP (16 percent). The direct application of high reactive phosphate rock accounts for only about 4 percent of total P2O5 applied in Brazilian agriculture. There has been a trend for the past 10 years for SSP to increase more than TSP, partly due to its sulphur content, a nutrient particularly required by soybeans. Potassium chloride is almost the only source of potassium used in Brazil, accounting for 98 percent of the market. Almost all the fertilizers are sold in solid form, in 50 kg bags and also in big bags of 500 to 1 000 kg.
TABLE 11
Fertilizer production, consumption and trade
(‘000 tonnes nutrient)
|
Nutrient |
Item |
1998 |
1999 |
2000 |
2001 |
2002 |
|
Nitrogen |
Production |
728 |
849 |
772 |
658 |
753 |
|
N |
Consumption |
1 455 |
1 393 |
1 668 |
1 640 |
1 816 |
|
Import |
852 |
845 |
1 263 |
1 081 |
1 176 |
|
|
Export |
66 |
32 |
39 |
21 |
65 |
|
|
Phosphorus |
Production |
1 369 |
1 359 |
1 496 |
1 445 |
1 480 |
|
P2O5 |
Consumption |
2 129 |
1 967 |
2 338 |
2 482 |
2 807 |
|
Import |
773 |
675 |
1 120 |
1 151 |
1 298 |
|
|
Export |
37 |
42 |
37 |
89 |
93 |
|
|
Potassium |
Production |
326 |
348 |
353 |
357 |
376 |
|
K2O |
Consumption |
2 261 |
2 079 |
2 562 |
2 716 |
3 059 |
|
Import |
1 993 |
1 942 |
2 566 |
2 527 |
2 692 |
|
|
Export |
23 |
17 |
22 |
51 |
53 |
Source: ANDA, 2003.
A summary of the fertilizers sold in Brazil in 2002, in terms of type and nutrient content is presented in Table 12.
It is estimated that about 85 percent of the fertilizers consumed in Brazil are used in the form of mixed fertilizers.
As mentioned above, the consumption of mineral fertilizers has increased substantially during in the past two decades. However, there are still substantial differences in the consumption of fertilizers a) in the different agro-ecological zones and b) within given agro-ecological zones.
TABLE 12
Fertilizer consumption by product
(2002)
|
Product |
‘000 tonnes |
Percent |
|
Nitrogen (N) |
|
|
|
Ammonium sulphate |
308 |
16 |
|
Urea |
895 |
48 |
|
Calcium Ammonium nitrate |
2 |
- |
|
Ammonium nitrate |
305 |
16 |
|
MAP/DAP |
256 |
14 |
|
NK |
23 |
1 |
|
NPK |
92 |
5 |
|
Total N |
1 881 |
100 |
|
Phosphorus (P2O5) |
|
|
|
MAP/DAP |
1 313 |
45 |
|
SSP |
831 |
29 |
|
TSP |
478 |
16 |
|
Thermophosphate |
22 |
1 |
|
Reactive phosphate rock |
116 |
4 |
|
NPK |
140 |
5 |
|
Total P2O5 |
2 900 |
100 |
|
Potassium (K2O) |
|
|
|
Potassium chloride |
3 056 |
98 |
|
Potassium sulphate |
22 |
1 |
|
NK |
30 |
1 |
|
NPK |
4 |
- |
|
Total K2O |
3 112 |
100 |
Source: ANDA, 2003.
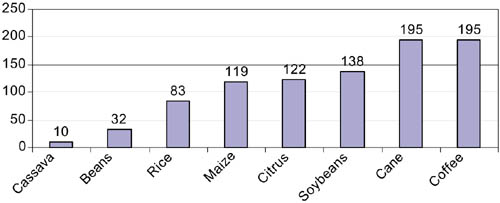
a. Consumption variations in the different agro-ecological zones.
The continental dimensions of Brazil lead to a great diversity of soils, climates and types of land use, which is reflected in the variations in the use rates of mineral fertilizers applied to the different crops. For example, the average rate of consumption of fertilizers in states or regions where native pastures or even improved pastures prevail is much lower than that observed in states or regions where land use is dominated by the export crops (soybean, coffee, sugar cane, and citrus).
|
FIGURE 10
|
Source: Lopes et al., 2003.
b. Consumption differences between some export crops and some basic food crops are illustrated in Figure 10.
Even in states or regions with a high level of agricultural technology, there are large differences between the application rates of mineral fertilizers on export crops, which are much more profitable for farmers, and those of the basic food crops (cassava, beans, rice, and maize).
In the case of the export crops, the use of sustainable technologies that lead to high yields, especially the efficient use of mineral fertilizers, is normal farm practice. These farmers are always looking for technical means of increasing the productivity and profitability of their farms and are willing to invest in sustainable production technologies. In the case of the basic food crops, the use of sustainable production technologies that can lead to maximum economic yields is the exception rather than the rule. On these crops, the levels of consumption of mineral fertilizers are much less than those that are technically and economically recommended. In the case of subsistence farming the levels of mineral fertilizer use are critically low.
In the case of basic food crop production and especially of subsistence farming, the low use of production-enhancing technologies is due not to the lack of such technologies but rather to a series of constraints that prevent these technologies being used by the small subsistence farmers. This includes an absence of public policies that would improve the profitability of basic food crop production.
|
[3] Adapted from ANDA,
1987. |
![]()
![]()
![]()