![]()
![]()
![]()
In this chapter, we look into how we can measure subsidies, i.e. how we can assign monetary values to fisheries subsidies. The reason for wanting to do so is to allow us to make more quantitative analyses. We may want to be able to say how much of the profits generated by the fisheries industry that can be linked to subsidies or how much money from the public budget that is spent on the fisheries sector or we may want to expand our analysis to other issues that require quantitative data. Chapters 7 and 8 below give more details on different comparative analyses. In this chapter, we will look at different methodologies and practices for valuing individual subsidies of different types.
The Guide's definition of subsidies uses the notion of "potential profits" or "profitability" of the fisheries industry, i.e. government actions or inactions that affect the profits of the fisheries industry are subsidies. In section 4.1, on page 6, where the Guide's fisheries subsidy definition is explained, it is stated that the Guide focuses on the short-term impact of subsidies on profits rather than on the medium or long-term effect on profitability. By short-term, we mean effects that are realized "immediately" and that generally can be traced in the profits of a firm the same year or at the latest the subsequent year as a particular intervention takes place (or does not take place). Medium-term would imply approximately a five-year period while long-term is anything beyond this.
The Guide assumes that all subsidies have both short and long-term effects. These effects can be direct or indirect and they may concern the firm or a subsector, the fisheries industry as a whole or society in general - or any combination of these - in a variety of ways.
The short-term effects on the firm's costs and/or earnings (and hence profits) may be quite easy to identify for categories 1 and 2 subsidies while they are more implicit and more difficult to quantify for categories 3 and 4 subsidies. Long-term effects are often more indirect and may affect the same firm or another part of the industry, or society in a broader sense. The long-term effects include second-stage effects and the impact of changes in behaviour triggered by the initial short-term effect. For example, a fuel tax rebate reduces costs but makes at the same time financial resources available to the firm that it can use for other purposes and is hence likely to - if these additional resources are used wisely - benefit both its short-term profits and its longer-term profitability. Sometimes the short and long-term effects may be in "opposite directions" for the firm, i.e. a subsidy that increases a firm's profits in the short-term may decrease its - and the industry's - profits in the longer term, e.g. an investment grant scheme that gives the recipients financial benefits today may lead to over-investment in the fishery, leading to overfishing and hence to decreasing returns and profits in the long-term. Other subsidies may be profit-decreasing for the firm in the short-term but have positive effects in the longer-term, for the firm or the industry itself or for society more generally, e.g. gear regulations and environmental protection programmes.
From this reasoning, it would appear that an analysis of the long-term effects could easily bring us to a study of the effects of subsidies on resources and on the sustainability of fisheries. This is a complex issue that is outside the scope of this Guide; with the knowledge currently available, longer-term aspects are difficult to assess. Hence, when we discuss the assessment of subsidies below, the focus of the quantitative analysis will be on the short-term. The Guide suggests an assessment that constitutes a "snap-shot" of the current situation, giving subsidy values on an annual basis. At the same time as this may be felt to be insufficient, it is believed that it is an inevitable and important step towards a better understanding of the impact of fisheries subsidies, also in the longer-term. These long-term aspects can of course - depending on the objective and scope of our particular fisheries subsidies work - be subject to further analysis at a later stage. Naturally, any qualitative information with regard to long-term effects that becomes available to us should be noted and included in our subsidies report as appropriate (see also chapter 9).
In the discussion above, we refer to "firms", "a subsector", "the industry" and "society" as different entities on which subsidies have an impact. The four concepts constitute different levels at which we can carry out our analyses. The firm is the most detailed level. If we add together the information on several firms, we have an analysis of a group of firms or maybe of a subsector. If we include, for example, all aquaculturists in our study, we can make an analysis of the aquaculture subsector. If we want an analysis of the whole fisheries sector, we need to combine the information of all firms to arrive at the industry aggregate. If we use the concept of society, we have moved beyond the fisheries sector and are looking at things in a much broader perspective, including aspects of welfare economics. The impact on society is closely related to the long-term impact of subsidies discussed above. As we know, the Guide defines subsidies based on a criterion related to the potential profits of the industry, Accordingly, in the following, we are mainly concerned with the impact of subsidies on a firm's profits. This information can be aggregated up to the level of the industry as a whole. The term used by the Guide for this part of the analysis is the assessment of the value to the industry. In addition, we will also look into the budgetary implications for subsidy providers, i.e. the cost - or revenue - to the government of a subsidy. These two concepts are discussed in the section below.
Already in chapter 5 above, when discussing the four different categories of fisheries subsidies, the notions of "cost - or revenue - to the government" and "value to the industry" were mentioned. With regard to the industry value, the direct short-term impact on profits that we try to capture can be defined as either cost-reducing (or cost-increasing) or revenue-enhancing (or revenue-reducing) and measured - although at times with some difficulty - as such. However, for the government - the provider of the subsidy - the value may be something quite different, corresponding to the public expenditure including direct and indirect administrative costs for operating and managing the subsidy. There is also the aspect of opportunity cost to consider. Accordingly, the government cost - or revenue - and the value to the industry of a certain subsidy may be different and to understand the economic value of a subsidy, we should look at both aspects.
To measure the impact on profits that a subsidy has is not an easy task and we need to make some assumptions. The main guiding principle for the assessment of the industry value is based on the assumption that all revenue-enhancing/cost-reducing subsidies are beneficial to the industry and that if governments did not provide them, the industry would either have to or want to pay for them itself. Hence, subsidies generally have a positive value to the industry. This is of course a simplification of a much more complicated analysis. It could, for example, also be argued that if the support provided through subsidies was necessary for the industry, the industry would pay for it itself already and the subsidies would not be needed in the first place. Moreover, somewhat different arguments would need to be used for certain subsides such as border measures, fisheries management, free resource access and of course for subsidies that are clearly decreasing profits. Nevertheless, the Guide suggests that the value of a subsidy accruing to the industry is most accurately estimated as the cost that the industry would have to pay on commercial terms for obtaining the same service or good and that this principle should be utilized whenever possible[5].
With regard to the value of fisheries subsidies expressed as the cost (revenue) to the government, the assessment has to be based mainly on information from the public budget, except for in the case of foregone revenues (e.g. tax rebates) which are generally not included in the budget and will have to be assessed separately. Moreover, it is important that the cost of a subsidy is evaluated not only as the financial transfer it may entail - in the case of a grant for example - but that also the administrative cost to run the programme or implement the regulation is included. This implementation cost includes personnel cost and other operational costs incurred by, for instance, fisheries administrations or other government agencies dealing with subsidies reaching the fisheries sector. Furthermore, for a correct evaluation of the true cost to the government, the opportunity cost - or shadow price - should be estimated. This may, however, be very difficult to do in practice (see Box 4).
For some types of subsidies, in particular those belonging to Category 1 and consisting of direct financial transfers, assessing the value according to the principles mentioned above may be a relatively easy task. It is probably fair to assume that the approximate value to the industry of an investment grant corresponds to the amount of the grant plus the interest rate it would have cost to borrow the same amount of money on commercial terms. For the government, the expenditure would consist of the grant itself and the administrative cost related to its distribution. Other subsidies are more difficult to assess, in particular with regard to deciding the value the subsidy represents to the industry. The value is the change in profits but this change should be measured compared to what? Disregarding various economic theory considerations[6] and taking a practical approach, it is suggested that the change is measured as the difference between a situation with the particular subsidy and a situation without it. This approach is also in line with how we identify fisheries subsidies, i.e. by the definition of benchmarks representing the "normal" - non-subsidy - situation. Accordingly, in cases when the subsidy means offering services or goods at a price different from an existing market price, such as favourable loans at low interest rates or a decommissioning programme paying for vessels to be scrapped, the real benefit to the industry consists of the difference between the price offered through the subsidy measure and the market price the industry would have paid or received for the service or good had the subsidy not been available.
For subsidies for which there exist commercial alternatives at market prices, the calculation of the value of the subsidy is hence relatively apparent. Also subsidies such as tax rebates that clearly represent a situation where the fisheries industry is treated differently from industry in general are fairly uncomplicated to assess. The value to the industry would in such a case be the difference between the tax actually paid and the tax that would have been paid had there not been a subsidy. Here the benchmark is not the market price - because there is no market price for taxes - but the normal tax rate. The cost to the government should be calculated as the revenues foregone owing to the scheme plus any additional cost involved in administrating the scheme.
|
BOX 4 The total cost to society of an economic activity can be referred to as its social cost. It represents the sum of the opportunity costs of the resources used and any other costs imposed on society from the activity. The opportunity cost of an activity is the value of benefits that have to be given up by using the resources for the chosen activity rather than for something else. With regard to government expenditure in our context, assessing the opportunity cost would mean assessing what the funds spent on, for example, the construction of a fishing harbour, could have been used for instead - maybe a school or improved health services - and the value of these foregone benefits. This value may of course be difficult to calculate, especially if there are no corresponding market prices. In situations where there are no actual prices reflecting the real sacrifices made for pursuing a particular economic activity - as is often the case with government spending - the opportunity cost to society is referred to as the shadow price. Hence, the methodology proposed by the Guide - to define the government cost of a subsidy as the direct public expenditure and related administrative costs - is of course an oversimplification of reality. It could be argued that to calculate the real cost, a much broader analysis would be needed looking at the shadow price, including an analysis of, for example, externalities in the form of pollution or long-term environmental impact. However, this type of evaluation is difficult in practice and is hence considered beyond the scope of the type of study suggested by the Guide (see also section 6.2). Nevertheless, the concept of opportunity cost is important and economists would argue that it is the only true cost. Hence, in those cases where our data permit, we could include an estimate of a "simplified" opportunity cost when calculating the government cost of a subsidy. For example, this could be the case when we look at government interventions including investments for which there are generally accepted standard values indicating reasonable rates of return; the opportunity cost of capital could then be added to our estimate. However, generally, unless we have very clear indications of its value, the Guide recommends ignoring the opportunity cost since its calculation is likely to be arbitrary at the best. |
As already noted, the situation becomes much more complicated when we look at areas such as fisheries management and resource access, typically some of the services included in Category 2 as well as Categories 3 and 4 subsidies, i.e. regulations and government inaction. For some of the former, i.e. specific services provided by the public sector in Category 2 and regulations in Category 3, we may know the cost to the government but what is the value of the service to the industry? Here the principle of market prices and norm values cannot be used, simply because there are none. In these situations, we may want to assess the actual impact on the profits of the industry, generally in the form of increased revenues. For example, if we can estimate the value of increased sales of fishery products owing to an "Eat Healthy Food" and fish consumption campaign, the value of this campaign to the industry would be the increase in net income thanks to the improved sales.
However, this type of calculation is often a cumbersome exercise requiring a substantial share of research that is not always a practical option for our fisheries subsidies study. Hence, in these cases we may need a proxy for our estimate and the Guide suggests using the cost to the government - if known or estimated - also as an estimate of the value to the industry.
|
BOX 5 In the agriculture sector, various methods have been developed for measuring subsidies in relation to trade distortions. One tool commonly used is the Producer Subsidy Equivalent (PSE) which has been the basic Aggregate Measurement of Support (AMS) in GATT/WTO trade negotiations. According to the OECD, "the PSE is an indicator of the value of the transfers from domestic consumers and taxpayers to producers resulting from a given set of agricultural policies, at a point in time" (Silvis and van der Hamsvoort 1996, page 529). It would naturally be interesting to use this type of measurement also for the fisheries sector. However, work by OECD (1993) has shown that due to the characteristics of the fisheries industry, the PSE is not a valid indicator for fisheries subsidies. Generally, in other sectors, the benchmark against which assistance and related trade distortions are measured is a situation of no government intervention, which corresponds to a situation of economically efficient allocation (see also Box 2). In the fisheries sector, this benchmark situation of efficient allocation is much more difficult to assess as market failure is inherent to an open access fishery, implying that efficient allocation will only occur in a situation with government intervention. Moreover, it is difficult to establish external reference prices as well as domestic prices for raw fish - parameters required for the PSE model - because fresh fish is highly perishable and heterogeneous, and as a high degree of vertical integration is often found in the sector (OECD 1993). In addition, the restrictions to access by foreign vessels to domestic fishing grounds and to port facilities constitute a common public support in the fisheries sector that the PSE model does not take into account (Munk and Motzfeldt 1993). No other single assessment methodology has been found and instead a variety of approaches is being suggested by the Guide for assessing the different types of subsidies. When identifying these approaches, attention has been given - to the extent possible - to their practicality, i.e. the methodologies recommended should be workable and give results easy to understand and verify. This approach could be considered unsatisfactory from a theoretical point of view but it is believed necessary for practical reasons. |
There are unfortunately also cases when there is no easily estimated government cost to use when we have problems estimating the value to the industry. As we have seen in section 5.5 above, Category 4 subsidies do not incur costs as such to the government because they are non-interventions[7]. In these situations, we may have to turn to the use of standard or conventional values in order to quantity the impact of the subsidy on industry profits. An example of this, which is discussed further below, is the issue of resource rent in the context of free access to resources. If the industry is allowed to fish without paying for this access to a natural resource - or it is paying a fee that is considered below the actual value of the resource access - we may want to define this privilege as a subsidy and cost it in proportion to the value of the catches, using an estimated standard rate.
Before moving on to looking at examples of how to value different types of subsidies in the next chapter, the main principles for how to assess fisheries subsidies are summarized in Figure 8.
|
FIGURE 8
Estimates of the value to the industry to be based on: 1. The corresponding market price value, if available, of the service or good provided through the subsidy. For investments, the financial cost (i.e. corresponding to commercial interest rates) should be included. 2. The normal rate or situation applicable to other industries and to the economy in general (e.g. tax rates, acceptable pollution levels, etc.). 3. An estimate of the net income effect of the subsidy, if there is no applicable market price or norm value. 4. The public cost, if there is no applicable market price or norm value, and an estimate of the net income effect is not possible. 5. A standard, conventional, value related to, for example, turnover, if no other value is available.
Estimates of the cost (revenue) to the government to be based on: 1. The actual budgetary expenditure, when available. 2. Foregone revenues, when applicable (e.g. tax rebates). 3. Related administrative costs including personnel costs and a proportionate share of overhead costs. 4. The capital opportunity cost, when applicable and realistic and justifiable estimates are available.
|
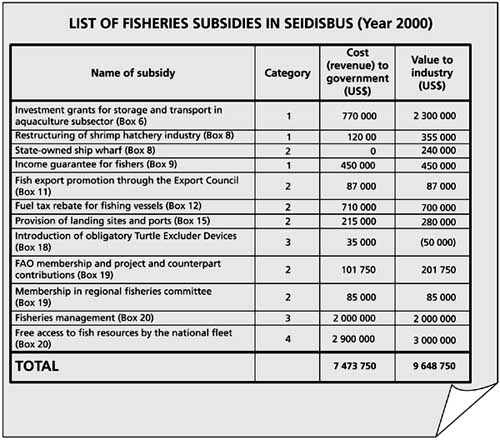
Having looked at some general principles for how to assess fisheries subsidies, we will now discuss different types of subsidies in more detail. The text is organized according to the main groups of subsidies that we are likely to come across and approximately following the structure of section 6.4, i.e. starting with some of the most direct Category 1 subsidies. Additional information on particular methodological issues and examples - using an invented country called Seidisbus - are given in boxes. These fictitious examples aim at illustrating, in a simplified way, how the industry value and government cost can be calculated in practice. The values are calculated for one year and are summarized in Figure 9 at the end of the chapter.
An investment grant programme is probably one of the most obvious examples of a direct financial transfer subsidy of Category 1. These schemes are commonly used for the purchase or modernization of equipment and facilities, having improved competitiveness through more efficient production as an objective. They generally benefit investments in fishing vessels or in the processing industry but can also be found in other parts of the sector, for example, in the input industry for shipbuilding or in the aquaculture subsector.
|
BOX 6 In the country Seidisbus, the Department of Fisheries operates a scheme through which aquaculture producers can apply for grants for improving their fresh fish storage and transport facilities. In the year 2000, a total of 25 aquaculture firms applied for and received funds for investments in cold storage and insulated trucks for a total amount of US$ 700 000. This was a somewhat lower amount than what had usually been given out during the last few years. The market interest rate that would have been charged by commercial banks for giving loans for this type of investment was 15%. The economic life span of the equipment was estimated as seven years. In a fisheries subsidies study in 2000, the government cost of the investment grant scheme was estimated as the total amount of the grants disbursed plus administrative costs (part of the Aquaculture Unit's budget), i.e.: 700 000 + 70 000 = US$ 770 000. The value to the industry in 2000 was calculated as 1/7 of the total amount of the grants received in 2000 (cost allocated evenly over seven years according to the straight-line depreciation method) plus 1/7 of all grants disbursed in the previous six years plus a 15% financial cost: 14 000 000 (total amount of grants 1994-2000) divided by 7 + 15% interest = US$ 2 300 000. |
The value to the industry of this type of subsidy scheme consists of the value of the grant itself plus an estimate of the interest it would have cost to finance the investment commercially. Generally the investments are in fixed assets for which the cost is allocated over a depreciation period of several years and the annual value to the industry should be calculated accordingly. The length of the depreciation period and the amount to be charged to each period should be based on the expected economic life span of the type of asset in question. We may also want to consider the effect of inflation and the change of monetary values over time and calculate the present value of the depreciation cost for the year of our study.
Programmes involving financial transfers for reducing fishing capacity are used in many countries. These schemes involve financial compensation for scrapping or exporting fishing vessels to third countries. The effects on the profits of the industry of such programmes are complex and depend on how exactly the scheme is designed and implemented. If the scheme is used to facilitate the exit - for example the retirement - of individual fishers from the industry, the benefits will accrue to the remaining operators through the sharing of existing resources between a smaller number of actors and thus improve their productivity and profits - assuming that the decommissioning grant is not at all used for reinvestment in the sector and that there are no new entrants into the fishery, replacing those that left. In the longer term and if the decommissioning scheme has entailed a sustainable decrease in real fishing effort, the effect may also be felt through better catches thanks to an improved resource base. This scenario is of course assuming that overcapacity and overfishing were problems in the first place.
If the decommissioning grant is instead reinvested in the sector, the subsidy would mean a more direct capital injection into the industry that can be used either for covering operating expenses or for other investments. The effect on productivity and catch volumes will depend on the impact of these expenditures on the total fishing effort and the state of the resources. If the decommissioned vessel is not scrapped but transferred into another fishery, its effect on this other fishery also has to be considered in order to assess the total effect of the scheme on the fishing industry as a whole.
Accordingly, a vessel buyback or scrapping scheme can have a value to the fishing industry in several ways depending on the characteristics of the particular programme. There are values created to the industry in the form of the increased resource base left for the remaining fishing vessels to exploit in addition to the compensation payments paid for the scrapped or exported boats. The direct financial transfers made in connection with buy-back programmes can be classified as Category 1 subsidies. If the price paid for the vessel by the government scheme is higher than the market price that could have been obtained had the vessel been put on the market, this surplus constitutes the value of the subsidy to the industry. The cost to the government would be the actual payments plus any related administrative cost. The more implicit resource related effects are better reviewed in the context of Categories 3 and 4 subsidies. These effects can be immediate or in the longer term and are related to the value of free access to resources (see section 6.5.19). There can be either an explicit increase in quotas for these operators or an implicit possibility to catch more fish thanks to less competition.
Licence, permit and quota buyouts are similar schemes likely to have comparable effects as the decommissioning programmes, depending on the particular conditions and circumstances. In the processing sector, equivalent schemes exist for factory rationalization, i.e. incentives for reducing capacity. Retraining programmes - for fishers or other employees of the sector - with a view to facilitate their redeployment in other industries, i.e. outside the fisheries sector, are measures that also aim at reducing the capacity of the sector.
Depending on circumstances, we may want to consider government provision of equity capital as a Category 1 subsidy. Also state-ownership - based on earlier state capital infusions - should be looked into by our subsidies study, i.e. partly or fully state-owned enterprises, such as government run hatcheries, ship wharves or fishing companies, as Category 2 subsidies. On the other hand, if the state capital investment is consistent with usual investment practices and is made on commercial terms, there is likely to be no cost to the government nor any value to the industry - comparing the terms on which the state investment is made with the conditions of the capital market - and hence the event cannot be defined as a subsidy. However, the issue of state capital equity and state-owned enterprises is complex and further definitions are proposed in Box 7 and examples are given in Box 8.
There are a variety of income support schemes and unemployment insurance schemes for fishers. Some of these are part of general social insurance schemes while others are specifically designed for fishers. The schemes can be co-financed by contributions from the fishing industry or be entirely publicly funded. Some examples of the fisheries specific ones are:
Bad weather fishers unemployment compensation scheme
Fishers off-season unemployment insurance
Fishers vacation support payments
Fishers minimum basic wage
Government funded health programmes for fishers
Generally, these schemes belong to Category 1 and their value to the industry corresponds to the difference between the actual net income fisheries employees receive with the schemes as compared to how much they would have received without them. Industry contributions - or contributions directly by the employees, other than ordinary income tax or other obligatory fees not specific to the fisheries sector - should be deducted to arrive at this net value.
|
BOX 7 To decide if a government equity infusion and state ownership should be considered subsidies, we usually look at whether the investments have been made on commercial terms or not. However, the situation can sometimes be confusing and to facilitate the assessment of state capital equity subsidies, the below procedure is suggested. The criteria we are looking at include whether the receiver is a company or not, whether the investment is in the form of equity and if it is made on commercial terms. Step 1. Define whether the receiver of the investment is a company or not (as opposed to a government institution or department): It is a company if:
Step 2. Define whether the investment is in the form of equity or not (as opposed to a loan or a grant): It is equity if:
Step 3. Define whether the investment is commercial or not (as opposed to for non profit reasons): It is commercial if:
1. If the investment has been invested in a company as equity for commercial purposes:
2. If the state capital has been invested in a company as equity but not for commercial purposes:
3. If the state capital has been invested in a company but not as equity and not for commercial purposes:
4. If the state capital has not been invested in a company and not as equity and not for commercial purposes it is not a state capital equity subsidy measure (but may constitute another type of subsidy). |
|
BOX 8 In Seidisbus, the state intervenes in the fisheries industry in several ways. There is, for example, a state-owned ship wharf and a few years ago, the shrimp hatchery industry was restructured. The privately owned hatchery industry had been faced with insolvency due to some unfortunate investment decisions coupled with unforeseen changes in the market. However, the government considered the industry vital for its development of exports and it was decided that it should undergo a state-supported financial restructuring. The restructuring process involved the temporary nationalization of the two company groups concerned, i.e. the government absorbed the debt of the firms and converted this debt into equity, reorganized the operations into one company and resold this company to the public. This process took three years and covered the following dealings: |
|
|
· 1998: Government purchase of equity (debt conversion) |
US$ 300 000 |
|
· 1999: Government payments for new investments and other restructuring costs |
US$ 200 000 |
|
· 2000: Sales proceeds to the government from the privatization of the restructured company |
US$ 400 000 |
|
In the fisheries subsidies study carried out in the year 2000, it was agreed that the whole operation should be considered a state capital equity subsidy according to the criteria given in Box 7 (see point 2: state investment in a company as equity but not for commercial purposes). It was also decided that the total cost to the government should be reported in the year 2000 since the transaction was finalized then and it appeared more appropriate to see it as one integral transaction instead of divided over three years. Ignoring the possible effects of inflation on the monetary value of the payments made, the net outlay on behalf of the government amounted to US$ 100 000. In addition, there were substantial administrative costs involved; an estimated US$ 20 000 had been spent on staff and overhead expenses related to the transaction. Hence, the total government cost reported in the year 2000 fisheries subsidies study was US$ 120 000. With regard to the calculation of the value to the industry, the government outlays in 1998 and 1999 were considered equivalent to "loans" that were "paid back" by the industry when the company was privatized in 2000. The value to the industry would hence be represented by the interest cost that would have had to be paid had the government capital infusions instead in fact been commercial loans. Two different rates of interest were used in the calculation according to estimates of the corresponding commercial rates; 20% for the debt conversion in 1998 (higher risk investment) and 15% for the operational investments in 1999. The part of the "loan" that was not paid back - US$ 100 000 - was valued at its face value:
Actual capital contribution = US$ 100 000 The total industry value was hence estimated at US$ 355 000. Concerning the state-owned ship wharf, it is a fully state-owned commercial venture. Accordingly, in our fisheries subsidies study, the cost to the government was considered to be nil (see Box 7, point 1). The total equity capital of the company is US$ 2 000 000 and the value to the industry was calculated as a percentage - corresponding to the market interest rate generally applicable to the sector - of this amount: 12% on 2 000 000 = US$ 240 000. |
|
|
BOX 9 In our invented country Seidisbus, the fishers in the semi-industrial and industrial fisheries are organized in a Fishers' Association that administers various matters on behalf of the fishers and represents them in different contexts. The Association collects fees from its members to pay for its running costs but there are also a number of support schemes for which the Association receives funding from the government. For example, there is an income guarantee scheme that compensates fishers for loss of income during periods when fishing fails that is financed at 90% by the state. The scheme guarantees a monthly income of US$ 500. During the year 2000, a total of US$ 500 000 was paid out under the scheme. In the 2000 fisheries subsidies study, the cost of the scheme for the government was calculated as 90% of 500 000 = US$ 450 000. No overhead or administrative cost is considered because the Association manages the scheme and the administrative cost of the Ministry of Fisheries for disbursing the funds is minimal. The value of the scheme to the industry is considered equivalent to the US$ 450 000 received from the government and disbursed to the fishers. |
|
BOX 10 Care should be taken to understand situations where profit-enhancing and profit-decreasing subsidies are combined. When there are industry contributions to support schemes and subsidy programmes, these should be deducted from the gross public cost and from the calculated industry value to arrive at the net public cost and the net value to the industry. However, it is usually good practice to show both the gross and net values in a fisheries subsidies report. |
Market price support can take several forms and is defined by OECD as occurring when the domestic price of a product is higher than the world price as a result of government policy (OECD 2000). Price regulation systems such as those in place in, for example, the EU and Norway are Category 1 subsidies. Through these systems, compensation is given to fishers whose fish do not reach an established norm price. Price compensation systems can be financed, at least partly, by the industry itself through levies on landed fish. The subsidy's value to the industry is the actual compensation paid out assuming it equals the difference between the amount the fisher would have received had there not been a price support scheme and the total amount the fisher has received with the scheme. If the programme is co-financed by the industry, the industry contributions should be deducted in order to arrive at the net value of the programme. If a government body administers the programme, the cost of the scheme to the government should include an estimated administration cost in addition to the total compensation payments.
A price support could of course also take other forms and could concern, for example, inputs to the fishing or aquaculture subsectors, e.g. drugs needed for breeding of fish or support for the production of a certain gear. Price support also exists with regard to transport costs, often with the objective to reduce disadvantages in remote areas and forming part of regional development programmes.
The marketing side of the industry - both regarding domestic sales and exports - can be supported in many other ways other than by direct price support, e.g.:
Organization of national markets and provision of related infrastructure
Regulations in national markets (e.g. sanitary and health standards, obligation of sales through auction, ban on using certain species for reduction, etc.)
Aid granted to domestic marketing
Sales tax exemptions
Promotion of fish consumption
Direct export incentives
Export and marketing assistance, e.g. measures assisting foreign trade such as international trade fares or provision of information on international markets
Market research
Free trade zones
These measures are generally Category 1 or 2 subsidies and should be categorized according to whether the particular support programme involves a direct financial transfer to the industry (Category 1), or not (Category 2). Some activities may be classified as Category 3 subsidies, e.g. certain types of market regulations.
When assessing the value of the subsidies, there are many different aspects to consider. For example, the organization of national markets probably involves administration - i.e. personnel and overhead costs - but it may also include the physical infrastructure in the form of fish markets. Larger infrastructure projects clearly targeting the fisheries sector such as fish markets - as well as fishing harbours discussed below - are generally examples of public investment subsidies to the fisheries industry.
Government activities that indirectly support the marketing side of the fisheries sector are difficult to assess. For example, the promotion of fish consumption could be part of a broad government information campaign for healthier food habits and the fisheries sector would then only be one among other food sectors being affected. An estimate of the value of the campaign to the fisheries industry should then be based on only a part of the overall cost for the campaign. This cost accruing to the fisheries sector could be calculated according to a distribution index based on the total value added created by the different subsectors, i.e. generally reported as the different subsectors' contribution to GDP[8]. Other distribution indices that could be used, depending on circumstances, include, for example, the number of employees or the total sales value (turnover) in the various subsectors. An alternative method would be to use the concept of marginal cost; the value of the subsidy could then be set equal to the additional cost incurred for allowing the fisheries sector to participate in the activity.
One quite common fisheries subsidy is to provide fuel at a lower tax rate to fishing vessels. If the fisheries industry has access to fuel at a lower cost than other industries, the scheme could constitute a Category 2 subsidy.
The value of tax exemptions is calculated as the difference between the "normal" tax rate, i.e. the rate applied to other sectors of the economy, and the lower rate granted the fishing industry. For the government, the cost would be represented by the foregone tax revenues and administrative costs related to the scheme.
Other reductions in public fees and taxes implying that inputs, supplies and services are provided below market price should be valued at the difference between the price actually paid by the industry and the market price or price generally charged to other sectors.
|
BOX 11 In Seidisbus, exports of fish and fishery products represented 25% of the total export value in the year 2000. Under the Ministry of Trade, there is an Export Council working on promoting exports, both of fish and of other products. In addition to providing various information and contact services, the Council organizes a trade fair every two years. The fair is funded by the Council and by contributions from the participating export companies. In the trade fair 2000/2001 - held in February 2000 - 30 of the 100 exhibitors were from the fisheries industry. In the fisheries subsidies survey, the activities of the Export Council were found to be a subsidy to the export sector as industry focusing on the domestic market did not receive the same support. The total budget of the Export Council in 2000 amounted to US$ 300 000 covering costs for personnel, rent of offices, depreciation on vehicles and office equipment, and other operational expenses. The cost for organizing the trade fair in 2000 was US$ 50 000 whereof US$ 40 000 were extra-budgetary funds provided by the Council (i.e. excluding costs for ordinary staff of the Council and general overhead costs) and US$ 10 000 fees collected from the participating companies. The cost to the government of the "Export Council subsidy" in 2000 was calculated as follows:
Considering that the trade fair is a biannual event, we could consider allocating the cost over two years. However, in this particular case, it was decided against considering the relatively small amount and that the benefits of the fair were likely to occur already in 2000. With regard to the value of the subsidy to the industry, no comparable market prices were found and it was decided that the cost to the government should be used as a proxy for the industry value, US$ 87 000. Over the next year, the Export Council plans to do a questionnaire survey among the exporting companies to evaluate the likely impact of its activities on export sales and net income. In a future fisheries subsidies study, the results of this survey could be used for assessing the value of the subsidy to the industry. |
Benefits gained through investment tax credits are Category 3 subsidies that should be assessed by comparing the subsidized scheme with the normal tax regulations applicable to other industries. However, because this type of tax credit often means a redistribution of costs over a period of years by allowing accelerated depreciation of fixed assets, i.e. faster than the real economic life span, or by allowing investments to be made out of non-taxed profits on certain conditions, the actual value of the scheme to the industry in a specific year is usually difficult to calculate. One benefit is the extra capital made available for additional investments and this could be valued at the cost of commercial interest rates. Other benefits include the easing of fluctuations in income over a period of years that would constitute a subsidy equaling, for example, an income loss or unemployment insurance or the financial cost of borrowing working capital.
Deferred tax programmes are similar to the investment tax credits and a similar approach for evaluating their benefits to the industry should be applied. With regard to government costs, it is the foregone revenue and the related administrative costs that should be estimated.
|
BOX 12 Fishing vessels in Seidisbus that are registered with the Fisheries Department benefit from a fuel tax rebate. The amount of rebate depends on the type of fuel used; gasoline, diesel and oil mixtures, and there are maximum quotas per annum per fishing vessel based on the horsepower of its engines. The rebate is refunded by the Department of Fisheries when the eligible fisher presents a claim. The cost to the government is calculated as the foregone revenue plus administrative costs, i.e.:
The value to the industry is assumed to be the same as the actual rebate, i.e. US$ 700 000. Even though tax rebates are generally classified as Category 2 subsidies, we could consider classifying this particular programme as a Category 1 subsidy as it in practice involves a direct financial transfer (through the procedure of reimbursements according to claims). |
When the fisheries industry is offered loans on favourable conditions through government institutions, these are often classified as Category 2 subsidies. A favourable loan may be a loan at a subsidized interest rate or on other favourable terms such as an extended amortization period. When there is a subsidized interest rate - or a favourable interest rate is obtained with the help of a loan guarantee - the value to the industry could be estimated by comparing the subsidized interest rate with prevailing market rates. When the subsidy consists of other favourable terms, the assessment of the value to the industry becomes more difficult and will have to be reviewed on a case by case basis. If we consider that the reciepient firm(s) would not at all have been able to obtain a loan without a government guarantee, we may want consider the amount of the actual loan as the value of the subsidy. With regard to the government cost, it would be appropriate to consider costs related to payments for defaulted loans. If there are no such costs, the cost to the government is usually limited to the administrative cost of operating the schemes.
Insurance schemes run or underwritten by governments are often classified as Category 2 subsidies when they offer the fisheries industry terms and conditions that are more favourable than those on the commercial insurance market. The industry value of these schemes could be estimated as the difference between the subsidized premium cost to the industry and the corresponding market price for an equivalent insurance. If there is no market price available for the particular type of insurance, an approximation could be made taking the perceived risk into account. The government cost would be calculated as the amount of claims paid out and the administrative cost involved in the managing the scheme less insurance premiums paid by the industry. Also the value of the subsidy to the industry could be based on these actual government costs, in particular if the amount of claims is significant and there are no applicable market prices.
|
BOX 13 Many of the costs related to fisheries subsidies are indirect costs, i.e. overhead costs of authorities and administrations designing and implementing a support scheme or a regulation. By definition, these costs are generally not directly related to a specific activity and need to be calculated using some sort of distribution index as discussed in section 1.5.7 on page 15 above. In this context, we also need to think about how many different stages or levels of overhead we want to include when assessing a particular subsidy. Let us assume that we are calculating the government cost for an investment grant scheme in the aquaculture sector (see also Box 3). The scheme is administered by the Aquaculture Unit of the Department of Fisheries of the Ministry of Agriculture and Natural Resources but financed from a special fund for sustainable rural development within the Ministry of Finance. The cost of the programme is first of all the grants themselves, which represent the direct cost. But what administrative and overhead costs should we include? If the administration of the scheme makes claim to a fair amount of time and resources of the Aquaculture Unit, part of its budget - calculated according to a suitable distribution index - should be assigned to the grant scheme. Then we could argue that also part of the budgets of the Department of Fisheries and the Ministry of Agriculture and Natural Resources should be linked to the grant scheme as the Aquaculture Unit draws on their resources. Some administrative costs of the Ministry of Finance could also be related to the channelling of funds. However, these calculations easily become quite complex and if we think that the administrative cost is negligible, we could probably ignore it. Accordingly, in the above example, only calculating the overhead and administrative cost of the Aquaculture Unit may satisfy us. |
Various types of specialized training and extension services are sometimes available for the fisheries industry, fully or partly funded by the government. There may be training courses on fish handling, safety at sea or in seamanship. Many governments provide extension services with a view to facilitate, for example, the introduction of technologies in the processing sector or to promote the use of better seeds in rural aquaculture. Generally, these types of activities are Category 2 subsidies. With regard to assessing their value, improved skills usually mean improved production with increased income as a result. If such an effect can be deduced directly from the subsidized training or extension scheme and we can measure the effect, this could also be used as for the assessment of the value to the industry.
To assess the cost to the government of these services may be fairly easy, in particular if they are provided through separate administrative entities, such as a training institute or an extension unit of a fisheries division. With regard to the value of training courses to the industry, market prices may be available for similar tuition in other subject fields.
Strict quality requirements in the world's main fish importing countries have put pressure on quality assurance for export products. European importers (the EC; now the EU) issued the first regulations with regard to the control of fishery products in 1991 and have since expanded the system to the so called "own health checks" which extends the application of hygiene and quality controls to the whole production chain.
|
BOX 14 In some countries, there are guidelines and standards for how annual depreciation plans should be calculated based on estimated economic life spans for various types of investments and capital expenditures are allocated over time with annual depreciation costs reported in the public accounts. Generally, annual depreciation provisions are calculated according to one of two methods: the "straight-line" method or the "reducing-balance" method. When available and found to reasonably reflect the likely economic depreciation, we can use these values for estimating the government cost of fisheries subsidies containing fixed assets. However, in other countries, the government accounts are based on a cash accounting principle and do not include costs for depreciation; the investment is accounted for in its totality at the time of expenditure. In other cases, the depreciation cost reported in the accounts is not based on the expected economic life span but is an accounting or fiscal depreciation cost. This may make it difficult to estimate the annual depreciation cost for our fisheries subsidies study. If the investment is small, the capital cost may have to be disregarded and when assessing, for example, a small landing site, only the operational expenditures as reported in the government accounts would be included. However, when assessing more substantial infrastructure subsidies, e.g. a port facility, it would be necessary to find out - or at least estimate - the relevant investment cost or the real government cost of the measure would be - maybe significantly - undervalued. It is also important to note that earlier subsidy schemes may still have a value to the industry even if no disbursements were made in the year for which the study is being carried out. In the same way, important investments made in the year under study could be allocated over several future years. For more important investments with a long life-span we may also want to consider the effect of time and estimate the present value of the depreciation cost. |
Also other countries have introduced similar regulations (FAO 2000b). If the required inspection and certification services are provided to the exporting industry free of charge or at a price lower than the related operational costs, we may want to classify the services as a Category 2 subsidy.
The production standards stipulated by the importers also generally require investments in equipment and infrastructure. If these investments are paid for by the industry, the regulation may initially have a negative impact on the industry's profits and only pay off in the medium or longer-term. Regulatory measures should be classified as Category 3 subsidies. The assessment of the value to the industry of the regulation and the services provided should preferably be based on an estimate of the value of the increased exports to the markets requiring the certification and the costs of fulfilling the conditions.
Governments generally provide infrastructure such as roads, dams, bridges and public buildings and this is commonly considered to be the responsibility of the government: it is acceptable to finance basic infrastructure, beneficial to citizens in general, by tax payments through the public budget (at least partly; there are also many examples of users contributing directly to the costs of some of the more general facilities through, for example, road taxes).
However, infrastructure that is specific to a group of citizens or a particular sector of the economy and for which the costs - investment costs and operating costs - are not recovered from these groups of users could be considered a subsidy. The line between general and specific infrastructure is sometimes difficult to draw and we may have to make a more detailed analysis of the actual users of a particular facility to decide whether it should be considered a fisheries subsidy. Commonly, one of the clearest examples of a subsidy of this type is the provision of fishing port facilities. Harbour dues are often collected but unless these cover the entire cost of building, maintaining and running the port, the provision of the facility could be considered a Category 2 subsidy. Other examples of fisheries specific infrastructure are fish markets that were mentioned in section 6.5.7 above. The annual cost to the government of this type of subsidy should be estimated as the depreciation cost per year in addition to maintenance and other operational costs for running the facility. Regarding the value to the industry, it should preferably be estimated as the prevailing market price for using similar types of facilities as the ones being provided. In many cases, however, there is no market price alternative and we may have to use the government cost as a proxy when estimating the industry value.
|
BOX 15 There are ten different landing sites and small ports along the coast in Seidisbus, operated by the local city municipalities. The facilities at the landing sites vary but generally include gas pumps, jetties, toilets, storage lockers, fish wash stands and engine repair rooms. At each site, there is a caretaker - employee of the municipality - who is responsible for the management of the site. The sites are mainly used free of charge by some 800 artisanal fishing boats. In a fisheries subsidies study, the provision of these landing site facilities free of charge was considered a subsidy to the fisheries industry as this type of services does not exist in other economic sectors in Seidisbus. However, the assessment of the subsidy caused problems because the capital cost of the investments were not accounted for on an annual basis in the accounts of the municipalities; as the government practices a cash basis accounting principle, the capital expenditure is accounted for in the year of payment and no depreciation costs are allocated over time. Moreover, some of the facilities were very old and it seemed difficult to establish when they had been constructed. Hence, to estimate the annual depreciation cost to be included in the calculation of the government cost of the subsidy various assumptions and approximations had to be used. Some of the investment expenditures could be found in the accounts of previous years. By consulting other departments of the government involved in public infrastructure projects, estimates of the values of other items were obtained as well as their likely economic life spans. Accordingly, the total cost to the government of the ten landing sites were calculated as follows:
With regard to the value of the subsidy to the industry, the annual cost per boat, i.e., approximately US$ 270 according to the above calculation, was compared with the prices charged by two private boat clubs offering mooring and other facilities to leisure boats: US$ 500 per boat per year. Taking the differences in facilities and services into account, it was concluded that a reasonable market price for the landing site facilities offered by the City Municipalities would be around US$ 350. Hence, the total value to the industry was calculated as:
|
In some countries, domestic fishers are granted the privilege of free access while foreigners pay some sort of access fee. When a government pays these access fees in foreign countries for its own fishing fleet, these could be considered as Category 2 subsidies with a value to the industry equivalent to the actual annual cost of the fishing right.
Governments often fund research institutes and activities. Certain R & D, leading to efficiency improvements, is likely to be carried out also by the industry and government funded research is then a direct support to these activities. Other research may be more related to fisheries management and resource protection and could, for example, provide management information or lead to the development of gear that is then imposed on the industry through gear regulations. R & D activities are probably best classified as Category 2 subsidies but those closely related to fisheries management could possibly also be included with the regulatory measures in Category
3. With regard to the assessment of their costs and values, we are likely to encounter similar difficulties as we are for fisheries management and the industry value may have to be assumed to be the same as the government cost (see Box 16).
Border measures that do not involve a financial transfer to - or from - the industry can be classified as Category 3 subsidies. These include regulatory frameworks such as import quotas and other non-tariff measures, import tariffs as well as landing bans for foreign fishing vessels and can represent important advantages for the domestic industry. The measures represent in practice transfers from consumers to fishers arising from government policy (Flaaten and Wallis 2000). Tariff escalation regimes are border measures that benefit in particular the processing industry by allowing raw fish to be imported at lower tariffs than processed products. For importers and traders selling imported products, tariffs may instead constitute a profit-decreasing Category 1 subsidy if the import duties on fishery products are higher than on other imported goods.
The value of the tariffs to the importing industry could be assessed by comparing the tariff for fishery products with the level of tariffs for other products. This may however not reflect the true value of the measure and the approach can in any case not be used for non-tariff border measures. These are often particularly difficult to assess with regard to their value to the industry. If there are international prices available for the products in question, these prices could be used in a comparison with domestic prices to assess how the measure has influenced the national market and price structure. If there is a difference between local and international prices that cannot be explained by other influences, this difference could be used for drawing conclusions with regard to the border measure's impact on, for example, revenues to the local processing industry. However, one of the reasons why PSEs (see Box 5) are difficult to calculate for the fisheries sector is that the wide variety of processed fishery products, many of which are market specific, do not have internationally traded equivalents. It would also be difficult to assume that there are no other influences and the calculation may require more statistical data than are available.
There are also border measures such as restrictions with regard to foreign direct investment, both in the processing and harvesting subsectors. Restricting competition through stopping the free movement of harvesting services constitute implicit assistance to those fishers who are allowed to fish. Such measures include inter alia:
Ownership restrictions
Allocation of catch quotas only to national fishers
Nationality and residence requirements for company officials/managers and crew
|
BOX 16 Sometimes it may be more convenient to define a subsidy according to the organization that delivers the subsidy rather than splitting it up in actual activities or support measures. For example, a research or training institute may be defined as a subsidy in its entirety, rather than separating out the research activities or training courses. At other times, the subsidy is better reported as an activity with several providers, e.g. as fisheries management including inputs from a management division of the Ministry of Fisheries, research activities from an institute and surveillance carried out by the Coast Guard. The approach we chose would depend on the level of detail we are aiming at for our fisheries subsidies study but there are also practical considerations. The way we delineate our subsidies may be influenced by the structure of the public accounts and the organization of the public bodies providing the subsidies. It may be very difficult to calculate the cost (revenue) to the government of a certain situation or measure if the subsidy is defined in a way that cuts across several departments or accounting categories. On the same note, we may want to carry out the study for a financial year, and not on a calendar year basis, unless these coincide. When there is a choice of using the public budget allocation for the year of the study or the actual expenditures incurred, we can use either of the two approaches as long as the difference between the two is not important and a consistent method is used. Likewise, we may have to decide whether we should use figures for approved expenditures or actually disbursed funds. For example, a number of investment grant applications may have been approved in December - at the end of the financial year that we are studying - but the payments are only going to be effected in January. Again, we can use either the accounting or cash basis for our assessment, depending on how the public accounts are organized. In the same context, care should be taken when assessing and reporting on subsidies involving government agencies receiving their funding from other subsidy providing government agencies; we have to avoid double accounting. For example, funds for training provided by the Ministry of Fisheries to a training institute should not be reported both as part of the Ministry's subsidy costs and those of the institute. |
The effect of these types of subsidies to the domestic industry is translated into less competition and therefore potentially larger market shares. When attempting to assess the value of these larger market shares, we are likely to encounter similar difficulties as when assessing other border measures.
To use the government cost of border measures as a proxy may not either appear as a satisfactory option. The cost is likely to be a fairly low administrative cost, badly reflecting the true value of the measure. The government cost may also be difficult to estimate correctly because it is likely to require various overhead calculations. Another option is to use a pro rata standard value, valuing the support measure at, for example, a fixed percentage rate of turnover. The particular situation and the framework of the actual study will have to decide which approach that we should choose.
|
BOX 17 Sometimes it is difficult to define the norm value and there may be several alternative benchmarks. For example, there may be a wide range of customs tariffs for different types of products making it virtually impossible to decide what is the "normal" level. In this case, we may decide to compare the fisheries sector with one or a few other major economic sectors that are similar to the fisheries sector. With regard to the example of customs tariffs, the norm value used for fish and fishery products could be the tariff level applicable to food and agricultural commodities. Another example concerns taxes for which the situation of small independent artisanal fishers, aquaculturists and traders/processors could be compared with small-scale farmers while larger fishing, aquaculture and processing companies are maybe better compared with light manufacturing industry and other food processing industry. In many (developing) countries, the former belongs to the informal sector whilst the larger operations are part of a more organized business structure, operating under quite different conditions (for example with regard to VAT registration and refund). |
Fisheries management is one of the more complex areas with regard to subsidies. The activities included in fisheries management can be divided into three main areas covering a variety of measures and programmes, i.e.:
Research for the creation of information for management decisions
Design and implementation of fisheries management systems
Enforcement of fisheries management rules
(Wallis and Flaaten 2000).
Governments commonly spend a lot of money managing their fisheries. According to an OECD study, US$ 4.9 billion or 77% of all government financial transfers to the fishing industry in 24 OECD countries in 1997 were spent on "general services", a definition covering the three activities included in fisheries management (OECD 2000)[9]. In a handful of countries, fisheries management costs are recovered from the industry but in most countries the service is paid for by the fisheries administration and financed via the public budget. As discussed in section 5.6, it appears that, according to international practice, there is an increasing tendency to regard non-recovered costs for management as subsidies to the fisheries industry.
Fishers are likely to benefit from fisheries management by the increased long-term sustainable output from the fishery that a successful management system implies. In the short and medium-term, there are also benefits from reduced competition - when access is restricted - and from, for example, regulations allowing fish to grow to larger sizes and hence increasing the return per unit of output (Wallis and Flaaten 2000). However, in the short term, fishers may also experience management negatively if it restricts catch volumes.
Most fisheries management activities and environmental protection programmes should be classified as Category 3 subsidies but certain more service-oriented interventions may fit better in Category 2 or even Category 1, if involving a direct financial transfer. The lack of appropriate regulations is generally a Category 4 subsidy. It is, however, recognized that it may be difficult to separate out different parts of the management system in this way in practice. Examples of support programmes and measures that could be identified as subsidies - of different categories - related to fisheries management and to environmental protection include:
Compensation schemes (for closed season, for damaged fish stocks, gear conflict, temporary withdrawal): Category 1
Support to community based management and regional development bodies: Category 2
International cooperation including payment for membership in international and regional organizations active in the field of fisheries management: Category 2
Fisheries enhancement and stocking programmes: Category 2
Support to consultative groups and mechanisms: Category 2
Gear regulations (e.g. Turtle Excluder Devices): Category 3
Chemical and drugs regulations for aquaculture: Category 3
|
BOX 18 In 2000, the use of Turtle Excluder Devices (TEDs) became obligatory on all vessels fishing in the waters of Seidisbus. Many boats fishing for export markets were already using TEDs but the usage was now introduced on a wider scale. The government launched an information campaign and also provided advice free of charge to fishers who were, however, expected to pay for the TEDs themselves. Extra resources were also allocated as from the 2000 budget to the Department of Fisheries for inspection and control of the proper use of the device. The cost to the government in 2000 for introducing the measure was:
It could be argued that the initial costs should have been allocated (depreciated) over a period of several years as they represent a one-time lump-sum, i.e. as an investment at the beginning of the scheme. However, given that the amount was rather small, this was not considered necessary (see also Box 14). Regarding the value of the regulation to the industry, the initial impact in 2000 is a decrease in profits. The marine capture fisheries subsector invested in a total of 100 new TEDs at a cost of US$ 500 each. No immediate economic benefits were perceived even though increased sales in export markets could be expected in the medium-term thanks to improved credibility. Hence, the value reported in the fisheries subsidies report in 2000 was - US$ 50 000 (negative). |
The basic characteristics of fisheries management services - i.e. being activities that the industry would not be in a position to organize and implement itself[10] - make it difficult to estimate a market price equivalent for this type of support. Hence, we are likely to have to resign ourselves to using government costs as a proxy for the value of fisheries management to the industry. This is perhaps in many ways not a satisfactory way of assessing the true short- and long-term effects of catch restrictions or resource sustainability but it is probably the only practical measurement available[11]. The net value of the subsidy equals the total government expense minus any cost recovery form the fishing industry. Cost recovery could take the form of user fees or similar levies. It is important to assess the net value of fisheries management in relation to the costs and value of resource access - discussed below - because the two are closely related.
|
BOX 19 Our invented country Seidisbus is a member of several international and regional organizations of which two are of relevance to the fisheries sector: FAO and a regional fisheries committee for the management of small pelagic stocks. FAO has an office in the country and is also currently implementing a project on marine fisheries management in cooperation with the government. The committee has recently been established and only one meeting has been held so far. In the fisheries subsidies study, it was agreed that these memberships and their related activities should be considered subsidies to the fisheries industry. The subsidies are related to fisheries management but were reported on separately in the subsidies studies, partly because of their nature and partly because their costs to the government are relatively easy to locate in the public accounts. The annual government costs for the different activities were calculated as follows:
Given that no market price or estimate of the impact on industry income was available, the value to the industry of the activities was estimated to be the same as the government cost with the addition of the FAO contribution to the fisheries management project, i.e.:
|
To allow fishers to use resources free of charge or at a cost lower than the actual value of the resources could constitute an important cost-reducing subsidy to the industry that would be classified in Category 4. It could be argued that this is true both in cases of open access as well as in management systems by which permanent or temporary quotas are transferred to the industry, e.g. ITQs. The argument is based on the reasoning that all resources that are scarce have a value to society and by making them available - either indirectly or by granting formal user rights - to the direct users without charging for the use must be considered a subsidy[12].
This concept of free access to resources should not be confused with the issue of fisheries management, discussed above, even though the two are very closely related.
The provision of fisheries management could be a subsidy per se and, in addition, there can be a "resource subsidy". In a hypothetical situation without any fisheries management and hence free access to resources, the latter could be a subsidy. Where there is a fisheries management system in place and fishing quotas are distributed to the fishers free of charge or at a nominal fee, the industry could be said to benefit from both a "fisheries management subsidy" and a "resource subsidy"." At the same time, it should be pointed out the two issues are interrelated - for example, a quota in a well-managed fishery is likely to be worth more than in a badly managed fishery. Moreover, user fees are often used as a management tool. This of course complicates the matter and the question is: how do we estimate a value of the resources?
According to economic theory[13], the value of the resources could be estimated as the opportunity cost to society - or shadow price - of making the fishery resources available to the fishing industry in a certain way. The user fees could be set at a level allowing the government to recover the society's full cost, i.e. including costs associated with the impact of fishing on non-targeted species, with collateral environmental impacts and the more general cost of removing the resource at present rather than in the future (Milazzo 1998). However, it could also be argued that, if environmental and social costs are disregarded, the immediate opportunity cost of, for example, a free distribution of quotas corresponds to the price that the government could obtain if making the fishery resources available in an alternative way, e.g. selling the rights to fish in an open market to the highest bidder. The value to the industry would also correspond to this market price, i.e. the price that the industry would be prepared to pay for the quota. Unfortunately, there are very few examples where there is this type of free and open market for fishing rights that could give guidance to the value of the resources in general. Moreover, the existing management regime influences the resource rent of the fishery, which in turn is likely to have an influence on the price the individual operators would want or be able to pay as user fees. With this circle of causes and effects, the actual value of the resource is difficult to determine.
Many countries charge licence fees to foreign fishers but not for domestic operations, or at a much lower level. This difference could be used as an indication of the value of the fisheries resources, i.e. the subsidy to the domestic industry would correspond to the access fee charged to foreign operators minus the domestic fees, if any. However, it would again be difficult to separate the fisheries management component from the resource access benefit. Empirical work shows that there is a wide variation of currently used rates. According to Milazzo (1998), considering the whole spectrum of user fees, both for foreign and domestic fishers, there is a range from less than one percent to more than one-third of the ex-vessel value of the production. Milazzo uses 5% and 10% of ex-vessel values as two different estimates of global domestic subsidies (excluding distant water fishing fleets) covering both the "fisheries management subsidy" and the "resource subsidy".
Here we are at the moment only interested in the "resource subsidy" and the Guide suggests using the concept of resource rent as the basis for assessing the value to the industry of access to resources. Accordingly, the term we will use for this type of subsidy is resource rent subsidy. Where possible, each fishery should be investigated to see what resource rents that are generated. If the industry does not pay a resource access fee (i.e. a fee in addition to any fee for recovery of fisheries management costs) corresponding to a part of the identified resource rent, this could be considered a subsidy. For practical reasons, however, we may have to express the value of the subsidy as a percentage of the landed value of catches, rather than as a proportion of actual resource rents. In the absence of real values of resource rents, the Guide proposes to use a similar general value as used by Milazzo for estimating the value of the subsidy at 3 to 5 percent of the ex-vessel value of production. It should be noted, though, that some fisheries may generate a very low, or even zero, resource rent in which case there would be only a very small resource rent subsidy - or none at all[14] (see Box 21).
|
BOX 20 In Seidisbus, there are no resource rent fees collected from national fishers in the marine sector. In fact, no licence or access fee is charged to foreign fishing vessels either as fishing by third country only takes place within in the framework of reciprocal agreements with neighbouring countries. Nevertheless, the marine fisheries are managed through a quota system. The total government cost for fisheries management - including related research, design and implementation, and enforcement of the management system - was estimated at US$ 2 000 000 in 2000. Since no fisheries management or resource rent fees are collected in Seidisbus, the calculation of the net values of the two subsidies for the fisheries subsidies study could be made without having to assess and deduct industry payments. The total value of the fish landed in Seidisbus in 2000 was US$ 75 millions (see Box 22). Within the framework of the current fisheries subsidies study, no information on resource rents was available. Hence, as an estimate of the potential value of the free access to resources (the resource rent subsidy), 4% of the landed value was suggested. This gave a total of 3 millions which was assumed to correspond to a cost to the government as foregone revenue. However, if this access fee were to be collected, it would involve an administrative cost to the government. The net cost to the government of this Category 4 subsidy would thus be:
The current value to the industry of the resource rent subsidy was assumed to be US$ 3 000 000, i.e. the 4% of the total landed value. With regard to the fisheries management subsidy, both the industry value and the cost to the government were estimated at the actual cost of the fisheries management system: US$ 2 000 000. |
The resource rent subsidy value should be added to the costs of management, discussed above, and factual management cost-recovery fees, resource rent fees or other fees charged should be deducted to arrive at the total net industry value of the two subsidies for fisheries management and resource rents.
With regard to the cost to the government, we may want to consider a non-collected resource rent fee as a foregone revenue and hence a government cost to be added to our subsidies value analysis. However, it should be remembered that imposing and administrating a resource rent fee would involve costs. An estimate of these expected costs would need to be deducted from the foregone revenues to correctly assess the net government cost of not collecting a resource rent fee. Moreover, as when calculating the industry value of fisheries management and resource rent subsidies, we may need to look at the two subsidies together also when estimating their total net government cost, remembering to take any payments from the industry into account.
|
BOX 21 The resource rent, in the fisheries context, is "the value to fishers of the fish in the water before they are caught" (FAO Fisheries Glossary). This value is defined as the "surplus" profits that can be realized in addition to what would be considered a "normal" rate of return, i.e. over and above all costs of production, including the opportunity cost of labour and capital, a risk margin and a return on any investment in exploring and developing the fishery. Resource rents will generally only be realized if fishers have adequate "property rights" over the resources. Without property rights, individual fishers have little incentive to conserve the resource or harvest it efficiently since the benefits of doing so may accrue to other fishers. Hence, in an open access fishery, an excessive level of fishing effort will be used and fishers will continue to fish until there is no remaining surplus or resource rent (Campbell and Haynes 1990). |
If the government allows the fisheries industry to pollute in a way that other industries cannot, we may have identified another Category 4 subsidy. It is also another subsidy for which the value to the industry is difficult to assess: how should it be decided what the "normal" pollution control level is? In a full cost recovery situation and analogous to the discussions above on fisheries management and user fees, the fisheries sector should pay for all collateral impacts on the environment as well as negative externalities caused to other sectors. In practice, however, the Guide suggests that the value for this type of subsidies is assessed by comparing the fisheries sector with other economic sectors with a view to identify areas in which the fishing industry is under less control than other activities. The value of not imposing pollution control would equal the cost of alterations - in equipment and in practices - that would otherwise have been required for ceasing the polluting behaviour.
Another type of situation that could be defined as Category 4 subsidies is the lack of implementation of existing rules and regulations. This could apply to, for example, hygiene and quality control that is not carried out or to fees that should be collected but are not.
In the discussion above on how to assess fisheries subsidies, it transpires that while it is relatively easy to measure subsidies of Categories 1 and 2, it is much more difficult to identify and assign reasonable values to subsidies from Categories 3 and 4, especially with regard to the industry value. Categories 1 and 2 subsidies generally have an explicit financial value that directly affects the costs of production - or the revenues - of a particular firm, while Categories 3 and 4 affect the conditions under which the firm operates and are not directed to one distinguishable recipient or group of recipients. This type of subsidies is generally applicable to the whole subsector or industry and the effects on a particular firm or a group of firms are thus more implicit which make them difficult to quantify. Unfortunately, it is however also difficult to assess the value to the industry as a whole since - as we have seen in section 6.3 - we would base the total industry value on an aggregation of the values of individual firms.
|
FIGURE 9
|
Moreover, as discussed in section 6.2, the Guide focuses on the direct short-term effects of subsidies and the results produced can thus give us an idea of the situation at a specific point in time. These issues should be kept in mind when referring to Figure 9 in which the examples of subsidies presented in section 6.5 are summarized.
|
[5] This reasoning implies that
we are ignoring second-stage effects in the form of shifts in the demand and
supply curves and changes in output relative to the elasticities of demand and
supply. If we consider that the output effect is important as well as
identifiable in the short-term and we have the necessary data, this aspect could
be added to our analysis. In fact, the methodology proposed for measuring the
industry value of subsidies for which there are no market prices or norm values
implicitly implies that the output effect should be taken into account (see page
21 and point number 3 in Figure 8). [6] See also discussion in chapter 4.2 and Box 2. [7] See Box 4. [8] It should be noted that a measure of the whole fisheries sector's - as defined by the Guide - contribution to GDP might include contributions from subsectors not directly reported as fisheries, e.g. the food processing industry and the mechanical industry. [9] It should be noted that the OECD definition of government financial transfers is narrower than the Guide's definition of subsidies and does not, for example, include market price support measures. The study also only covers the capture fisheries subsector. Still, the proportion of funds spent on fisheries management is considerable. [10] There are several reasons why it cannot be expected from the industry to undertake fisheries management, i.e.: the industry lacks the legal authority required to make fisheries regulations successful; the industry is generally not authorized to ban new entrants or impose restrictions on operators; the public good character of the fishery resources invites to free riding behaviour of individual members of the industry (Hannesson 2000). [11] If the net income effect of fisheries management can be measured, i.e. in terms of changes in catch volumes and effects on output and prices, this would be a more correct measurement of the industry value. However, in practice, these aspects are likely to be difficult to assess, in particular if we want to separate short and long-term effects (and arrive at an annual value for our subsidies study). [12] There are of course different views on this and the arguments are generally related to the concept of property rights (Schrank and Keithly 1999). [13] See also Box 4. [14] Care should be taken if we are looking at resource rent subsidies in a fishery where fishing rights have been converted into tradable property rights, e.g. an ITQ system. The allocation of private property rights at a price lower than the entire resource rent of the fishery involves a one-off transfer to one generation of fishers. The value of this foregone rent will be capitalized into the price of the quotas that new entrants will have to pay (Campbell and Haynes 1990). If we look at subsidies to a particular part of the industry, e.g. including new entrants having paid for their fishing quotas at market prices, at a particular point in time, it is likely that there is no resource rent subsidy for that particular part of the industry; their resource rent "fee" is included in the price paid for their quota. However, if we look at the industry as whole in a longer-time perspective and if the initial quota allocation by the government was made at below-market prices, there is a resource rent subsidy involved. [15] The values reported in this table and in the underlying examples are fictitious and do not necessarily bear any resemblance to real costs and values. |
![]()
![]()
![]()