![]()
![]()
![]()
During the introductory stage in the 1950s, the focus was on introducing and encouraging the use of fertilizers through simple fertilizer trials and demonstrations on farmers’ fields and by subsidizing fertilizer prices. Retail prices were fixed by the Government and were kept uniform throughout the country. With the increase in the level of fertilizer use, the emphasis changed to a more balanced use of fertilizer nutrients. However, as the subsidy burden increased, the Government started to phase out the subsidy under the Structural Adjustment Programme and economic reforms. In 1986, all subsidies on nitrogenous fertilizers were removed followed by phosphate fertilizers in 1995 and potassium fertilizers in 1997. Import controls were lifted, the government stopped importing and the private sector took over. The Government imposed a 15 percent general sales tax on all fertilizers in 2001, thus increasing the prices.
Pakistan is self sufficient in urea; hence no urea is imported. In April 2004 the farm gate price of domestically produced urea was about Rs.430 per bag of 50 kg whereas the farm gate price of imported urea would have been around Rs.600 per bag of 50 kg. The price of DAP, the second largest fertilizer product used after urea, is very volatile and depends on international trends. Price disparities lead to high use of urea, and thus to imbalanced fertilizer use at farm level.
Farmers’ decisions on how much fertilizer to use for a specific crop, are linked with commodity prices. Higher fertilizer prices combined with lower crop prices can cause farmers to use low rates of fertilizers. The economics of fertilizer use have always been the over-riding consideration in the demand for fertilizers by farmers, especially the relationship between the commodity price and the input price. Support prices of the major crops have not been revised during the past three years. However, farmers have become so dependent on fertilizers for their crop production that they have been left with no option but to increase fertilizer use. Despite this, fertilizer use is still profitable. Recently the market prices of cotton and sugar cane have been higher than the support price. The relative prices are given in Table 7.
TABLE 7
Relative fertilizer and crop
prices
|
Year |
Average nutrient prices (Rs./kg) |
Wheat |
Paddy (Basmati) |
Sugar cane |
Seed cotton |
|
Rs./40 kg |
|||||
|
2000/01 |
17.60 |
300 |
385 |
40 |
725 |
|
2001/02 |
19.04 |
300 |
385 |
40 |
780 |
|
2002/03 |
19.35 |
300 |
385 |
40 |
800 |
| |
kg commodity required to purchase one kg of fertilizer nutrient |
||||
|
2000/01 |
|
2.35 |
1.80 |
17.60 |
0.97 |
|
2001/02 |
|
2.54 |
1.98 |
19.04 |
0.98 |
|
2002/03 |
|
2.58 |
2.0 |
19.35 |
0.97 |
TABLE 8
Retail prices of fertilizer products (Rs./50 kg
bag)
|
Year |
Urea |
DAP |
CAN |
NP |
SSP |
SSP |
1 US$ |
|
1998/99 |
346 |
665 |
231 |
457 |
234 |
193 |
46.8 |
|
1999/00 |
324 |
632 |
228 |
466 |
287 |
243 |
51.8 |
|
2000/01 |
363 |
669 |
233 |
468 |
253 |
214 |
58.4 |
|
2001/02 |
392 |
710 |
267 |
518 |
279 |
234 |
61.4 |
|
2002/03 |
412 |
765 |
282 |
539 |
289 |
244 |
58.7 |
The retail prices of major fertilizer products during the last five years are given in Table 8. The main increase was in the DAP price due to a high price on the international market. The international price was around US$220/tonne f.o.b. in March 2004, and in consequence the domestic price reached Rs.1 000/bag of 50 kg.
As more fertilizer is applied, the additional quantity of crop yield produced with each successive unit of fertilizer becomes smaller, until a maximum yield is obtained. This is a result of the law of diminishing returns. Thus there is a point on the curve of the response of the crop to fertilizer application at which the additional use of fertilizer either produces no extra yield or may even have a Source: NFDC. negative effect. A farmer is interested in profitable returns rather than maximum returns. This implies that the maximum yield per ha does not always mean the highest profit because of greater cost of fertilizers.
An important criterion for the measurement of profitability is the value cost ratio (VCR). This is the ratio between the value of the additional crop yield and the cost of the additional fertilizer.
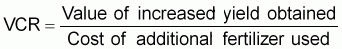
The VCR is the rate of return on the money spent on fertilizers. If the VCR is greater than one, fertilizer use is profitable. A VCR of 2 represents a 100 percent return on the money invested in fertilizer. In general a VCR of 2 ensures good return and takes account of the risk of bad weather and other external factors.
NFDC, in joint collaboration with FAO and the World Phosphate Institute (IMPHOS), has conducted a number of field trials/demonstrations on farmers’ fields in the 15 CPRs over the past seven years. A simple economic analysis has been done to show economic impact of balanced use of fertilizers on various crops. The VCR of the major crops in the CPRs is given in Table 9.
TABLE 9
VCRs of major crops in different
CPRs
|
No. |
CPR |
VCR |
|||||
|
Wheat |
Paddy |
Cotton |
Maize |
||||
|
Rainfed |
Irrigated |
Basmati |
IRRI |
||||
|
1. |
Punjab I |
|
3.3 |
|
|
4.1 |
|
|
2. |
Punjab II |
|
3.9 |
4.0 |
|
|
|
|
3. |
Punjab III |
|
4.0 |
7.0 |
|
|
|
|
4. |
Punjab IV |
4.0 |
|
|
|
|
3.4 |
|
5. |
Punjab V |
|
|
|
|
|
|
|
6. |
Sindh I |
|
3.8 |
|
2.5 |
|
11.0 |
|
7. |
Sindh II |
|
3.7 |
|
1.5 |
|
10.0 |
|
8. |
Sindh III |
|
3.6 |
|
3.3 |
|
|
|
9. |
NWFP I |
|
3.5 |
|
|
|
|
|
10. |
NWFP II |
3.0 |
3.7 |
|
|
|
3.5 |
|
11. |
NWFP III |
|
2.7 |
|
|
|
|
|
12. |
Balochistan I |
|
5.0 |
|
|
|
|
|
13. |
Balochistan II |
|
|
|
|
|
|
|
14. |
Balochistan III |
|
|
|
3.7 |
|
|
|
15. |
Balochistan IV |
|
|
|
|
|
|
Prices used: N = Rs.18/kg, P2O5 = Rs.32/kg, wheat = Rs.8.75/kg, cotton Rs.25/kg, Basmati rice Rs.11.50/kg, IRRI rice Rs.6/kg and maize Rs.11/kg.
The results show that fertilizer use remains profitable provided it is balanced (N, P2O5). However, the present application rates particularly of phosphate are low. Thus the present VCR obtained by farmers ranges between 2 to 3.
![]()
![]()
![]()