![]()
![]()
![]()
GUIDELINES TO STUDY SECTION II
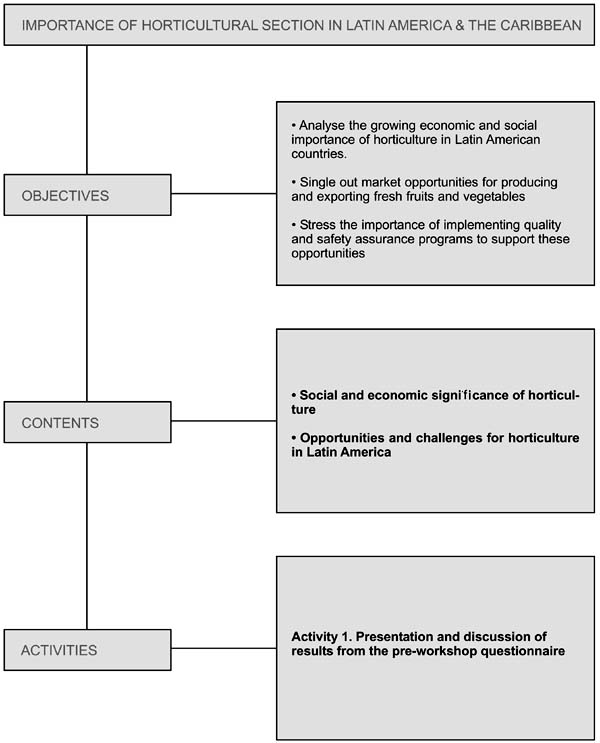
OBJECTIVES
Analyse the growing economic and social importance of horticulture in Latin American & Caribbean countries.
Single out market opportunities for producing and exporting fresh fruits and vegetables.
Stress the importance of implementing quality and safety assurance programs to support these opportunities.
TIME FRAME
2 hours
METHODOLOGY
Teamwork backed by discussions analysing the results of the preworkshop questionnaire and other documents distributed.
PLAN
The summarized replies from the pre-workshop questionnaire returned by the participants are introduced in a plenary session in relation to:
|
Section A. |
General information on participants and their institutions. |
|
Section B. |
Profile for each country’s horticultural sector. |
|
Section C. |
Current institutional situation, both public and private, to address safety and quality issues in horticulture. |
For Section A "Introducing the Participants", the participants will report on their institutional and personal role in the fresh fruits and vegetables quality and safety system by completing the appropriate worksheets supplied. This will facilitate understanding the complexities and relationships involved. For sections B and C, the trainer will briefly comment on some of the opportunities available in the markets for fresh produce, using Material 2.1 as a reading reference. Next, the participants grouped by country will identify possible contributions to implement quality and safety programmes in their countries to channel market opportunities. This exercise will use as reference material the summarized pre-workshop questionnaire and the institutional capacities available in each country.
EXPECTED RESULTS
By the end of this session, the participants will:
identify the economic and social importance of the horticultural sector in each country and its potential to modernize;
reference the trends and opportunities in fresh fruits and vegetables markets and identify challenges to overcome them for successfully channeling these opportunities;
define the importance of implementing quality and safety programmes as tools to profit from market openings.
TRAINING MATERIAL
|
Material 2.1 |
Worksheet: A simple horticultural chain model. |
|
Material 2.2 |
Reference reading: Opportunities and challenges for the Latin American horticultural sector. |
SECTION A. DEFINE THE PARTICIPANTS EXPECTATIONS
TIME FRAME
30 minutes
GUIDELINES FOR TRAINERS
Participants will be requested, in teams or individually, to:
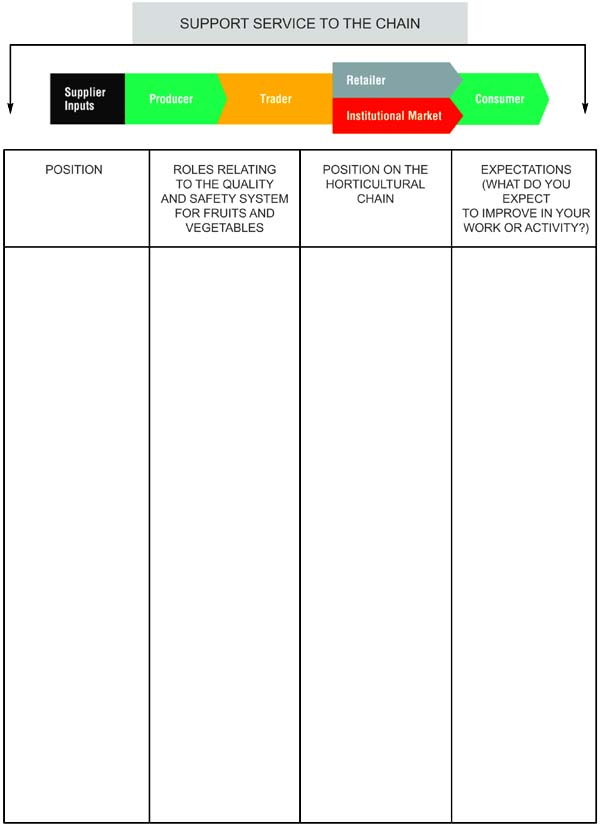
1. Define their role as different actors in the horticultural chain (Material 2.1);
2. Define relationships to the quality and safety system in the fresh fruits and vegetables production -marketing - consumption chain (responsibilities for work done, purpose, chain links involved, etc.);
3. Define the expectations and the improvements expected from an active involvement in the workshop.
ACTIVITIES
The trainer will distribute to each participant, who will play precise roles in the fresh fruits and vegetables chain, worksheets with Material 2.1. This will help to understand the complexities involved in the fruits and vegetables safety system and the need for integrated and multidisciplinary work. The trainer will clarify each person’s role as a citizen and as a consumer within the agro-industrial quality and safety system. Likewise, participants will be asked what is expected from the course, thereby allowing the trainer to direct the brainstorming sessions to achieve realistic results, with the general objectives in mind. On a rota folio the trainer will draw a simple model horticultural chain, showing the positions of each participant as an actor, to evidence the difficulties involved in the system.
SECTIONS B AND C. IMPORTANCE OF THE HORTICULTURAL SECTOR FOR EACH COUNTRY
TIME FRAME
75 minutes
GUIDELINES FOR TRAINERS
The trainer will open the session outlining "The opportunities for Latin American horticulture" and the results from sections B and C of the preworkshop questionnaire referring to general topics of each country’s horticultural sector, and commenting on the strengths and weaknesses detected by the participants for implementing quality and safety programs.
The trainer will request the participants, grouped by country, to answer the following questions:
How deeply is your institution involved in the quality and safety systems for fresh fruits and vegetables to potentiate opportunities?
How would implementing a program for quality assurance and safety contribute to channel produce to market openings? (For this analysis, generalities should be considered: e.g. land tenure, family agriculture, available facilities for transportation and storage, etc.).
To conclude, each team presents its results and the trainer summarizes the general conclusions.
The trainer will prepare this session by reading the reference material Opportunities and Challenges for the Latin American Horticultural Sector, Material 2.2, along with the results of the pre-workshop questionnaire completed by the participants.
MATERIAL 2.1. A SIMPLE HORTICULTURAL CHAIN MODEL
MATERIAL 2.2 REFERENCE READING FOR TRAINERS
"OPPORTUNITIES AND CHALLENGES FOR THE LATIN AMERICAN & CARIBBEAN HORTICULTURAL SECTOR"
- Supply trends
World production of fresh fruits and vegetables was estimated for 2002 in 1 244 million tonnes, with 772.7 tonnes regarding vegetables and 471.3 tonnes regarding fruits (FAOSTAT). In the last decades the overall rate of growth for vegetables has been more dynamic than for fruits, 5 percent compared to 2.38 percent. Latin America contributes 4.1 and 21 percent of the world production of vegetables and fruits, respectively.
Table 1 shows that fruits, such as pears, apples, mangos and papayas, have significantly increased production in the last ten years.
Table 1. Average Growth in Fruit Production
|
Product |
% World growth |
% Latin America growth |
|
Seasonal fruits |
||
|
Apples |
2.48 |
2.11 |
|
Grapes |
1.07 |
1.88 |
|
Pears |
5.41 |
5.72 |
|
Kiwi |
0.24 |
1.87 |
|
Peaches and Nectarines |
2.43 |
1.19 |
|
Tropical - Subtropical |
||
|
Citrus |
2.13 |
1.49 |
|
Mangos |
3.44 |
3.17 |
|
Pineapples |
1.90 |
4.31 |
|
Papayas |
4.76 |
7.28 |
|
Avocados |
2.30 |
1.94 |
Source: FAOSTAT. Period (1992-2002)
Latin America has a significant share in world production of four important tropical fruits: mango, pineapple, papaya and avocado. These represent an average of 75 percent of total production of tropical fruits and about 90 percent of exports of fresh produce. Latin America is also an important producer of citrus, as shown in Table 2.
For vegetables, Latin America had in the last decade an average growth rate of 3.57 percent, with significant increases in the production of tomatoes, asparagus, etc.
Table 2. Latin American share in world production of tropical fruits and citrus.
|
Product |
World |
Latin America |
% |
|
Mango |
22 739 891 |
3 118 390 |
14 |
|
Papaya |
4 863 045 |
2 284 222 |
47 |
|
Pineapple |
12 760 205 |
3 370 376 |
26 |
|
Citrus |
96 546 314 |
33 632 691 |
35 |
|
Avocado |
2 293 598 |
1 544 290 |
67 |
Source for calculations: FAOSTAT. Period (1992-2002)
Table 3. Average growth in the production of vegetables.
|
Product |
% World growth |
Latin American growth |
|
Tomatoes |
3.97 |
2.68 |
|
Onions |
2.97 |
5.49 |
|
Peppers |
3.06 |
2.08 |
|
Asparagus |
8.08 |
7.53 |
|
Garlic |
5.33 |
4.40 |
Source for calculations: FAOSTAT. Period (1992-2002)
On the other hand, production of fruits and vegetables in several Latin American countries involves rural and family agriculture, concentrating poverty significantly. It has a high geographic dispersion, fragmented land property, low productivity, small scales of production, low levels of technology, difficulties in access to credit, to markets and to information sources and, in general, articulates poorly with the end consumer.
Even if difficult to estimate, family subsistence horticulture, contributes significantly to food safety and to improving the nutritional conditions of rural populations in many developing countries. In Chile, according to INDAP (2000), family agriculture covers about 25 percent of farmland and 45 percent of production resources (44 percent annual crops, 45 percent vegetables, 29 percent fruits, 41 percent grapes, 42 percent cattle, 33 percent sheep, 63 percent goats and 48 percent swine). For Guatemala, the development of export horticulture has been based on small-scale agriculture, from an average 0.6 ha per farmer in 1979 to 5 ha in 1993 (ECLA, 1995). Horticulture’s contribution to employment in Latin American countries varies significantly with the production systems in use and the sector’s own impetus. In Brazil fresh horticulture is responsible for the direct employment of 4 million (INTERTEXTO, Pesquisa de Campo, 2000); in Guatemala in 1993, canning and processing provided work to 2 145 people in 35 different companies (CEPAL, 1995) this share becoming more relevant as the sector becomes more dynamic, both to supply domestic and export markets.
- Trends in consumption
The last decade has witnessed profound changes in agro-industrial systems associated with foods, with the consumer as the driving force behind food supplies. Among others, urbanization and demographic growth, out-of-the-house female employment, increased income and more educated consumers have contributed to shifting production from bulk marketing to more segmented and individualized patterns. This has resulted in developing new products, flexible offers and new opportunities for products with added-value, such as fresh vegetables and fruits.
A distinction needs to be made between: conditioning processes, made ready for use; saving time products (precuts, individual dishes, ready-to-cook and ready-to-eat); and transforming processes that result in products with longer shelf life and not requiring low conservation temperatures (mainly canned foods and chips). The market for these conditioning process products is far more dynamic due to consumer preferences for fresh convenience products nutritionally unaltered and healthful.
Fruits and vegetables, as a result of conditioning processes (storage, waxing, transportation, etc.), belong to these new and more dynamic products. In the USA consumption of baby carrots and ready-to-eat salads, has sharply increased in recent years (USDA, 2001).
Shifts in world trade of foods to products with more added-value, result in, among several other reasons, higher prices than for basic products[2] with a higher demand elasticity. Table 4, shows per capita increases in the offer of fruits and vegetables (a measure of consumption), with higher increases for higher income countries.
Fruits and vegetables result from processes involving multiple and sequential investments in order to supply production on time, in form and place as required by the consumer (implying specialized transport and packaging, conservation, taxes and insurance, promotion, marketing profits, etc). Technological advances in transportation, for example, result in increased consumption.
World Supply of Fruits and Vegetables Kg/per capita/year
|
Countries |
1961 |
1965 |
1970 |
1975 |
1980 |
1990 |
1995 |
1998 |
|
Low Income |
78 |
78 |
79 |
81 |
80 |
81 |
86 |
86 |
|
Medium Income |
120 |
127 |
132 |
140 |
154 |
161 |
164 |
170 |
|
High Income |
147 |
156 |
178 |
184 |
193 |
214 |
222 |
223 |
Source: FAO (From: Changing Structure of Global Food Consumption and Trade, USDA, 2001)
- Importing markets
Consumer’s trends in major importing markets, favors "innovative, different, convenient and healthy diet products". In the USA, in 1997-1999, intake per capita of fruits and vegetables was 25 percent higher than in 1977-1979. From the mid-1970s, USA consumers have purchased less canned fruits and vegetables and more fresh products. Oranges, apples, grapes and bananas lead in fruits while potatoes, tomatoes, melons, carrots and lettuce are the vegetables most in demand (USDA, 2001).
In the USA market imports account for 14 percent of domestic consumption of fruits and vegetables (excluding bananas). Developed countries import 80 percent of fresh tropical fruits. It is expected that Europe will continue to be the largest importer, with 47 percent of imports for 2005. North America will remain as the second largest importing market, with increased imports of pineapples, mangos and papaya. The average annual growth for these products is expected to be 3.0-4.5 percent (FAO, 2002).
For products facing more competitive markets such as citrus and seasonal fruits opportunities for developing countries centre on increased productivity, continuous discovery of market opportunities, research and advances in agronomical research, pest control, post-harvest technology, handling and storage. Adequate balances will allow for continuous growth in production.
Markets for organic fruits offer additional opportunities to developing countries. Annual rate of sales for these products has increased by 20 30 percent in the last decade, with leading figures for the United States, Germany, the United Kingdom and Italy (FAO, 2002).
As long as income keeps increasing in developed countries, demand for fruits and vegetables will also increase. Globalization and associated changes in lifestyles, point to increased demands in developing countries, along the lines in the developed world. Availability, convenience and health demands will probably influence worldwide intake of fruits and vegetables in the future (Pollack, 2001-USDA).
- Latin American export markets
For many developing countries, exports of fruits and vegetables contribute significantly to earnings in hard currency. For Latin America, exports of fruits and vegetables increased in the last ten years by 4.54 percent. Graphic 1 shows countries with increases in exports higher than 8 percent in the last decade.
As an example, Brazil, INTERTEXTO - Pesquisa de Campo (2000), shows increased fresh fruits exports from US$120 million to US$214.6 million in 1998-2001. In Mexico, 63 percent of agricultural exports are from horticulture (SAGAR, 2002). Chile is the first world exporter of table grapes and pears, second in apples and kiwi and fourth in peaches (ODEPA, 2000). These figures (reported by SENA, 2002) point to very interesting export dynamics in several Latin American countries struggling to profit from open opportunities in importing markets.
- Changes in distribution systems
The new dynamism of trade in fruits and vegetables in the 1990s, resulted in significant adjustments in distribution systems, concentrating both suppliers and retailers.
According to Reardon (2002), in Latin America the supermarket revolution took only 10 years compared with 60 in the USA. This has been a massive expansion, reaching consumers everywhere, in large cities as well as in small populations. The concentration of retail trade, both in developed and developing countries, is continually increasing, as exemplified by the market share of the four larger chains in the USA, which increased their market share from 15 percent in 1992 to 25 percent in 1999.
Supermarkets keep increasing their percentage in distribution of fresh foods. In Latin America, in less that a decade, supermarkets account for 30 percent of the market for fruits and vegetables in Argentina and Mexico and for 50 percent of the retail market in Brazil. Chilean supermarkets contribute only 38 percent of the retail market for fruits and vegetables.
Graphic 1. Export growing rates for some Latin American & Caribbean countries
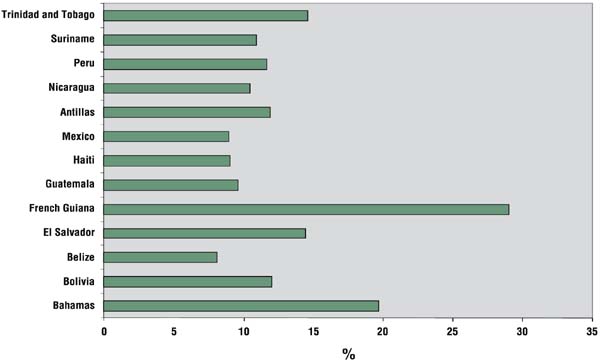
Source for calculations FAOSTAT (1992-2002)
Supermarkets continue increasing their percentage in distribution of fresh foods. In Latin America, in less that a decade, supermarkets account for 30 percent of the market for fruits and vegetables in Argentina and Mexico and for 50 percent of the retail market in Brazil. Chilean supermarkets contribute only 3-8 percent of the retail market for fruits and vegetables. According to Reardon and Berdegue (2002), supermarkets control 42 percent (on a weighed average basis) of the retail market for fruits and vegetables. Twenty years ago this was less than 5 percent.
This concentration entails more demanding requirements in quality, safety, nutritional values, packaging, volume and changes in the price quality ratio while new coordination and communication practices are at work between supermarkets and suppliers, reducing the role traditionally played by intermediate traders.
Likewise, the growth in specialized supermarkets opens good opportunities for more specialized offers and for regional markets. Reardon and Berdegue (2002) showed that, for the 12 countries studied, Latin American has a US$24 billion market for fresh fruits and vegetables. Total exports, excluding bananas, round US$8.2 billion making the specialized markets two or three times larger than the fruits and vegetables market. To conclude, there are good opportunities in the large importing markets as well as in the regional domestic markets.
- Afterthoughts
The dynamic demands in horticultural trade are expected to result in:
development and modernization of the productive sector to meet the requirements in quality, varieties, volume, delivery, etc., required by local specialized markets and by export markets;
strengthening the relationship between producers and traders.
On this second point, (Díaz, 1999) shows evidence that in horticultural markets, preference is given to medium-sized suppliers, with consistent capacity to deliver produce, with lower transaction costs and less risks. The following question regarding fruits and vegetables production systems in Latin America is worth considering:
Are these producers and traders ready to remain competitive in these highly demanding, differentiated, dynamic, regulated and competitive markets, where not only quality attributes count (nutritional value, texture, appearance, etc.), but also safety assurance, and a continuous concern for the production systems involved, the post-harvest handling, the processing procedures, the environment and ethical issues?
REFERENCE DOCUMENTS
ECFLA. 1995. Agroindustrial relations and transformation of agriculture. Economic Commission for Latin America and the Caribbean. ECFLA. Santiago de Chile. Octubre de 1995.
Coyle, W. & Gehlhar, M. 2001. Global food consumption and impacts on trade patterns. Chapter 1. Changing Structure of Global Food Consumption and Trade. Economic Research Service. U.S. Department of Agriculture, Agriculture and Trade Report. WRS-01-1.
Díaz, L.B. 1999. Paquete de Capacitación Contratos y Otras Formas de Concertación en Frutas y Hortalizas. Convenio SENA-Reino Unido. Armenia, Colombia, 1999.
Echnove, F. 2001. Working under contract for the vegetable agroindustry in Mexico: A means of survival. Culture & Agriculture. Volumen 23, N 3. 2001.
FAOSTAT. Agriculture
data.
http://apps.fao.org/page/collections?subset=agriculture
FAO (2002). Tropical Fruits Projections to
2010.
http://www.fao.org/es/ESC/escs/escr/tropfruits/PARTEV-frutast.pdf
FAO/ITC/CTA. 2001. World markets for organic fruit and
vegetables opportunities for developing countries in the production and export
of organic horticultural
products.
http://www.fao.org/docrep/004/y1669e/y1669e00.htm
OECD. 1996. Export fruit boom from the South: A threat for the North?. Organization for Cooperation and Economic Development. OECD. Paris. 1996.
Pollack, S. 2001. Consumer demand for fruit and vegetables: The U.S. example. Chapter 6, Changing Structure of Global Food Consumption and Trade. Economic Research Service. U.S. Department of Agriculture, Agriculture and Trade Report. WRS-01-1.
Reardon, T. & Berdegue, J. 2002. The rapid rise of supermarkets in Latin America: Challenges and opportunities for development. Development Policy Review (4), September 2002. Department for International Development. DFID. United Kingdom. 2002.
Reardon, T. et al. 2003. Supermarkets and produce quality and safety standards in Latin America. Forthcoming, 2003. American Journal of Economics, 85 (5) December. Personnal Comunication - Thomas Rear-don.
SENA. 2002. Memorias IV Simposio Internacional de Competitividad en Frutas y Hortalizas: La Cadena de Valor, ¿Cómo Participar?. Servicio Nacional de Aprendizaje, SENA, Colombia. Bogotá, Septiembre, 2002.
|
[2] While exports of fresh
fruits and vegetables increased in value on an average of 2.47 percent and in
volume by 2.98 percent in the last decade, exports of cereals decreased by 0.57
percent in value and by 1.23 percent in volume. (FAOSTAT). |
![]()
![]()
![]()