![]()
![]()
![]()
C. Calpe
Basic Foodstuffs Service, FAO, Rome,
Italy
RICE PRODUCTION
Global paddy production likely to reach a new high in 2004, but forecast still highly tentative The FAO forecast for global paddy production in 2004 was raised marginally to an all-time high of 613 million tonnes, almost 21 million tonnes more than in 2003. The figure is still highly tentative, since most Northern Hemisphere countries (accounting for the bulk of world production) are in the process of planting their main crops at the time of writing. In the Southern Hemisphere and along the equatorial belt, however, harvesting of the 2004 main paddy crops is virtually complete, with excellent results generally reported.
Asia
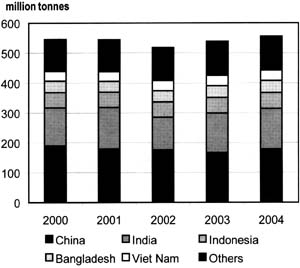
Favourable outlook for 2004 paddy crops in most of Asia Since several Asian countries in the Northern Hemisphere are still gathering their 2003 secondary crops, production in 2003 remains subject to revision at the time of writing. The latest estimates reveal that paddy output in the region recovered strongly last season from the weather-induced setbacks that had depressed the sector in 2002. Although based on still highly tentative forecasts, further growth in output is anticipated in 2004, with all the major producers in the region heading towards bumper crops.
Bangladesh's official estimate of output in 2003 was raised to an all-time record of 39.9 million tonnes, despite severe floods in the northeast regions which caused a loss of 200 000 ha just a few weeks before the start of the boro crop harvest. The positive production performance was partly the result of government support towards increasing yields through improved input distribution. A further increase in production is projected to take place in 2004, especially if the Government confirms the stepping up of subsidies for fertilizer and seeds.
Cambodia also achieved a record output in 2003, following an excellent wet season crop. In 2004, a decline from that exceptional performance is anticipated, as yields fall to more normal levels (see Table 1).
FIGURE 1
Global rice paddy production and
area
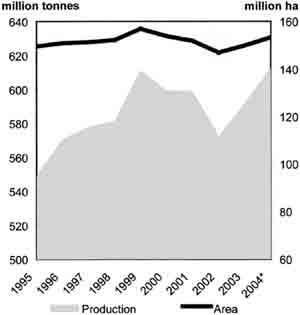
* Forecast.
After 4 years of steady contraction, output in mainland China is set to rebound by 7 percent (compared with 2003) to 177.2 million tonnes (i.e. unchanged from the previous forecast). The increase should be triggered by attractive market prices, but also by the Government's new support policies, which include the following:
the re-introduction of protective prices for early and late rice crops (¥1 400 [US$169] and ¥1 500 [US$181] per tonne, respectively);
the designation of specialized grain areas; and
a reduction of fiscal pressure on farmers.
The Government also allocated some ¥10 billion (US$1.2 billion) to finance direct income payments to grain farmers in 13 provinces, including Heilongjiang, Jilin and Henan, the three most important among the designated grain production bases. Launched on an experimental basis in Anhui Province over the last 2 years, about US$36 per hectare have been transferred as direct payments to farmers benefiting from the scheme.
TABLE 1
Cambodia - Rice paddy production by crop season
('000 tonnes)
|
|
1996/97 |
1997/98 |
1998/99 |
1999/00 |
2000/01 |
2001/02 |
2002/03 |
2003/04 |
|
Wet season |
2 733.0 |
2 672.6 |
2 873.9 |
3 332.9 |
3 212.3 |
3 276.0 |
2 915.9 |
3 838.0 |
|
Dry season |
657.0 |
742.3 |
636.0 |
708.0 |
813.8 |
823.1 |
906.6 |
873.0 |
|
Total |
3 390.0 |
3 414.9 |
3 509.9 |
4 040.9 |
4 026.1 |
4 099.1 |
3 822.5 |
4 711.0 |
Source: Ministry of Agriculture, Forestry and Fisheries (MAFF), Cambodia.
By contrast, paddy production is expected to decline by about 100 000 tonnes in Taiwan Province of China, due to the severe drought that has affected the southern areas of the island.
In India, planting of the main kharif crop has already begun in the south, since the monsoon rains due to arrive on 31 May or 1 June actually reached the country 2 weeks early. Assuming a normal rainfall distribution in the coming months, production in 2004 could reach 136 million tonnes, up 3 percent from last year. On the policy front, the recently elected Government has announced the launch of crucial reforms to its agricultural sector, with the pledge to improve farmer incomes and to liberalize the marketing of agricultural products.
In Indonesia, the bulk of the 2004 main crop, which has benefited from excellent growing conditions, has already been harvested. Based on this positive outcome, the country is set to achieve the government production target of 53.1 million tonnes (i.e. 2 percent more than last year). Early in May, the Government announced it had allocated Rp1.3 trillion (US$149.4 million) to subsidize fertilizers to small farmers; as a result, urea retail prices should remain at a low Rp1 050 (US$0.11) per kg.
Following the 2003 production shortfall, Japan is expected to record a partial recovery to 10.7 million tonnes in 2004, assuming that normal weather conditions prevail. The country is proceeding along the path of gradually reducing rice output. This year, the rice production adjustment programme will be based on an output target set prefecture by prefecture, rather than on area diversion targets (as in the past).
Production is expected to recover in the Republic of Korea from the setback experienced last year. The rise is anticipated to stem from a rebounding of yields, while plantings may be discouraged by the reduction in the official procurement prices decided by the Government.
In the Philippines, the recent reports of damage to paddy crops from Typhoon Nida in May could lead to a downward revision of output for the 2003 season (July 2003-June 2004). Nonetheless, the country is still estimated to have harvested a bumper crop last season, reflecting the rehabilitation of irrigated production systems, an extension of plantings to fallow or rainfed lands and the increased use of hybrid rice seeds. As for the 2004 season (about to begin), production in the country is expected to keep rising despite prospects of drought-induced delays in planting, mainly because of continued strong support from the Government. In addition to the hybrid seed distribution programme, the National Food Agency (NFA) recently launched a new procurement strategy aimed at sustaining prices to farmers and encouraging them to market a larger share of their output, by sending mobile procurement teams to distant areas. Procurement prices over the summer crop were reported to have been set at P20 000 (US$360) per tonne. Farmers drying their own rice and transporting it to the NFA warehouses would be eligible to a supplementary payment of P1 50 (US$27) per tonne for drying and P1 00 (US$18) per tonne for transportation.
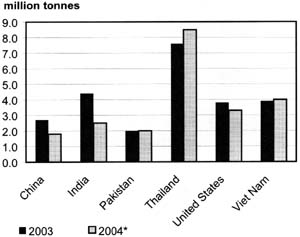
FIGURE 2
Rice paddy production in Asia,
2000-04
High prices are also expected to boost rice production in Pakistan, which should start gathering its main harvest in September. Production in 2004 is currently forecast at 7.6 million tonnes, up from 7.3 million tonnes last year.
TABLE 2
Sri Lanka - Rice paddy production by crop season
('000 tonnes)
|
|
1997/98 |
1998/99 |
1999/00 |
2000/01 |
2001/02 |
2002/03 |
2003/04 |
2004/05 |
|
Maha |
1 457 |
1 781 |
1 736 |
1 781 |
1 613 |
1 774 |
1 895 |
1 635 |
|
Yala |
782 |
911 |
1 121 |
1 079 |
1 082 |
1 086 |
1 174 |
875 |
|
Total |
2 239 |
2 692 |
2 857 |
2 860 |
2 695 |
2 860 |
3 069 |
2 510 |
Source: Dept. of Census and Statistics, Sri Lanka; FAO/WFP Crop Assessment Mission, Sri Lanka (7-26 March 2004).
By contrast, in Sri Lanka, paddy production this season may dip significantly, as low and erratic rainfall has severely impaired the main maha crop, and may also hinder the second, irrigated, yala crop (currently at the planting stage), by impeding the replenishment of reservoirs. Considering both crops, total output is anticipated to be in the order of 2.5 million tonnes (i.e. 18 percent below the previous year's level) (see Table 2).
Drought in Thailand during the first 3 months of the year had a negative impact on the 2003 second paddy crop, especially after the Government appealed to farmers in the affected areas to suspend planting to save water. With the arrival of the rains in May, the 2004 paddy season has just begun. A smaller increase in output than originally anticipated is currently foreseen, based on predictions of less than optimal weather conditions in the ongoing wet season. Production in the country is now set to reach 27 million tonnes in 2004 (2 percent up from last year).
In Viet Nam, the gathering of the winter/spring paddy crop - the first of the three crops to be harvested in 2004 - has been completed with good results. Overall, however, the Government is forecasting a smaller output during the 2004 season, as the positive impact of higher rice prices on plantings could be dampened by sharp increases in input costs, especially fertilizers and fuel. The official forecast of production in 2004 stands at 34.2 million tonnes (300 000 tonnes less than in the previous year) with part of the decline arising from a diversification out of rice into shrimps or other crops.
In Central Asia, the Government of Turkmenistan recently released the production estimates for the 2003 season: 109 500 tonnes (i.e. 37 percent more than in 2002). For the forthcoming 2004 season, the country is aiming at a 55 percent increase to 170 000 tonnes, in line with the government plans to boost rice production to 250 000 tonnes by 2010. To this end, new land for rice cultivation has been made available in the major rice-producing provinces of Doshoguz and Lebap. In addition, farmers willing to join the programme are guaranteed: a minimum purchase price for the rice produced; quality seed; and credit at preferential interest rates. The increase in output was even more pronounced in Uzbekistan, where it rose by 68 percent to 311 200 tonnes in 2003. Further gains are anticipated in 2004.
AFRICA
Little change in output currently anticipated in 2004
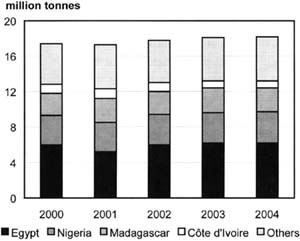
While the 2004 paddy season is virtually over in most southern African countries, crops in Egypt and western Africa are at an early stage of development, with some countries still seeding their crops. For the Africa region overall, rice production in 2004 is tentatively forecast at 18.2 million tonnes, marginally higher than 2003.
In the northern region, production in Egypt is forecast at a high 6.2 million tonnes, little changed from last year's record level. Domestic prices have been rising lately, despite the relatively large crop reaped in 2003, partly reflecting a strong demand for export.
In western Africa, most of the countries are expected to record some increase in production in 2004, fostered by reduced competition from higher priced imports. In Mauritania, however, attacks from stalk borers are endangering prospects, particularly those of the walo crop. As a result, 2004 production might fall short by 11 percent of the level achieved in 2003.
FIGURE 3
Rice paddy production in Africa,
2000-04
Following an FAO/WFP (World Food Programme) mission, output estimates in Côte d'Ivoire have been upwardly revised since 2002, suggesting that the impact of internal conflict on paddy production is much less than estimated. The country has been assessed to have harvested around 850 000 tonnes in 2003, a level that might be matched this season (i.e. an 18 percent fall since 2000).
Production is projected to increase by 3 percent in Nigeria, reaching 3.5 million tonnes. Despite excellent weather last season, fertilizer shortages meant that only a modest increase in production was achieved. Last May, however, the Government renewed its commitment to reach rice self-sufficiency by 2005 and to produce surpluses for export by 2007. To boost production, 2 tonnes of NERICA (New Rice for Africa) foundation seed have been procured from The Africa Rice Center (WARDA) for multiplication and distribution.
In southern Africa, production is expected to decrease in Madagascar compared to last year's bumper level, reflecting the effects of the cyclones, Elita and Gafilo, which hit the country in January and February. The cyclone also battered the northeast region of Antalaha, one of the most important rice-producing districts.
The late arrival of rainfall in Mozambique deferred planting by 2 months, from October to January, and damaged rice in some districts, such as Zambesia. Problems were again faced in March, when heavy rains resulted in flood damage. As a result, the country is anticipated to experience a 10 percent production shortfall in 2004.
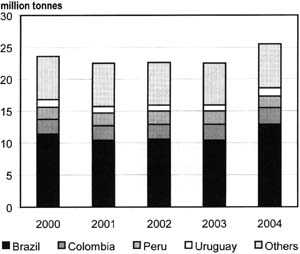
FIGURE 4
Rice paddy production in Latin America,
2000-04
Latin America and the Caribbean
Good crops harvested in South America, but prospects remain uncertain in Central America and the Caribbean
While the season is virtually over in most of South America, planting of paddy crops is progressing across Central America and the Caribbean. In South America, most countries are reporting sizeable production gains, as rising prices have stimulated expansion of the rice-producing area, while generally favourable growing conditions have boosted yields.
In Argentina, the official production estimate has been raised to 990 000 tonnes - the highest level since 1999 and 38 percent more than in 2003 - reflecting an expansion in both area and yields.
In Brazil, the production forecast by CONAB (Companhia Nacional de Abastecimento) was upwardly revised to an all-time high of 12.9 million tonnes (a 24 percent increase compared with last year's depressed level). The outcome would have been even more positive without the cyclone that hit Santa Catarina, the third major rice-producing state, just before harvest, where it caused a 4 percent reduction in local yields, offsetting much of the gains arising from a 7 percent increase in plantings.
Uruguay is also poised to reap a record crop, mostly on account of exceptional yields, which are set to reach 6.75 tonnes of paddy per hectare.
Recent rains were reported to have brought relief to rice crops in Paraguay, the development of which had been hindered by insufficient precipitation.
In Colombia, cold weather in April caused some delays in the start of the winter crop. Nonetheless, production is expected to increase by 2 percent over last year's level, reaching the all time high of 2.6 million tonnes in 2004, following an increase in plantings driven by relatively high prices since mid-2003.
By contrast, excessive rainfall in Ecuador is reported to have caused losses of up to 20 percent in the affected areas. As a result, production this year is anticipated to fall to 1.15 million tonnes, 7 percent down on last year and 150 000 tonnes less than previously forecast.
In Guyana, the outlook for the main crop, currently at the harvest stage, has also deteriorated due to persistent precipitation and floods in the Berbice area, which may result in a 100 000-tonne shortfall this season, bringing production down to 2000 levels.
In Peru, severe drought problems in Lambayeque have marred output prospects; production is forecast to drop by 15 percent to 1.8 million tonnes.
Although production in Venezuela is expected to rise in 2004, prospects have been downgraded because of lack of rainfall in Guarico, the country's main irrigated rice-producing area.
In Central America and the Caribbean, planting of the main paddy crops is about to be concluded. Production is projected to increase in Cuba to some 750 000 tonnes (up 5 percent on the previous year), despite reports of drought problems in April when planting for the wet season starts. The rise would be on account of an expansion in rice produced on small private plots, promoted in the past few years under the "People's Rice" programme. Similarly, in Mexico, rice output is expected to grow by 2.5 percent, to 250 000 tonnes - significantly below the late 1990s level. By contrast, in Haiti and the Dominican Republic, torrential rains and flooding in May are estimated to have caused considerable crop damage. The season's prospects in the two countries had already been flawed by drought problems in earlier months. As a result, the 2004 production forecast of the two countries has been reassessed downwards. In the case of the Dominican Republic, production is now forecast to fall by almost 10 percent compared with last year: to 580 000 tonnes (100 000 tonnes less than previously forecast).
FIGURE 5
Cuba: rice production and imports (milled
equivalent)
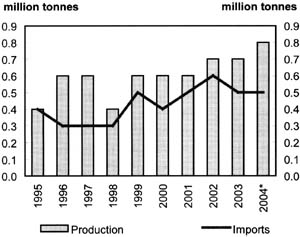
* Forecast.
Other countries
Favourable outlook for 2004 seasons in the United States of America and the European Union, but output still well below normal levels in Australia
The season is well underway in the United States of America, with 94 percent of the rice area reportedly planted by the end of May, well ahead of last year. The official forecast for this season's production has been raised marginally to 9.9 million tonnes (10 percent above the 2003 level) due to increases in both area and yields.
Production in an enlarged European Union (EU) will not differ much from the level achieved before the accession of the ten new members since, of these, only Hungary has a paddy sector of some relevance, yielding about 10 000 tonnes per year. In the EU-15 producing countries, official information points to a 1 percent output increase which, based on planting intentions, is projected to take place mostly in Spain and Greece. For the whole of EU-25, output is forecast to be some 40 000 tonnes greater than the level achieved in EU-15 in 2003.[2]
Despite a poor start to the season, Australia harvested a much higher crop in 2004. Yet, pegged at 600 000 tonnes, production did not fully recover from last year's drought-induced shortfall and remained at less than half the level harvested in 2002, again reflecting insufficient water allocations.
INTERNATIONALTRADE IN RICE
International trade in rice set to fall in 2004, a reflection of tight export supplies
The forecast of international trade in rice in the 2004 calendar year, which is largely influenced by the outcome of production in the 2003 season, has been raised by 200 000 tonnes from the previous outlook and now stands at 25.7 million tonnes (2.3 million tonnes less than in 2003). Most of the revision for the current year's trade reflects upward adjustments of exports by mainland China and the United States of America, while from the import angle, it follows from higher forecast deliveries to the Philippines, the Islamic Republic of Iran, Iraq and Mozambique, which have more than offset reductions for Bangladesh, mainland China and Indonesia.
Compared with last year's near-record volume, the fall in trade in 2004 reflects mainly a tightening of export supplies, although some major importers also appear to have retrenched from the market following good harvests in the preceding or ongoing seasons.
Exports
Reduced supply availability and existing export restrictions in India and Myanmar expected to constrain rice trade in 2004
According to current prospects, China (mainland) is anticipated to deliver 1.7 million tonnes (down from last year's 2.6 million tonnes), reflecting a surge in domestic prices. The export forecast, which is still highly tentative, assumes that the pace of shipments will slow down in the coming months compared with the first quarter, when the country managed to post a 24 percent increase in exports compared with the same period in 2003.
Based on official USDA (United States Department of Agriculture) forecasts, the outlook for exports by the United States of America has been upgraded to 3.3 million tonnes, due mainly to an increase in the sales of long grain varieties. Despite the revision, the expected volume in 2004 is still 500 000 tonnes less than lastyear's record performance.
As for Myanmar, which has imposed an export ban until June, it is now anticipated to ship a mere 300 000 tonnes - down from a previous outlook of 5 00 000 tonnes - as there has been no sign that the Government intends to resume trade. Most of the other countries' export forecasts remain unchanged from the last assessment.
FIGURE 6
Rice exports by the major exporters (milled
equivalent)
* Forecast.
In 2004, sales by India are forecast at 2.5 million tonnes (almost 2 million tonnes less than in 2003), based on expectations that the export restrictions imposed to help rebuild rice reserves are to be revoked in the second half of the year. However, even that volume might not be achieved, should the lifting of the ban be further delayed. Despite the surge in international rice prices, the resumption of exports also appears to depend on the granting of subsidies, which in the past 3 years have been provided to exporters by the Food Corporation of India (FCI) through the sale of rice held in its warehouses at prices below market levels and the payment of domestic transport costs and ocean freights. The decision about whether and how the subsidies will be communicated to exporters once the ban is rescinded is subject to high uncertainty, especially following the decision in 2004 to let exporters purchase rice directly from the market rather than through the FCI.
Exports by Japan and the Republic of Korea are set to halve, consistent with the production shortfalls faced by the two countries in 2003.
Pakistan is unlikely to have sufficient supplies to sustain a sizeable increase in shipments this year and exports are projected to remain in the order of 2 million tonnes.
By contrast, sales by Thailand are expected to rise substantially, sustained by buoyant demand and the recent tendering of 2 million tonnes of old rice from government stocks to exporters, which has eased supply scarcity problems. The Government has also announced the possibility of sourcing 1.5 million tonnes of rice supplies in neighbouring countries to help meet its export commitments. So far, however, there has been no confirmation of such trade. Between January and April, the country shipped 2.9 million tonnes of rice, 34 percent above the level recorded in the same period in 2003. For the year as a whole, exports are projected to meet the 8.5 million-tonne official target, up from 7.6 million tonnes in 2003 and an all-time high.
Larger exports from Viet Nam are also forecast, although rice scarcity is likely to limit the extent of the increase to 3 percent, reaching a volume of 4 million tonnes. Recently, the Government announced it would facilitate rice trade, through the provision of information services and promotion of high quality rice production for export. The Government is also considering liberalizing rice exports by authorizing all traders, including non-licensed rice exporters, to engage in rice trade. The move also reflects government concern over the signing of contracts by major domestic rice-exporting firms in previous months, at prices that now appear rather low.
The forecast for exports by Egypt also points to an increase, partly fuelled by a weakening of the domestic currency vis-à-vis the US dollar and stronger international prices. Prospects, however, might be impaired by import restrictions in Turkey where the Government has been reported to have delayed the issuance of import licences.
Bumper harvests in Argentina and Uruguay should also bolster exports from the MERCOSUR (Southern Common Market) area.
Imports
Higher prices and a tightening of import barriers likely to hinder imports in 2004
One of the most important changes in rice trade concerns China (mainland), which gained the headlines in the past few months when Chinese traders were reported actively buying rice from neighbouring countries, particularly Thailand and Viet Nam. This frenzy of buying was triggered by the surge in China's market prices - between February 2003 and February 2004, prices rose by around 63 percent for early rice and 54 percent for japonica rice. In the case of early indica rice, the increase was particularly manifest in the southern provinces, with wholesale prices peaking in March at ¥2 560 (US$310) per tonne. Several local governments reacted to the spree by releasing old crop supplies from state-owned inventories to relieve pressure on prices, therefore dampening the incentive to import. As a result, the earlier forecast for purchases by the country has been lowered to 800 000 tonnes, nevertheless a threefold increase on last year.
Following a further upward revision in last season's production, imports by Bangladesh were also cut by one-third to 400 000 tonnes, down from last year's 1.6 million tonnes. The new forecast reflects much higher world prices and the export ban imposed by India (Bangladesh's traditional supplier).
Improved production prospects in Indonesia have also caused a 500 000-tonne downward revision of the country's imports to 1.5 million tonnes (i.e. only half the volume taken by the country in 2003). The fall in imports is also the result of a strict enforcement of the import restrictions, planned to last until 1 June 2004. However, in May, the Government announced a 1-month extension of the ban until July and the decision to reassess its permanence or elimination month by month.
The official import forecast by the Republic of Korea remains 228 000 tonnes, up from 200 000 tonnes in 2003. Since the World Trade Organization (WTO) special treatment derogation that allowed the country to maintain quantitative restrictions on rice imports[3] is to expire at the end of the year, the Government of the Republic of Korea has begun negotiating the terms of the opening of its rice market with interested WTO members (Argentina, Australia, Canada, China [mainland], Egypt, India, Pakistan, Thailand and the United States of America). The process should be completed before the end of the year.
Forecast deliveries to the Philippines have been raised to 950 000 tonnes, close to last year's level, reflecting the high level of purchases already committed this year by the National Food Agency and the announcement that the unused portion of the 310 000-tonne annual import rights allocated to farmers will be covered by the National Food Agency or private traders. Under the WTO agreement, the country is entitled to maintain quantitative restrictions on rice imports until 30 June 2005. Thus, like the Republic of Korea, the Philippines has embarked on negotiations to define the terms of the opening of its rice market and has already announced its wish to negotiate an extension of the WTO special treatment, which would allow the country to keep rice imports under government control.
FIGURE 7
Rice imports by region, 2003 and 2004 (milled
equivalent)
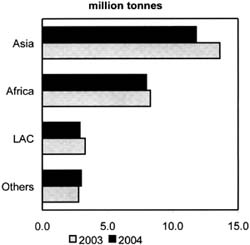
Note: LAC = Latin America and Caribbean Region.
Following confirmation of the 2004 production shortfall, Sri Lanka's imports have been revised upwards to 190 000 tonnes, part of which could be made under emergency relief shipments.
FAO forecasts of imports by Iraq and the Islamic Republic of Iran were also raised to 700 000 tonnes and 1.2 million tonnes, respectively, while retained imports[4] by Saudi Arabia were officially set at 865 000 tonnes this year, up from 813 000 tonnes in 2003.
Overall, rice imports to African countries are anticipated to fall somewhat compared with last year. Much of the decline would be on account of Nigeria, where shipments might drop from 1.5 to 1.3 million tonnes, since the country is reported to have tightened its controls against illegal rice inflows. Higher world prices could also prompt a decline in imports from Kenya, Senegal, South Africa and Tanzania.
By contrast, following a revision of recent years' figures, imports by Côte d'Ivoire are set to rise by some 15 percent to around 900 000 tonnes, as an outcome of the shortfall in the domestic crop. Official import forecasts in Mozambique point also to an annual 5 percent increase to 252 000 tonnes.
The Government of Egypt has announced the possibility of the country purchasing 100 000 tonnes of rice this year, a move that coincides with the announcement in May of a cut in rice import duty from 20 percent to 1 percent, following the rise of domestic prices.
In Latin America and the Caribbean, smaller overall imports are forecast compared to last year, with some increase in shipments to the Dominican Republic and Peru. Such increases will more than offset the expected retrenchment of Brazil, following the increased availability in this country.
In the rest of the world, purchases by the United States of America are projected to remain close to last year's level.
In the European Union, a revision of the trade statistics has been undertaken to take account of the enlargement of the EU to include ten new members. Since, for statistical purposes, the EU is considered a single "country", adjustments have been made to exclude what will be assessed as intratrade among the 25 EU members (and therefore excluded from the international trade aggregate) from May 2004 onwards. As a result of such adjustments, EU-25 rice imports were estimated in the order of 880 000 tonnes in 2004, up from 674 000 tonnes in 2003 for EU-15.
As of 1 September 2004, a new rice policy regime is to be implemented in all EU member countries, which will entail a 50 percent cut in the intervention price to 150 (US$178) per tonne. The reduced intervention prices will lead to much lower import duties since, based on the 1994 Uruguay Round Agreement, the duty-paid import price cannot exceed by more than a given percentage the EU intervention price.[5] The cut in the standard duties will erode the benefits of those exporters to the EU that enjoyed preferential access agreements and were subject to reduced import tariffs. To address those issues, the EU is in the process of negotiating new rice access arrangements under Article 28 of the WTO Agreement. Among the affected countries are Pakistan and India, whose exports of Basmati rice to the EU benefited from a 250-per-tonne duty abatement. This concession was withdrawn as of 31 March 2004 on imports of hybrid Basmati varieties, including "Pusa" rice from India and "Super Basmati" from Pakistan.
RICE STOCKS
Stocks set to fall by 11 percent at the end of 2003/04 - another contraction anticipated by the end of 2004/05
The estimate of world rice inventories at the close of the
2003/04 marketing season has been revised upwards from
101.7 to 103.4 million
tonnes, which would still mean an annual contraction of 11 percent from the
previous year and the fourth in a row of yearly declines. To a large extent, the
changes sprang from new estimates for Indonesia, following an upward revision in
the official 2003 production estimate. Following several adjustments to the
pattern of rice utilization in mainland China, the level of the country's
stocks at the end of the 2003 season has been lowered somewhat to 61 million
tonnes, a 12 to 13 million-tonne drop from the previous year, reflecting the
need for the country to draw further from its reserves to meet consumption
requirements. This was recently confirmed by the auctioning of 1.01 million
tonnes by the government of the Heilongjiang Northern Province last March to
ease pressure on prices. The Government of Thailand also launched a
tender to sell 1.7 million tonnes from inventories built up under its
intervention purchases in 2001, 2002 and 2003. Overall, rising exports from the
country should result in lower carryovers at the end of the 2003 season, unless
imports of rice from the neighbouring Lao People's Democratic Republic, Cambodia
and Myanmar are actually made. Among the other major exporters, rice inventories
are forecast to close at lower levels in the United States of America,
while export restrictions should help India and Myanmar to
rebuild their reserves somewhat.
FIGURE 8
Côte d'Ivoire: rice production and
imports (milled equivalent)
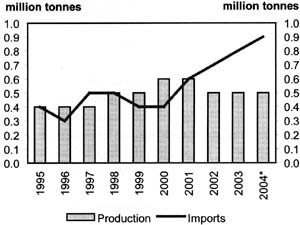
* Forecast.
Stocks may diminish in Japan, following government efforts to reduce availabilities, and in the Republic of Korea, owing also to the recent policy change aimed at increasing market orientation. Among African importers, some depletion of reserves is expected to occur in Côte d'Ivoire, Nigeria and Tanzania, while across Latin America, stocks are down in Brazil and Peru.
As for stocks at the close of the ongoing 2004/05 season, there is still considerable uncertainty, since the bulk of the 2004 crops are at the planting stage. Based on expectations of a moderate recovery in global production in 2004 and steady growth in world rice utilization, global carryover inventories could fall another 4 million tonnes from their opening levels. China is likely to account again for much of the drop, as the production leap anticipated this season would not be sufficient to cover the rise in requirements, especially if, as expected, the country refrains from stepping up imports. Stocks in Thailand could also continue to fall, reflecting the sharp rise in exports anticipated this year. By contrast, assuming India sticks to its current trade policy, it might be successful in raising its end-of-season reserves. On the other hand, smaller imports could lead to some depletion of stocks in Indonesia.
The continuous draw-down of global rice inventories will mean that the stock-to-use ration (which provides some indication as to how much of the foreseen consumption could be met just before the opening of a new season through existing reserves) will further decline, from 29 percent at the end of 2002 to 24 percent at the end of 2004.
INTERNATIONAL RICE PRICES
World rice prices continue on an upward trend
International rice prices have maintained an upward trend since December 2003, with the FAO All Rice Price Index (1998-2000 = 100) surpassing the 100-point threshold in March, for the first time since September 1999. The rise in the first 5 months of 2004 has been most pronounced for low and high quality indica rice, which, with the absence in the market of exporters such as India and Myanmar, has shown increasing signs of scarcity. In May, however, the price strength has been tempered by the release of rice from government inventories in Thailand and China, which have contributed to, respectively, a rise in export supplies and a drop in import demand. On the other hand, while Indonesia has remained out of the market, continued purchase interest has been shown by Iraq, the Philippines and Nigeria. The net effect was a one-point increase in the FAO All Rice Price Index between April and May as it rose to 109. The release of government stocks in Thailand depressed all rice quotations in the country, which declined in May compared with April, while export prices in the United States of America, Pakistan and Viet Nam held steady or even rose.
FIGURE 9
Global rice closing stocks and stocks-to-use
ratio (milled equivalent)
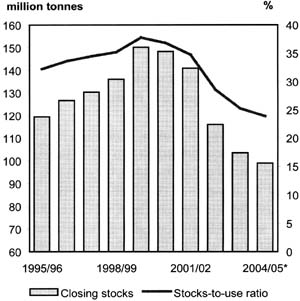
* Forecast.
On a year-to-year basis, however, prices have posted important gains. For instance, in May 2004, Thai 100%B was quoted at US$236 per tonne, 17 percent above the May 2003 level. The increase was even more pronounced for US 2/4% long grain, which was priced 46 percent higher (US$420 per tonne in May 2004 compared with US$287 per tonne a year earlier). As a result, the price gap between the high quality rice sourced in Thailand and the United States of America has widened, compared with 1 year ago.
Prospects for prices in the next few months are still positive, as import demand should remain strong relative to availabilities at least until August/September, when a number of the Northern Hemisphere producers will have harvested their main crop. In this respect, information regarding the state of crop development in major producing countries will be felt critically by the market in the coming months, given the low level of global stocks estimated to be available. Bad weather in countries such as mainland China, India, the Philippines or Bangladesh, for example, would have much greater consequences than in previous years, when the world rice situation was less tight.
Meanwhile, contrasting forces will create the price pattern, with additional strength expected should India and Myanmar carry on with their export restrictions. The surge of crude oil prices could also exert upward pressure on export rice quotations, as higher production and marketing costs are passed along the rice chain. Other factors, however, will tend to dampen the price strength. For example, there have been clear signs from China that the country still has sufficient reserves to keep its imports within reasonable bounds. The possibility that Indonesia refrains from importing for a longer period than originally foreseen would also contribute to cooling the market.
FIGURE 10
FAO price indices for rice
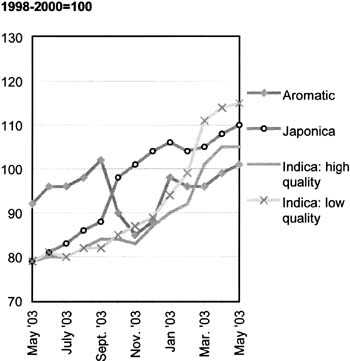
FIGURE 11
Export prices for rice
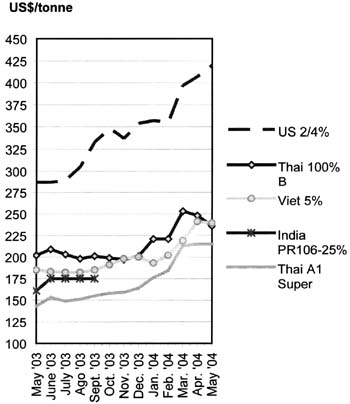
TABLE 3
Export prices for rice
| |
Thai 100% Ba |
US 2/4% long grain |
Viet 5% |
Thai 25% |
India 25% |
Viet 25% |
Pak 25% |
Thai A1 Superb |
US 2/4% medium grainc |
Pak Basmatid |
Thai fragrant 100% |
|
US $/tonne, f.o.b. |
|||||||||||
|
1999 |
253 |
333 |
228 |
215 |
237 |
204 |
206 |
192 |
405 |
486 |
397 |
|
2000 |
207 |
271 |
183 |
172 |
232 |
159 |
163 |
143 |
289 |
418 |
428 |
|
2001 |
177 |
264 |
166 |
153 |
185 |
148 |
148 |
135 |
256 |
332 |
275 |
|
2002 |
197 |
207 |
187 |
171 |
140 |
168 |
159 |
151 |
219 |
366 |
306 |
|
2003 |
201 |
284 |
183 |
176 |
166 |
167 |
175 |
151 |
310 |
357 |
449 |
|
2003 |
|
|
|
|
|
|
|
|
|
|
|
|
May |
202 |
287 |
185 |
173 |
161 |
168 |
178 |
143 |
284 |
336 |
460 |
|
June |
209 |
287 |
183 |
180 |
175 |
164 |
178 |
153 |
298 |
n.a. |
486 |
|
July |
203 |
289 |
182 |
176 |
175 |
162 |
179 |
149 |
309 |
n.a. |
482 |
|
Aug. |
198 |
305 |
182 |
172 |
175 |
162 |
187 |
151 |
309 |
n.a. |
488 |
|
Sept. |
201 |
333 |
185 |
176 |
175 |
166 |
185 |
155 |
n.a. |
n.a. |
543 |
|
Oct. |
199 |
348 |
191 |
179 |
n.a. |
173 |
175 |
158 |
419 |
n.a. |
485 |
|
Nov. |
197 |
337 |
198 |
178 |
n.a. |
179 |
176 |
159 |
448 |
n.a. |
429 |
|
Dec. |
201 |
354 |
200 |
180 |
n.a. |
180 |
186 |
164 |
463 |
n.a. |
450 |
|
2004 |
|
|
|
|
|
|
|
|
|
|
|
|
Jan. |
221 |
357 |
193 |
195 |
n.a. |
178 |
203 |
176 |
471 |
449 |
510 |
|
Feb. |
221 |
355 |
202 |
200 |
n.a. |
188 |
212 |
184 |
457 |
449 |
488 |
|
Mar. |
253 |
397 |
219 |
232 |
n.a. |
204 |
238 |
213 |
452 |
449 |
495 |
|
April |
248 |
407 |
241 |
231 |
n.a. |
223 |
239 |
215 |
463 |
486 |
504 |
|
May |
236 |
420 |
239 |
223 |
n.a. |
223 |
240 |
215 |
470 |
523 |
492 |
|
2003 |
|
|
|
|
|
|
|
|
|
|
|
|
Jan.-May |
200 |
231 |
175 |
174 |
153 |
163 |
166 |
145 |
229 |
356 |
406 |
|
2004 |
|
|
|
|
|
|
|
|
|
|
|
|
Jan.-May |
236 |
387 |
219 |
216 |
n.a. |
203 |
226 |
201 |
463 |
471 |
498 |
a White rice, 100% second grade, f.o.b. Bangkok.b White brokens rice.c F.a.s. basis.d Basmati ordinary, f.o.b. Karachi, (f.o.b. = free on board and f.a.s. = free along sideship)
Source: Jackson Son & Co. (London) Ltd. and other public sources.
TABLE 4
FAO rice price indices (1998-2000 =
100)
| |
All |
Indica |
Japonica |
Aromatic |
|
|
High |
Low |
||||
|
1999 |
101 |
99 |
101 |
105 |
98 |
|
2000 |
84 |
84 |
83 |
83 |
89 |
|
2001 |
74 |
74 |
74 |
76 |
69 |
|
2002 |
72 |
73 |
75 |
67 |
74 |
|
2003 |
82 |
79 |
81 |
83 |
91 |
|
2003 |
|
|
|
|
|
|
May |
80 |
79 |
79 |
79 |
92 |
|
June |
82 |
80 |
81 |
81 |
96 |
|
July |
83 |
80 |
80 |
83 |
96 |
|
Aug. |
85 |
82 |
82 |
86 |
98 |
|
Sept. |
86 |
84 |
82 |
88 |
102 |
|
Oct. |
89 |
84 |
85 |
98 |
90 |
|
Nov. |
90 |
83 |
87 |
101 |
85 |
|
Dec. |
93 |
87 |
89 |
104 |
88 |
|
2003 |
|
|
|
|
|
|
Jan.-May |
75 |
74 |
76 |
70 |
88 |
|
2004 |
|
|
|
|
|
|
Jan. |
97 |
90 |
94 |
106 |
98 |
|
Feb. |
98 |
92 |
99 |
104 |
96 |
|
Mar. |
105 |
101 |
111 |
105 |
96 |
|
April |
108 |
105 |
114 |
108 |
99 |
|
May |
109 |
105 |
115 |
110 |
101 |
|
2004 |
|
|
|
|
|
|
Jan.-May |
103 |
98 |
106 |
107 |
98 |
Note: The FAO Rice Price Index is based on 16 rice export quotations. "Quality" is defined by the percentage of broken kernels, with high (low) quality referring to rice with less (equal to or more) than 20 percent brokens. The Sub-Index for Aromatic Rice follows movements in prices of Basmati and fragrant rice.
Source: FAO.
TABLE 5
World paddy production
| |
2002 |
2003 |
2004 |
|
million tonnes |
|||
|
WORLD |
572.2 |
591.7 |
613.0 |
|
Developing countries |
546.5 |
568.6 |
587.2 |
|
Developed countries |
25.8 |
23.1 |
25.4 |
|
ASIA |
517.8 |
538.4 |
555.7 |
|
Bangladesh |
37.8 |
39.9 |
40.5 |
|
Cambodia |
3.8 |
4.7 |
4.7 |
|
Chinaa |
176.3 |
167.5 |
178.8 |
|
India |
109.0 |
131.9 |
136.0 |
|
Indonesia |
51.5 |
52.1 |
53.1 |
|
Iran (Islamic Republic of) |
3.1 |
3.3 |
3.4 |
|
Japan |
11.1 |
9.7 |
10.7 |
|
Myanmar |
22.8 |
24.6 |
23.0 |
|
Pakistan |
6.7 |
7.3 |
7.6 |
|
Philippines |
13.0 |
14.1 |
14.6 |
|
Republic of Korea |
6.7 |
6.0 |
6.4 |
|
Sri Lanka |
2.9 |
3.1 |
2.5 |
|
Thailand |
26.1 |
26.6 |
27.0 |
|
Viet Nam |
34.4 |
34.5 |
34.2 |
|
AFRICA |
17.8 |
18.1 |
18.2 |
|
North Africa |
6.0 |
6.2 |
6.2 |
|
Egypt |
6.0 |
6.2 |
6.2 |
|
Sub-Saharan Africa |
11.7 |
12.0 |
12.0 |
|
Western Africa |
7.4 |
7.5 |
7.6 |
|
Côte d'Ivoire |
1.0 |
0.8 |
0.8 |
|
Guinea |
0.8 |
0.8 |
0.8 |
|
Mali |
0.7 |
1.0 |
1.0 |
|
Nigeria |
3.4 |
3.4 |
3.5 |
|
Central Africa |
0.4 |
0.4 |
0.4 |
|
Eastern Africa |
1.1 |
0.9 |
1.0 |
|
Tanzania |
0.8 |
0.7 |
0.8 |
|
Southern Africa |
2.9 |
3.1 |
3.0 |
|
Madagascar |
2.6 |
2.8 |
2.7 |
|
Mozambique |
0.2 |
0.2 |
0.2 |
|
CENTRAL AMERICA |
2.7 |
2.6 |
2.7 |
|
Mexico |
0.2 |
0.2 |
0.3 |
|
SOUTH AMERICA |
19.8 |
19.8 |
22.6 |
|
Argentina |
0.7 |
0.7 |
1.0 |
|
Brazil |
10.6 |
10.4 |
12.9 |
|
Colombia |
2.3 |
2.5 |
2.6 |
|
NORTH AMERICA |
9.6 |
9.0 |
9.9 |
|
United States of America |
9.6 |
9.0 |
9.9 |
|
EUROPE |
3.2 |
3.2 |
3.3 |
|
EUb |
2.6 |
2.6 |
2.7 |
|
OCEANIA |
1.3 |
0.4 |
0.6 |
|
Australia |
1.3 |
0.4 |
0.6 |
Note (Tables 5-7): Totals computed from unrounded data.
a Including Taiwan Province of
China.
b EU-15 until 2003, EU-25 in 2004.
c
Tentative.
TABLE 6
World imports of rice (milled)
| |
2002 |
2003 |
2004 |
|
million tonnes |
|||
|
WORLD |
28.1 |
28.0 |
25.7 |
|
Developing countries |
23.8 |
23.7 |
21.3 |
|
Developed countries |
4.2 |
4.3 |
4.4 |
|
ASIA |
14.2 |
13.6 |
11.8 |
|
Bangladesh |
0.5 |
1.6 |
0.4 |
|
Chinaa |
0.3 |
0.4 |
1.0 |
|
Indonesia |
3.5 |
3.0 |
1.5 |
|
Iran (Islamic Republic of) |
1.0 |
0.7 |
0.7 |
|
Japan |
0.7 |
0.7 |
0.7 |
|
Malaysia |
0.6 |
0.6 |
0.5 |
|
Philippines |
1.3 |
0.9 |
1.0 |
|
Saudi Arabia |
0.8 |
0.8 |
0.9 |
|
Sri Lanka |
0.1 |
0.1 |
0.2 |
|
AFRICA |
8.4 |
8.3 |
8.0 |
|
Côte d'Ivoire |
0.7 |
0.8 |
0.9 |
|
Nigeria |
1.8 |
1.5 |
1.3 |
|
Senegal |
0.8 |
0.6 |
0.6 |
|
South Africa |
0.7 |
0.8 |
0.8 |
|
SOUTH AMERICA |
0.8 |
1.4 |
1.0 |
|
Brazil |
0.6 |
1.1 |
0.6 |
|
Peru |
0.0 |
0.0 |
0.1 |
|
NORTH AND C. AMERICA |
2.5 |
2.6 |
2.7 |
|
Mexico |
0.5 |
0.5 |
0.5 |
|
EUROPE |
1.8 |
1.7 |
1.9 |
|
EUb |
0.7 |
0.7 |
0.9 |
|
OCEANIA |
0.3 |
0.4 |
0.4 |
TABLE 7
World exports of rice (milled)
| |
2002 |
2003 |
2004 |
|
million tonnes |
|||
|
WORLD |
28.1 |
28.0 |
25.7 |
|
Developing countries |
23.9 |
23.1 |
21.7 |
|
Developed countries |
4.2 |
4.9 |
4.0 |
|
ASIA |
22.4 |
21.9 |
19.7 |
|
Chinaa |
2.1 |
2.7 |
1.8 |
|
India |
6.6 |
4.4 |
2.5 |
|
Myanmar |
0.9 |
0.4 |
0.3 |
|
Pakistan |
1.6 |
2.0 |
2.0 |
|
Thailand |
7.3 |
7.6 |
8.5 |
|
Viet Nam |
3.2 |
3.9 |
4.0 |
|
AFRICA |
0.5 |
0.6 |
0.7 |
|
Egypt |
0.5 |
0.6 |
0.7 |
|
SOUTH AMERICA |
1.2 |
1.1 |
1.5 |
|
Argentina |
0.2 |
0.2 |
0.4 |
|
Uruguay |
0.7 |
0.6 |
0.7 |
|
NORTH AMERICA |
3.3 |
3.9 |
3.4 |
|
United States |
3.3 |
3.8 |
3.3 |
|
EUROPE |
0.3 |
0.2 |
0.2 |
|
EUb |
0.3 |
0.2 |
0.2 |
|
OCEANIA |
0.4 |
0.2 |
0.2 |
|
Australia |
0.4 |
0.2 |
0.2 |
TABLE 8
Supply and utilization of rice in main exporting
countries (national crop years)
| |
2001/02 |
2002/03 |
2003/04 |
2001/02 |
2002/03 |
2003/04 |
||||||
|
'000 tonnes |
'000 tonnes |
|||||||||||
|
China ab (Oct./Sept.) |
India a (Oct./Sept.) |
|||||||||||
|
Opening stocks |
90.580 |
F |
83.350 |
F |
73.690 |
F |
25.000 |
F |
26.400 |
F |
12.000 |
F |
|
Productionc |
122.901 |
G |
120.876 |
G |
114.778 |
* |
93.080 |
G |
72.660 |
G |
87.940 |
G |
|
Imports |
340 |
G |
402 |
G |
950 |
F |
10 |
F |
30 |
F |
50 |
F |
|
Total supply |
213.821 |
|
204.628 |
|
189.418 |
|
118.090 |
|
99.090 |
|
99.990 |
|
|
Domestic use |
128.399 |
|
128.288 |
|
126.488 |
|
85.090 |
|
82.690 |
|
84.990 |
|
|
Exports |
2.072 |
G |
2.650 |
G |
1.760 |
F |
6.600 |
F |
4.400 |
F |
2.500 |
F |
|
Closing stocks |
83.350 |
F |
73.690 |
F |
61.170 |
F |
26.400 |
F |
12.000 |
F |
12.500 |
F |
| |
Pakistan a (Nov./Oct.) |
Thailanda (Nov./Oct.) |
||||||||||
|
Opening stocks |
970 |
F |
550 |
F |
340 |
F |
1.810 |
F |
2.400 |
F |
2.100 |
F |
|
Productionc |
3.882 |
G |
4.479 |
G |
4.871 |
G |
17.558 |
G |
17.250 |
G |
17.626 |
G |
|
Imports |
0 |
F |
0 |
F |
0 |
F |
1 |
G |
7 |
G |
7 |
F |
|
Total supply |
4.852 |
|
5.029 |
|
5.211 |
|
19.369 |
|
19.657 |
|
19.733 |
|
|
Domestic use |
2.699 |
|
2.731 |
|
2.791 |
|
9.642 |
|
9.977 |
|
9.583 |
|
|
Exports |
1.603 |
G |
1.958 |
G |
2.000 |
F |
7.327 |
G |
7.580 |
G |
8.500 |
G |
|
Closing stocks |
550 |
F |
340 |
F |
420 |
F |
2.400 |
F |
2.100 |
F |
1.650 |
F |
| |
United States d (Aug./July) |
Viet Nam a (Nov./Oct.) |
||||||||||
|
Opening stocks |
887 |
G |
1.216 |
G |
829 |
G |
4.020 |
F |
4.500 |
F |
4.900 |
F |
|
Production c |
6.718 |
G |
6.536 |
G |
6.369 |
G |
21.416 |
G |
22.976 |
G |
23.024 |
G |
|
Imports |
412 |
G |
459 |
G |
448 |
G |
2 |
F |
2 |
F |
2 |
F |
|
Total supply |
8.017 |
|
8.211 |
|
7.646 |
|
25.438 |
|
27.478 |
|
27.926 |
|
|
Domestic use |
3.846 |
|
3.522 |
|
3.684 |
|
17.698 |
|
18.688 |
|
19.026 |
|
|
Exports |
2.955 |
G |
3.860 |
G |
3.262 |
G |
3.240 |
G |
3.890 |
G |
4.000 |
F |
|
Closing stocks |
1.216 |
G |
829 |
G |
700 |
G |
4.500 |
F |
4.900 |
F |
4.900 |
F |
Note: G = official figure; * = unofficial figure; F = FAO estimate/forecast. (Totals computed from unrounded data.)
a Rice trade data refer to the calendar year of the
second year shown.
b Including Taiwan Province of
China.
c Milled basis.
d Rice trade data refer to
the August/July marketing season.
|
[1] The information contained
in this article is as of May 2004. [2] EU-15 refers to the European Union when its members numbered 15 (i.e. until 30 April 2004). As of 1 May 2004, the EU comprises 25 members, following the entry of several East European nations, and is hence referred to as EU-25. [3] The country deferred tariffication under the "special treatment" provisions of Annex 5 of the Agreement on Agriculture. [4] Imports excluding re-exports. [5] 80 percent for husked indica; 88 percent for husked japonica; 163 percent for milled indica; 167 percent for milled japonica. |
![]()
![]()
![]()