


To give an overview of the SEAGA Approach.
Conceptual framework, Context analysis, Food security, Guiding
principles, Livelihood analysis, Logical framework, Participatory methods,
Performance indicators, Quantitative and qualitative data, Resources, Needs and
constraints analysis, SEAGA approach, SEAGA levels, SEAGA matrix, Stakeholder
analysis, Typologies of sampling and participation.
SEAGA Approach
The SEAGA Approach uses a combination of quantitative
and qualitative methods for integrating socio-economic and
gender issues into planning and delivery of rescue, resuscitation,
relief, rehabilitation and development aid programmes.
Two ways of distinguishing between quantitative and
qualitative data are by the source of information and the way in which the
information is gathered, interpreted and used. Quantitative data are based on
formal surveys, including national data sources. They are usually analyzed using
formal statistical tests. Qualitative data are based on less formal methods of
data collection, such as rapid appraisal techniques. Qualitative methods study
process more effectively. Quantitative methods tend to focus on inputs and
numerically definable outputs.
Quantitative and Qualitative Data
Definitions[4]
|
Quantitative data can be defined as
measures of quantity, such as the number of women and men who own sewing
machines in a village.
Qualitative data can be defined as people’s
judgements and perceptions about a subject, such as the confidence those women
and men have in sewing machines as instruments of financial
independence. |
There is sometimes considerable overlap between quantitative
and qualitative approaches, yet confusion in their presentation. "Quality of
life" indicators, such as those that measure changes in a population’s
health, education or employment, are often confused with qualitative indicators,
because both appear to refer to "quality". In fact, health, education or any
other subject can be measured by using both qualitative and quantitative data
gathering methods.
Quantitative and qualitative data should be used together to
permit a more complete representation of the situation and for cross checking of
data. Participatory qualitative methods (such as case studies and/or
rapid appraisal techniques) can provide information to help identify important
areas of study, or assess the validity of analyses from quantitative data for a
specific community or region. They can also assist local people to
systematically assess and communicate information themselves about their
situation (their perceptions, needs, resources and constraints).
In general, if designing both qualitative and quantitative
studies for the same purpose, they should be carried out sequentially to provide
the opportunity to improve one study based on findings from the previous study.
Qualitative and quantitative methods may provide seemingly contradictory
information in some instances. This discrepancy itself is an important source of
information and points to issues that need further exploration.
Rapid and Participatory Rural
Appraisal (RRA and PRA)
It is important to recognize the difference between RRA and
PRA. The key difference is who leads the research. If the learning
process is mostly managed by outsiders, such as development field
workers, it is called RRA; if, on the other hand, it is a continuous research
and action process managed by the local community, it is called
PRA.
Rapid Rural Appraisal should be organised in the case
of assessment surveys for emergency situations, when there is a time limitation
factor and need to collect information quickly. Emergency field operators mostly
manage this process. RRA facilitates making full use of local knowledge
and experience, limiting the imposition of outsiders’
preconceptions on local conditions. Local people are given the opportunity to
describe how they do things, what they know and what they want.
Typologies of Sampling
|
|
Every person/household/variety and so on, is given a number. Every
fifth, tenth or other is chosen for the sample until the required
size is obtained
|
|
|
Sample numbers are selected at random until the required sample
size is obtained
|
|
|
Groups of a population are separated based on certain characteristics
(e.g. land holding size, family status). Each group is treated as
a separate case and samples are drawn for each group
|
|
|
Groups or clusters are sampled instead of on an individual basis
(e.g. agro-ecology zones). Random samples are then drawn for each
group
|
|
|
A number of cases are required. Sampling proceeds until the quota
is met
|
|
The focus is not on learning everything, but on understanding
what is necessary for deciding on relief interventions. Both careful planning
and flexibility are needed to ensure fruitful fieldwork. As RRA tools
(techniques) depend on schematic pictures, maps and diagrams, they provide
information immediately available for analysis.
The number of sites to include in the RRA depends on the size
and complexity of the affected area and on the time and resources available. The
more variation there is in an area by socio-economic factors, farming systems
and environmental conditions for example, the more numerous the sites will have
to be in order to have a full understanding of the situation.
SEAGA Concepts
The SEAGA approach is based on three guiding
principles, (i) Gender Roles and relations are of key importance,
(ii) Disadvantaged people are a priority, (iii) Participation of
local people is essential for development (progress).
Participation is a rich concept with different typologies,
meaning different things to different people in different settings. In the SEAGA
Concept, participation is considered a process of communication among
local people and intervention agents, during which local people take the leading
role to analyse the current situation and to plan, implement and evaluate
relevant activities.
Typologies of
Participation
|
|
People are informed what is going to happen
|
|
|
Questions asked by outsiders are answered
|
|
|
People are consulted but have no part in decision-making
|
|
|
People provide resources such as labour in exchange for material
incentives
|
|
|
People participate in groups to meet predetermined objectives
|
|
|
Local people and outsiders participate in joint analysis, project
design, implementation and monitoring and evaluation
|
|
|
People take initiative independently from external institutions
|
|
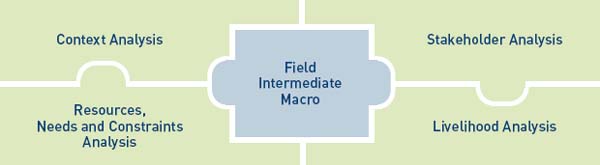
SEAGA addresses socio-economic patterns at three levels
(field, intermediate and macro levels), for different people.
A SEAGA Framework Profile matrix can be used to organise
substantive topics. Information is gathered from answers collected from applying
investigative tools (techniques) and "question tanks", through various aspects
of analysis, linked at the three levels, in order to effectively address
the different special, practical and strategic needs of men and
women.
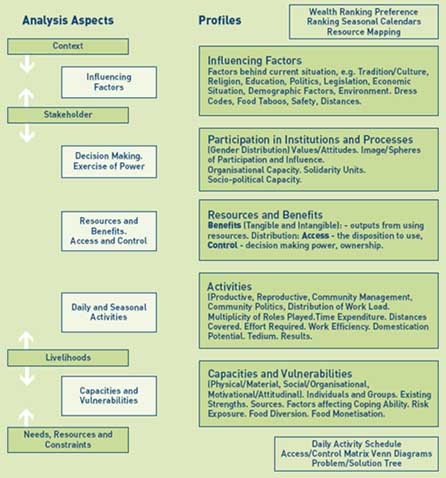
SEAGA Framework
A SEAGA Framework Profile can be drafted and filled, based on
the answers found to question tanks (checklists) using the indicative categories
(layers or angles) of information below.
SEAGA Levels
People are the focus of the Field Level,
particularly the socio-economic differences between women and men as
individuals, and among households, and communities as a
whole.
Linkages
|
A lack of food security in a village may stem from
environmental (e.g. drought) and economic problems (e.g. a lack of wage labour
opportunities), institutional problems (e.g. inadequate extension training on
food conservation methods) and social problems (e.g. discrimination against
women).
Discrimination against women, for example, can result in
women's lack of access to credit, in turn limiting their ability to purchase
inputs. The end result is that overall productivity is lower than it could be
under the circumstance. Where women have a major responsibility to produce food
crops, these linkages are important food security considerations.
A lack of food security in a village, for example, may not
result only from crop and animal production problems at the household or
community level, but also from barriers to district-level markets, as well as
national pricing policies and international terms of trade. |
Structures are the focus of the Intermediate
Level, such as institutions and services, that function to operationalise
the links between macro and field levels, including communications and
transportation systems, credit institutions, markets and extension, health and
education services. Institutions are often responsible for interpreting national
policies and for developing programmes that implement those policies.
Institutions are also often in a position to develop processes that permit local
people to get more involved in making decisions about the kind of change they
would like to have happen in their communities. They facilitate linkages between
households and individuals, communities, and policy makers who work at the macro
level. Institutions also are responsible for the collection, documentation,
analysis and interpretation of data in a country. The manner in which
quantitative and qualitative data are structured and presented has a strong
influence on the use of those data by policy makers at all levels. SEAGA
includes both national level and community level institutions as part of the
intermediate level analysis. The analysis of the institutional component
provides information about regulatory mechanisms and the flow of services. There
are many types of institutions in any society. Institutions are public, private,
formal, non-formal, religious or secular.
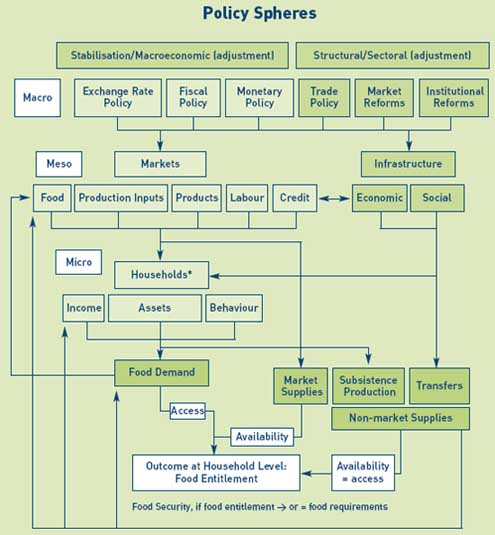
The Macro Level focuses on policies and
plans, both international and national, economic and social, including
trade and finance policies and national development plans.
Framework of Linkages between Policies
and Food Security[5]
|
*Household Resource Endowment:
- Land (Farm Size, Quality, Tenure).
- Household
Compostion (Labour Force)
- Human Capita 1 (Skills &
Knowledge).
- Savings other & Assets
- On farm &
Off-farm Capital (Livestock & Equipment). |
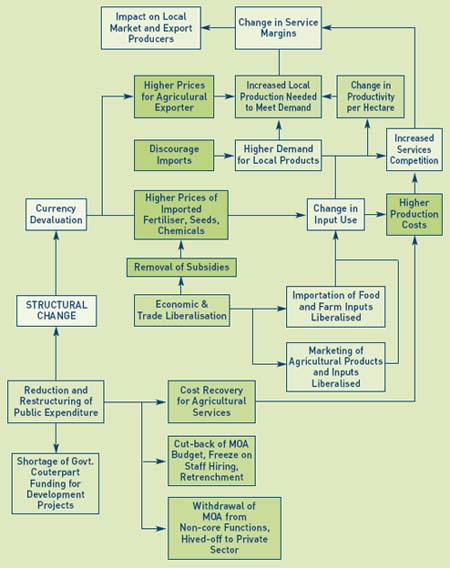
Impact of Structural Changes on
Agricultural Production and Farmers (Example Conceptual
Framework)[6]
Aspects of SEAGA
Analysis
For any particular problem, a number of socio-economic
patterns play a role. SEAGA materials address six socio-economic categories:
socio-cultural, demographic, institutional, political, economic and
environmental. In some cases institutional and political issues, as well as
social and demographic issues are paired and treated as two categories instead
of four.
Gender Mainstreaming Analysis - Simple
Situation Profile Outline
SEAGA Substantive Process
Outline
|
Social Structure
|
Daily and Seasonal Calendars
|
Benefits
|
-
Locations and Definitions
-
Population, Birth Rates, Migration, Wealth, Sex,
Ethnicity, Cast, Religion
-
Gender Audit. Inequities, Socio-economic Groups,
Social Coping Strategies
|
-
Daily and Seasonal Activities, Income, and Food
Availability
-
Multiplicity and Division of Activities and
Work Loads
-
Variations and Biases
(e.g. wage labour, child care)
|
|
|
Farming Systems
|
Income and Expenditure
|
Institutions and Services
|
-
Household Livelihoods Complexity
-
On-farm and Off-farm Activities. Knowledge Bases
and
Who is Involved. Roles and Responsibilities
-
Flow of Resources to and from the Household
|
-
Sources and Relative Divisions
-
Basic Needs and Savings. Potentials. Changes
in Crises
-
Relative Importance to Groups and Household Members
|
-
Management, Institutions, Groups, Services and
Stakeholders
-
Capacities, Participation, Communication Lines,
Decision-making Roles and Relations, and Conditions
-
Structures, Linkages, Risks, Benefits and Affects
|
|
Problem Analysis
|
Strategic Planning
|
Options Assessment
|
-
Problem Identification. Nature, Visibility, Personification,
Political Significance, Related Trends, Predictions. Priorities
and Ranking
-
Resource Control and Division of Labour
-
Practical, Strategic and Special Needs of Groups
|
-
Principles. Desired Change. Policy Initiative.
Vision. Goal. Objectives
-
Situation, History and Assumptions. Beginning,
Trigger, Seasonality, Frequency, Duration, Geography, People
(%), Groups and Stakeholders
-
Implementation Strategy
|
-
Analysis of Best Bets, Feasibility, Costs, Benefits,
Implications
-
Social Fault Lines. Resources and Constraints.
Conflict and Partnership. Force Fields. Consensus
-
Realistic and Concrete Action Plans for Priority
Activities
|
|
Causes, Effects and Solutions
|
Conflict Management
|
Project Formulation
|
-
Analysis of Agendas and Opportunities
-
Causes of Problems, Resulting Effects, and Solutions
-
Resource and Assistance Requirements
|
-
Identification of Conflict Dynamics. Interest
Based Bargaining. Options
-
Understanding Types, Existence, Circles and Perceptions
of Conflict
-
Resolution of Conflicts
|
-
Definition of Objectively Verifiable Indicators
-
Partnership, Networking, Mandates, Relative Advantages,
Feasibility, Responsibilities, Donors
-
Logistical Framework
|
|
Structural Policy
|
Stabilisation Policy
|
Food Security Policy
|
-
Infrastructure, Services, Institutions and Trade
-
Availability, Credibility, Distance, Social Mobility
Competition, Time, Rates, Norms, Literacy
-
Contact, Quantity and Regularity of Supply Constraints
|
-
Exchange Rate, Fiscal and Monetary Policy
-
Resources, Freedom, Information, Capacities,
Experiences, Effects
-
Social, Political and Economic Trade-offs and
Impacts (Private and Social Prices)
|
-
Integration of Economic and Welfare Policy Goals
-
Understanding the Constraints and Needs of Vulnerable
Groups
-
Policy Alternatives and Choices that Support
Vulnerable Groups' Livelihoods and Services
|
|
Data Selection Policy
|
Data Management Policy
|
Participation Policy
|
-
Definitions, Indicators, Types, Levels, Sectors,
Methods, Sampling and Resources, Monitoring, Evaluation of Results
-
Sex-disaggregated Data. Intra-household Data.
Access and Control
-
Macro Level Statistics
|
-
Capacity to Store, Retrieve, Relate, Integrate
and Present Data Types: Spatial, Numeric, Textual
-
Maps, Population, Landforms and Land Use Activities
-
Information Analysis
|
-
Focus and Nominal Groups, Networks, Activities,
Media, Displays
-
Participation, Responsibilities. Timetable and
Schedules, Locations, Linkages
-
Consultation and Promotion
|
|
The Context Analysis tools address economic,
environmental, social and institution patterns that pose support or constraints
to development (progress).
SEAGA Framework Profile - Context
Analysis
|
Field
|
Intermediate
|
Macro
|
|
CONTEXT
|
-
Geographic situation
-
Physical organisation of the disaster area
-
Village social maps (population trends, number
and location of households by type)
-
Land use trends
-
Wealth rankings
-
Poverty and food security status indicators
-
Welfare factors, population trends and type of
victims
-
Jobs, wages and cost of living
-
Crop production history, area planted, amount
harvested, food self-sufficiency, food security, exchange terms
|
-
Major cultural beliefs and languages spoken among
the population
-
Linkages capacities (macro-meso-micro). Regional
and district services. NGOs and networking structures
-
Degrees of decentralization
-
Organizational structures (services, communities,
committees, and representatives)
-
Gender policies in institutions and organisations
-
Lines of decision-making
-
Information dissemination and communication channels
|
-
Levels of religious involvement by the State
-
Existing welfare policies and stages of processes
(health, education, housing, civil legislation)
-
Existing laws and new rules.
-
Labour demand
-
Currency stability and terms of trade
-
International assistance (e.g. lending policies)
-
Conference outcomes
|
|
The Livelihoods Analysis tools address the flow of
activities and resources through which different people make their
living.
SEAGA Framework Profile - Livelihoods
Analysis
|
Field
|
Intermediate
|
Macro
|
|
LIVELIHOODS
|
-
Food habits
-
Social resources
-
Natural resources (land forms and uses, locations
and sizes, activities)
-
Farming systems (on farm and off farm activities)
-
Activities linkages and mobility
-
Livelihood strategies (seasonal and daily calendars)
-
Crisis coping strategies
-
Household composition
-
Resource access and control
-
Activities and labour intensity
-
Expenditure and income sources
-
Benefits and consumption
|
-
Infrastructure (communication and transport channels)
-
Markets
-
Services
-
Support systems
-
Bargaining power
-
Contacts and networks
-
Labour returns - activity analysis
-
Wage rates for men and women
-
Price analysis
|
-
Intra-household gender audit, and data for gender
sensitive macro-level planning
-
Natural resource management
-
Gender base roles, rights and obligations
-
Work opportunities, trade and local markets
-
Traditional and formal law
-
Exchange and interest rates (monetary and fiscal
policies)
-
Incentives
-
Disaggregation of markets
|
|
The Stakeholders Analysis tools address planning
intervention activities based on men’s and women’s
priorities.
SEAGA Framework Profile - Stakeholders
Analysis
|
Field
|
Intermediate
|
Macro
|
|
STAKEHOLDERS
|
-
Local groups and institutions
-
Key informants and experts
-
Institutional profiles (goals, achievements and
needs)
-
Linkages with outside organisations and agencies
-
Priority problems of men, women, socio-economic
groups
-
Causes and effects of priority problems
-
Livelihood intervention opportunities and action
priorities
-
Opportunities for improved participation and
resolution of conflicts
-
Stakeholders (Venn Diagram)
|
-
Product markets
-
Markets (raw materials, credit, labour, land)
-
Facilitating stakeholders
-
Constraining stakeholders
-
Opportunities for improving data collection and
compilation sources, methods and mechanisms
-
Opportunities for network building
-
Opportunities for integration of a gender theme
in programming and management
-
Options for new lines of decision making
-
Communication alternatives
|
-
Stabilisation policy reform and structural adjustment
processes
-
International partners
-
Government representatives
-
Political parties
-
Nominal groups and committees
-
Distribution of funds for policy implementation
-
Control of costs and benefits by institutional
structures
-
Political and economic gains or losses, and implications
|
|
The Needs and Constraints Analysis are for managers
involved in planning and delivering policy based programmes and
projects.
SEAGA Framework Profile - Needs and
Constraints Analysis
|
Field
|
Intermediate
|
Macro
|
|
NEEDS
&
CONSTRAINTS
|
|
-
Information management systems
-
Resource needed
-
Constraints and options analysis
-
Problems, conflicts and partnerships management
-
Force analysis
-
Best bets action plans (problems, causes, coping
strategies, opportunities, priorities, solutions, what, who,
costs, timing)
-
Strategic planning
|
-
Food security constraints analysis
-
Market welfare analysis
-
Linkages modeling
-
Stakeholder and development planning
-
Implementation design (actors, pros, cons and
resources)
-
Project cost benefit analysis (feasibility)
|
|
SEAGA Matrix - Context Analysis
Tools
|
In any particular community, there are a number of
socio-economic patterns that influence how people make a living and their
options for development. Looking at the Context helps us to understand
these patterns. Key questions include:
What are the
important agro-environmental, economic, institutional and social patterns in the
village?
What are the links between the
field-level patterns and those at the intermediate- and macro-levels?
What is getting better? What
is getting worse?
What are the supports for
intervention? The constraints?
Trend lines: for learning about the Impact of
Disasters (without and with project) and the Vulnerability of people
in affected areas.
Environmental
(Deforestation, Water Supply).
Economic (Jobs, Wages,
Costs of Living).
Population (Birth Rates,
Out-migration, In-migration).
Other Issues Important to the
Community {Crop Production: good, bad and normal years over the past 5-10
years. Area Planted - year 1, year 2, year 3, year 4, year 5.
Crop Harvested bags (UNITS): year 1, etc. Food Self-Sufficiency
(months): year 1, etc. Households Food Insecure (%): year 1, etc.
Prices of main staple per bag (UNITS): year 1, etc. Terms of
Exchange: e.g. exchange of 1 adult male sheep would bring how many kg of
grain over year 1, year 2, etc.}.
Village Resources Map: for learning about the
environmental, economic and social resources in the community.
Transects: for learning about the community’s
natural resource base, land forms, and land use, location and size of farms or
homesteads, and location and availability of infrastructure and services, and
economic activities.
Village Social Map: for learning about the
community’s population, local poverty indicators, and number and location
of households by type (ethnicity, caste, female-headed, wealthy, poor,
etc.)
Venn Diagrams: for learning about local groups and
institutions, and their linkages with outside organisations and
agencies. |
SEAGA Matrix - Livelihoods Analysis
Tools
|
Livelihood Analysis focuses on how individuals, households and
groups of households make their living and their access to resources to do so.
It reveals the activities people undertake to meet basic needs and to generate
income. Gender and socio-economic group differences are shown with respect to
labour and decision-making patterns. Key questions include:
How do people make
their living? How do the livelihood systems of women and men compare? Of
different socio-economic groups?
Are there households or
individuals unable to meet their basic needs?
How diversified are
people’s livelihood activities? Do certain groups have livelihoods
vulnerable to problems revealed in the Development Context?
What are the patterns for use
and control of key resources? By gender? By socio-economic group?
What are the most important
sources of income? Expenditures?
Resources Mapping - Farming Systems Diagram: for
learning about household members’ on-farm, off-farm and non-farm activities
and resources.
Benefits Analysis Flow Chart: for learning about
benefits use and distribution by gender.
Daily Activity Clocks: for learning about the division
of labour and labour intensity by gender and socioeconomic group.
Seasonal Calendars: for learning about the seasonality
of women’s and men’s labour, and seasonality of food and water
availability and income and expenditure patterns, and other seasonal issues of
importance to the community.
Resources Access and Control Matrix for learning about
use and control of resources by gender and socioeconomic group, often applied
using proportional piling and picture cards.
Income and Expenditures Matrices: for learning about
sources of income, sources of expenditures and the crisis coping strategies of
different socio-economic groups.
Wealth Ranking: for determining the proportion of the
population that is vulnerable. Proportional piling techniques can be used to
determine proportions, e.g. of people that are poor. |
SEAGA Matrix - Stakeholders Analysis
Tools
|
Stakeholders are all the different people and institutions,
both insider and outsider, who stand to gain or lose, given a particular
activity. With this toolkit the focus is on learning about people’s
priority problems and the development opportunities for addressing them. For
each activity proposed, different stakeholders are identified, revealing where
there is conflict or partnership. Key questions include:
What development
activities do different people propose?
For each proposed development
activity, who are the stakeholders? How big is their stake?
Is there conflict between
stakeholders? Partnership?
Which organizations work most
closely with community members?
What are their ties to other
levels of systems, such as government and/or private institutions?
How does the community
infrastructure support opportunities for economic development in a
community?
How do institutional
structures and mechanisms control the costs and benefits of
development?
Are there gender-linked
differences in the distribution of these costs and benefits?
Are there gender-specific
aspects to the importance of infrastructure to community members?
Venn Diagrams: for learning about local groups and
institutions, and their linkages with outside organisations and
agencies.
Institutional Profiles: for learning about the goals,
achievements and needs of local groups and institutions. |
SEAGA Matrix - Resources, Needs and
Constrains Analysis Tool
|
Bottlenecks to implementing change can occur when
institutional regulations and functions do not adapt to policy and legal
changes. In addition, all groups in a society may not have equal access to these
institutions. In many instances, institutions explicitly or implicitly control
the distribution of costs and benefits of development through regulatory and
service-delivery mechanisms. Key questions include:
What are the
priority problems in the community? For women? Men? For different socio-economic
groups?
What are the immediate needs
for institutional capacity building to facilitate a participatory approach to
development?
Given resource constraints and
stakeholder conflicts, which proposed development activities can realistically
be implemented?
Which development activities
most support the SEAGA goal of establishing an environment in which both women
and men can prosper?
Which development activities
most support the SEAGA principle of giving priority to the
disadvantaged?
Problem Analysis for bringing together different groups
in the community, to explore local coping strategies and to identify
opportunities to address the problems by identifying issues related to the
situation, to existing attitudes and to individual group behaviours. Preferences
can be recorded in the form of flow charts and ranking matrices.
Force Field Analysis: for planning specific actions for
achieving change by focusing on forces that facilitate or constrain
change.
Conflict Identification and Resolution: for
understanding and addressing the potential and actual types of conflicts at each
planning phase.
Resource and Constraints Analysis: for understanding
how individuals and groups allocate and use resources to manage risks, minimise
constraints and maximise opportunities.
Policy Analysis: for analysing policies by defining
issues, examining policy alternatives, making choices, and then implementing,
monitoring and evaluating each.
Strategic Planning: for providing a common direction
framework or umbrella under which programmes can be developed, implemented,
monitored and evaluated. |
Logical Framework
Incorporating gender analysis into programme and project
management processes for Emergency Relief Operations requires addressing
strategic questions posed at each intervention ‘Objective Level’
(goals, purpose, outputs and activities). The questions asked should investigate
the socially constructed differences between men and women, and among
themselves. These differences determine the extent to which men and women vary
in their access to and control over resources and encounter different
constraints and opportunities in society (whether at the level of the household,
community or state).
A Logical Framework (Logframe) is an analytical
instrument that links macro and intermediate levels with micro-functions of a
programme and project. It provides for organizing thinking, relating activities
and investment to expected results, setting performance levels, allocating
responsibilities, and communicating concisely. The logframe helps to structure
policy and management practices (implementation - strategy, design and delivery)
while at the same time provides information, guidance, and decisions or
complementary inputs to achieve consensus.
Engendering the logical framework is particularly about
identifying and accounting for the gender issues implicit in the planning,
monitoring and evaluation of projects, i.e. ensuring it is conscious of
social equity issues such as gender relations.
The preparation of an engendered logframe matrix
involves the participation of project planners, stakeholders and beneficiaries
in analyzing gender relations and addressing the strategic questions posed at
each ‘Objective Level’. Stakeholder agreements on these are critical.
This analysis should take place not only once during start-up, but also
throughout the course of monitoring and evaluation.
A generic project logframe consists of a matrix with four
levels (goals, purpose, outputs and activities) each with a set of four
attributes (narrative summary, objectively verified indicators, means of
verification, and assumptions).
Different terms are used for each ‘Objective Level’
to specify the accomplishments, achievements and targets to be achieved by the
intervention. Objectives separate cause from effect (e.g. project strategy -
intended effect; means - ends; cause - effect; intervention - achievement;
independent variables - dependent variables).
In planning an intervention, a logframe typically begins to
take form by working "top-down" through the matrix. First the ultimate
goal is defined, followed by the purpose of the project, then the outputs needed
to achieve the goal, and finally, the activities and inputs needed to achieve
the outputs. To reduce the risk of being unfocused, only one goal and purpose
should be stated for each intervention. Normally, however, there are multiple
activities and outputs in a project, which should be reflected in the
logframe.
Logical Framework
Structure
|
Goals
|
-
Goals are the most general level of objective. A project should
contribute to a goal, but is not responsible for all efforts
toward attaining a goal. This is the sectoral or national aim
and the reason for which the project is undertaken. The project
should contribute toward reaching this aim, but is not solely
responsible for it. What are the long-term objectives associated
problems and possible solutions?
|
|
Purpose
|
-
The Purpose is the clear statement of what is expected
to be achieved as a direct result of the intervention. Achieving
the purpose depends on the project success, but may also depend
on some factors not completely within project management control.
What are the immediate objectives, expected immediate effects,
benefits, to who, expected improvements or changes?
|
|
Outputs
|
-
Outputs are the specific contributions of the intervention,
resulting from the management of the project objectives and
activities. Which outputs (kind, quantity, purpose, by whom,
by when, where) should be produced in relation to the immediate
objectives?
|
|
Activities
|
-
Activities are substantive tasks carried out by intervention
staff using the range of resources necessary to perform project
activities -human, material, financial, etc. Which materials,
equipment, services, commodities, resources should be provided,
quantity, purpose, by whom, when, where, at what cost?
|
|
SUMMARY
|
INDICATORS
|
MEANS OF VERIFICATION
|
ASSUMPTIONS
|
|
What do we want/need to achieve?
|
How can we tell if we have achieved it?
|
Where can we get information to confirm this?
|
What else must happen if it is to succeed?
|
|
It is important to understand how the underlying logic of a
logical framework is tested. This is done by reading the logframe from
"bottom-up". For example, the linkages between the components of the matrix
would read as follows: if activities are implemented, and the associated
relevant assumptions are valid, the project would achieve the outputs. If the
outputs are achieved and the related assumptions remain valid, the project will
achieve its purpose. If the purpose is achieved and the related assumptions
hold, then the overall goal is achieved.
Assumptions about stakeholders at all levels should be
discussed. Analysis of institutional issues (capability, resources, constraints
and structural mechanisms) should be considered before proceeding with the
design phase. In some instances, integration of gender and other socio-economic
issues into design may require planned interventions at the institutional level
such as training or modification of institutional mechanisms.
The establishment of indicators and means of
verification are intrinsic to the functionality of a logframe. They show
what and how to measure the achievement of the summary in each level. Indicators
are units against which to measure success - covering statements of purpose,
activities, inputs and outputs. Qualitative indicators are classified as
objective indicators, or "objectively verifiable indicators".
Performance Indicators
|
An indicator is an item of information, which conveys a change
or result expected at each level of the operation hierarchy in order to
demonstrate progress. An indicator can be either direct or indirect (proxy) but
should be such that reasonable independent observers would agree that progress
has or has not been made as planned. A good indicator should have four
attributes:
Plausible -
possible to measure
Independent - measure changes
at one level
Targeted - specifically
defined i.e. measures of whether, what, purpose, when, where and how. (How much?
-Quantity; How well? - Quality; By when? - Time; Who - Target group; Where? -
Location)
Objectively verifiable - Quality standards should be included when
appropriate
|
Question Tank - Engendered Logical
Framework
Goal Checklist
|
Narrative summary
|
Objectively verified indicators
|
Means of verification
|
Important assumptions
|
|
|
|
-
Are data for verifying the goal sex-disaggregated
and analysed in terms of gender?
-
What gender analysis tools will be used (e.g.,
in impact assessment)?
|
|
|
Purpose Objectives
Checklist
|
Narrative summary
|
Objectively verified indicators
|
Means of verification
|
Important assumptions
|
|
|
- What measures can verify achievement of the gender responsive
objective(s)?
|
|
|
|
Outputs Checklist
|
Narrative summary
|
Objectively verified indicators
|
Means of verification
|
Important assumptions
|
|
|
|
|
-
What are the important external factors necessary for achieving
project benefits (specifically for women)?
|
|
Activities Checklist
|
Narrative summary
|
Objectively verified indicators
|
Means of verification
|
Important assumptions
|
|
|
-
Which goods and services are provided by the
beneficiaries to the project?
-
Are contributions from women and men accounted
for?
-
Are external inputs accounting for women’s
access to and control over these inputs?
|
|
|
|
Quantitative Indicators of
Participation
What is the extent
of the inputs of women/men at different levels into project identification and
planning?
How many project
identification and planning meetings were held with local
stakeholders?
What was the attendance by
local stakeholders at project identification and planning meetings, by sex, age,
ethnicity and socio-economic background?
What were the levels of
contribution/participation by local stakeholders at project identification and
planning meetings?
What were the levels of
participation by local stakeholders in data collection efforts?
With what frequency did women
and men attend?
How many
women and men were placed in key decision-making positions?
|
|
Qualitative Indicators of
Participation
What were the
stakeholder and end-user perceptions of their level of participation (measured
through participatory ranking techniques on a scale of 1 to 5)?
What was the degree of mutual
support among the group and between men and women?
How able
was the group to moderate conflict resolution and to prevent
conflict?
|
|
Question Tank - Programme and Project
Review[7]
General Checklist
|
General
Is information on
affected populations/beneficiaries disaggregated by sex and age?
If ‘gender’ is a
designated theme, is there a clear indication of what strategies will be used or
what results relating to gender inequalities or differences are
expected?
Has there been any
coordination of agencies on gender issues?
Has there been any training of
staff or efforts to build capacity in this area?
Have any lessons been
documented from previous years relating to specific gender issues and
strategies?
Do the
gender elements in funding proposals only consist of specific, targeted
initiatives or has a gender perspective also been used throughout major
initiatives?
|
|
Gender Equality
Checklist
|
Gender Equality
Have both women
and men been consulted on priorities, needs and capabilities?
Has there been attention to
the systematic reporting of and appropriate responses to gender-violence and
sexual exploitation?
What specific steps have been
taken to overcome the barriers that prevent women from playing a key role in
decision-making?
Has there been specific
support to women’s organizations and to the involvement of women’s in
peace negotiations and reconstruction?
Where
there is work with national institutions (such as the Ministry of Agriculture),
is there a component to strengthen the capacities of these institutions to work
on gender issues?
|
|
Vulnerable Groups
Checklist
|
Vulnerable Groups
Is there
recognition that all vulnerable groups are usually made of men, women, boys and
girls and that their vulnerabilities may be influenced by gender?
Are women
listed as a vulnerable group without attention to how their vulnerabilities are
also influenced by whether or not they are displaced, head a household, under
the age of 15, etc.
|
|
Food and Agriculture
Checklist
|
Food and Agriculture
Have men and women
been consulted in the design and distribution of food aid?
Has there been a recognition
of the roles of women in caring for families and dependents?
Have
women’s roles in agriculture been identified and
supported?
|
|
Health Checklist
|
Health
Is there
recognition of women’s and men’s roles and needs relating to
reproductive health care?
Are the resources allocated to
meet agency guidelines on reproductive health (for example, as outlined in the
inter-agency field manual)? Have staff received training in the use of the
manual?
Are the health priorities of
women who are not mothers taken into consideration?
Has there been attention to
the psychosocial well-being of women and men?
Do
HIV/AIDS programmes recognize and respond to women’s and men’s needs
and situations?
|
|
Water and Sanitation
Checklist
|
Water and Sanitation
Are water and
sanitation programmes based on an understanding of the roles, responsibilities
and needs of women and girls in ensuring domestic water supplies?
Women often hold the primary
responsibility for water collection and use - have they been involved in setting
priorities and making decisions about water supply programmes.
One
prerequisite for successful sanitation programmes in ‘ordinary
circumstances is women’s involvement’. Has this ‘lesson
learned’ been applied?
|
|
Education Checklist
|
Education
Do education
programmes reach girls as well as boys?
Has attention been paid to the
different obstacles faced by girls and boys in attending schools?
Are both women and men
mobilized as teachers?
Do adult
education/vocational training programmes target both women and
men?
|
|
Economic Recovery and Reconstruction
Checklist
|
Economic Recovery and Reconstruction
Do mainstream
economic reconstruction programmes provide opportunities for women as well as
men? Are there strategies to minimize obstacles to their
participation?
Are there
opportunities for women to learn skills in non-traditional
fields?
|
|
Child Protection
Checklist
[4] Source: CIDA, (1996).
"Guide to Gender Sensitive Indicators".
[5] Source: Adapted from World
Bank (1990).
[6] Source: FAO, 1997.
Implications of Economic Policy for Food Security. A Training Manual. FAO, 2001.
SEAGA Macrolevel Handbook (Revision: Harrigan, J., & Evers, B.).
[7] Source: Donor Retreat on
Consolidated Appeals Process and Co-ordination in Humanitarian Assistance,
Montreux Switzerland by CIDA/MHA Division (March 2001).
|
