![]()
![]()
![]()
Most of the research and case studies on soil CS have been conducted in temperate zones. Much less work has been done in developing regions, including drylands (Lal, 2002b). In order to realize the great potential for CS offered in drylands, efforts are needed to identify soil-specific practices that restore SOC in degraded soils. This chapter reviews specific case studies in different representative agrosystems in drylands, where the potential for carbon storage is assessed under different land-use and landmanagement practices involving irrigation and biofertilizers.
RothC (RothC-26 3) (Coleman and Jenkinson, 1995; Jenkinson and Rayner, 1977) and CENTURY 4.0 (Parton et al., 1987; Parton, Stewardt and Cole, 1988) are the most extensively used SOC simulation models. They have been tested against a variety of long-term agricultural field trials and have also been used in a variety of climate zones, including dryland regions. Both have also been adopted for use in major carbonassessment projects. The two models vary in their complexity. RothC requires fewer data inputs and so is easier to parametize. However, it only deals with soil processes and, consequently, plant residue C is a required input. The CENTURY agro-ecosystem model has similar SOC pools to RothC but has the advantage of additional submodels. Although it is able to handle a great many more land-management options than RothC, it requires an increased array of input variables that require parametization. This is important because the ability of any model to predict accurately depends on the accuracy and trustworthiness of the data used to parametize it.
Data for parametizing the models can be divided into three areas: climate, soil and land management. Studies that contain data that are sufficiently detailed for modelling are few, particularly in dryland regions. Where investigations have been undertaken and detailed information collected, the primary data that are vital for modelling are often not readily available.
Climate parameters may be referred to by investigators reporting the effects of land management on soils, but complete data sets are rarely given. However, climate data are available independently, as from FAOCLIM 2 (2000), which contains a database of more than 28 000 weather stations worldwide.
The literature contains the results from many investigations analysing soil properties and the effect of various treatments and practices upon soils. However, there are far fewer studies that combine soil analysis with examination of land management, especially over the longer term. In particular, there has been little research on dryland systems.
For the case studies examined here, CENTURY was parametized and run to equilibrium for between 2 000 and 5 000 years. Scenarios reflecting the recent past and present were then applied. Although CENTURY can run many varied cropping practices, it can only handle one crop at a time. Consequently, intercropping, which is commonly practised in dryland farming systems, could not be incorporated into the scenarios.
RothC was run to equilibrium using the current soil carbon status after initially being run in reverse mode to calculate the necessary plant carbon inputs. In order to model some of the future scenarios for analysing the effects of land management on soil C, the appropriate plant residue inputs were obtained from the CENTURY plant submodel and then used to parametize the RothC land-management files. The results in RothC frequently predict higher levels of soil C than CENTURY. This has been noted before and has been attributed to the fact that SOC tends to turnover faster in CENTURY than in RothC, and, consequently, that RothC requires lower carbon inputs to maintain the same organic carbon content (Falloon and Smith, 2002). The CENTURY plant submodel is quite basic. Therefore, where accurate estimations of plant production and crop yield are required, then alternative models, such as the fully mechanistic plant productivity model WIMOVAC, should be used (Humphries and Long, 1995).
Data from four distinctly different dryland systems in Argentina, India, Kenya and Nigeria were used to model changes in soil C with a variety of farm practices and technologies. These systems had different precultivation stocks of soil C, and had lost different amounts during cultivation (Table 11). Additions of organic matter to the soil through use of FYM, green manures, legumes in rotations, vermicompost, or use of fallows in rotations, all increased soil C and increased agricultural yields. Trees as part of agroforestry systems further increase soil carbon stocks. Inorganic fertilizer used alone to increase nutrient supply for crops results in declines in soil C in all systems, or only small increases if used with no-tillage. No-tillage increases soil C, although again the accumulation is greatest where organic matter is added to the soil.
The scenarios show that CS in tropical drylands soils can be achieved at the different sites. The land-management practices have been chosen to be in accordance with the current farming systems. Thus, for example, application rates of organic matter are commensurate with quantities that should be available to local farmers. However, at the field level, important trade-offs may occur, preventing adoption of the best strategies for CS. Crop residues may be required for livestock feed or fuel rather than be returned to the fields, or may be sold in difficult times. Animal manures may be burnt for fuel. Many socio-economic factors will interact to determine which scenario or combination of scenarios is implemented in each growing season.
Some of the results predict that soil C can be restored to precultivation levels, or in certain circumstances to above them. The true “native soil carbon level” is often difficult to establish in those systems where agricultural activity has been present for several centuries or millennia such as in the Nigeria and Kenya cases. To achieve quantities of soil C in excess of the “natural level” implies that the agriculture system has a greater productivity than the native system, assuming that C is not being imported. The scenarios that predict the highest CS rates are often associated with the introduction of trees to the system. The inputs of C from trees are more resistant to decomposition than those from herbaceous crops and, consequently, can cause marked increases in the level of soil C (Falloon and Smith, 2002).
TABLE 11
Summary of findings on carbon stocks and rates of accumulation and/or loss in four dryland agrosystems
| | Nigeria | India | Kenya | Argentina |
| Stocks of soil C before cultivation (tonnes/ha) | 8-23 | 15-20 | 33-41 | 50-70 |
| Current stocks of soil C after cultivation (tonnes/ha) | 6-12 | 13-22 | 18-28 | 37-41 |
| Effect of conventional tillage practices on soil C (tonnes/ha/year) | - 0.05 to - 0.01 | - 0.07 to +0.06 | - 0.3 to - 0.1 | - 0.17 to - 0.19 |
| Effect of FYM, organic additions, retained plant residues and fallows in rotations (tonnes/ha/year) | + 0.1 to + 0.3 | + 0.2 to + 0.4 | + 0.4 to + 0.9 | - |
| Effect of trees (tonnes/ha/year) | + additional 0.05 to 0.15 | + additional 0.5 to 0.7 | - | - |
| Effect of using inorganic fertilizers as sole source of nutrients on soil C (tonnes/ha/year) | - 0.12 to + 0.08 | - 0.01 | - 0.3 | - |
| Effects of no-tillage (NT) | | | | |
| NT alone | | | | + 0.02 +0.1 to 0.25 |
| NT + green manures or FYM | | | | +0.04 |
| NT + inorganic fertilizers | | | | |
1Effects of conventional tillage are averages for the last 100 years for each site except Kenya where rates are calculated from when each settlement commenced (30 - 50 years).
Nigeria includes some of the most densely inhabited areas of semi-arid West Africa. This is not a recent phenomenon as indications of human activity can be traced back well over a thousand years. Consequently, the soils of this region have been subjected to long periods of cultivation. However, in the last 40 years the cultivated area of northern Nigeria has increased from 11 percent to 34 percent of the total land area (Harris, 2000). In particular, the level of agricultural intensity in the Kano Closed - Settled Zone (CSZ) is among the highest in semi-arid West Africa.
Investigations into the farming systems of this region and their effect on soil fertility have been conducted by the organization Drylands Research, the United Kingdom. Its studies have found a close correlation between the intensity of farming and the adoption of soil-fertility management techniques. Plant production in the Sahel is generally limited by rainfall or nutrients (Breman and De Wit, 1983). However, the economy and infrastructure of northern Nigeria is unsuited to high external inputs such as fertilizers. Consequently, the smallholder farming units operate as low-input systems, with cattle manure being the most common form of organic input.
PHYSICAL ASPECTS
This semi-arid region has a rainy season from May - July until September. However, rainfall is erratic (Mortimore, 2000) and makes crop cultivation particularly difficult. The soils are principally ferruginous tropical soils that are sandy, with poor waterholding capacity and low levels of nutrients and organic matter (Harris, 2000). Nutrient balances can vary between years as crop growth fluctuates with rainfall. The natural vegetation is open forest savannah with a trend towards increasing open grassland where rainfall is lowest.
FARMING SYSTEMS
Northern Nigeria has been classified into three categories of farming system: intensive, less intensive and extensive (Mortimore, 1989). The intensive systems use permanent annual or biannual cultivation with a cropping intensity of more than 60 percent. The low-intensity systems operate a shrub/short-bush - fallow regime and the cropping intensity is 30 - 60 percent. The extensive system is one of long-bush - fallow and uncultivated areas, where the cropping intensity is typically less than 30 percent.
The major crops grown are millet, sorghum, groundnut, sesame and cowpea. As the systems are low input, grain yields are about 1 tonne/ha. Ridging ploughs are primarily used for cultivation and hoeing is commonplace. Applications of manure have to be made carefully to avoid “burning” the crops, and additions are 1 - 7 tonnes/ha. Crop residues are collected for fodder or left to be grazed in the fields.
Fallowing is practised in the less intensive systems although the land is still “harvested” through grazing and the collecting of wood and other products. Night-parking (or folding) of livestock is the most effective method of providing manure. Legumes such as cowpea are grown, primarily in higher-intensity systems, to provide nitrogen inputs. Inorganic fertilizers are scarce and seldom available at the optimal time.
STUDY SITES
The study sites cover a range of population density and include the three categories of farming intensity. The soils and crops grown are similar across all categories (Harris, 2000). Initially, CENTURY was parametized with a natural system of grass, woodland and grazing. A medium-intensity fire was scheduled for every 10 years and a high-intensity fire event occurred every 30 years. One thousand years ago, slash and burn episodes were commenced and two seasons of millet cultivation incorporated, repeated every 60 years. In the nineteenth century, the frequency of cultivation events was increased to a 30-year cycle, and then once every 15 years by the commencement of the twentieth century.
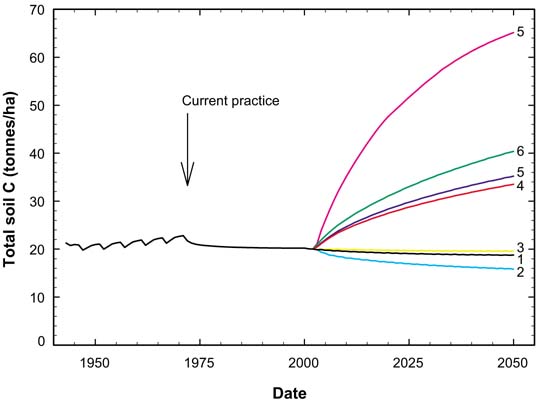
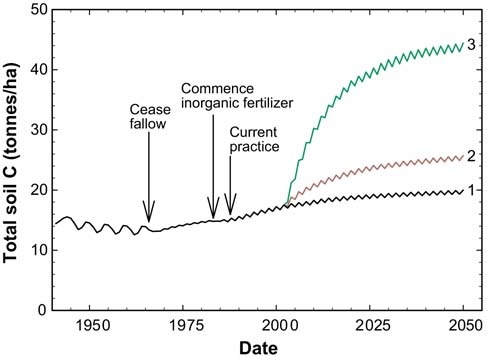
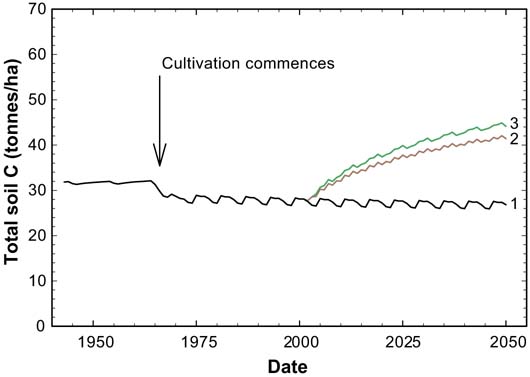
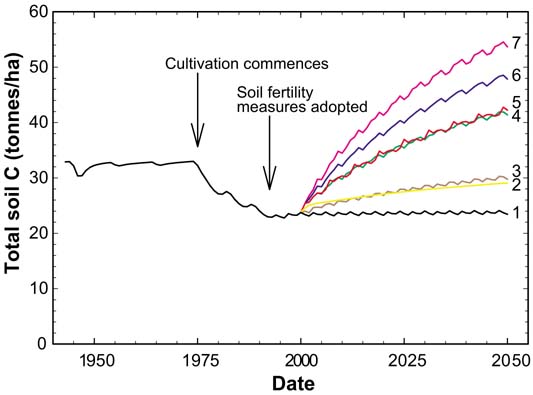
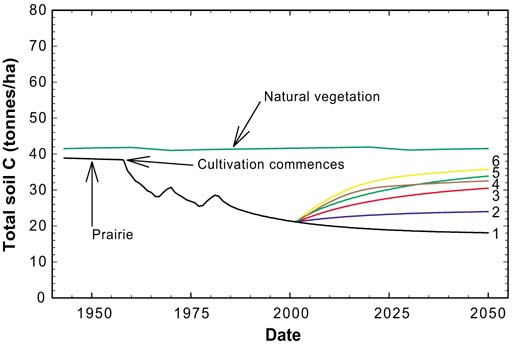
FIGURE 9 Total soil carbon for Futchimiram settlement (CENTURY)
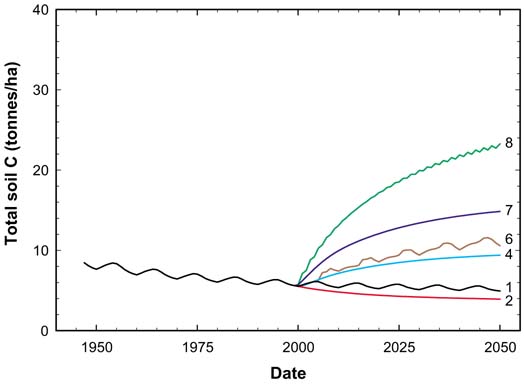
Scenarios described in Table 13.
i. Futchimiram, Borno State
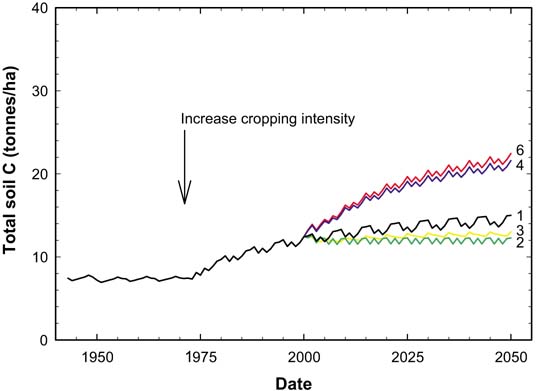
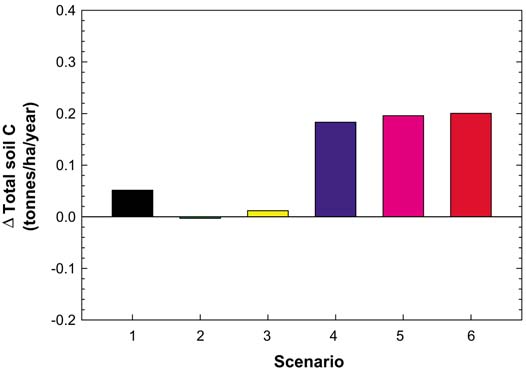
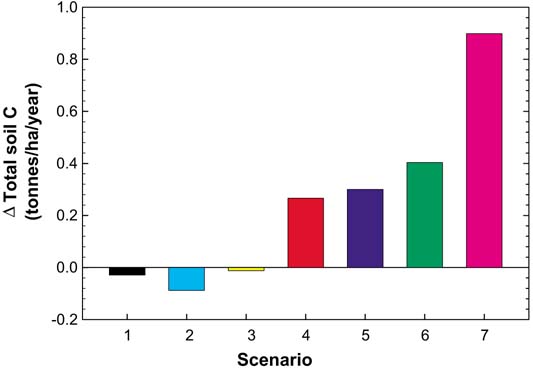
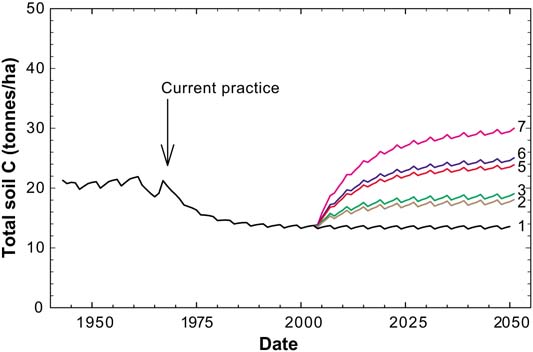
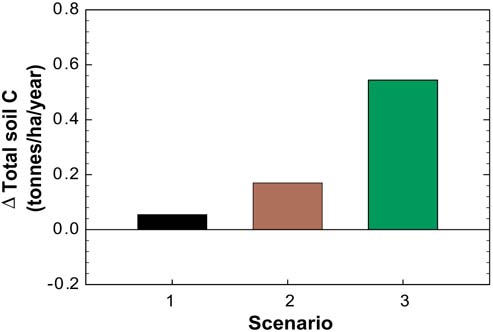
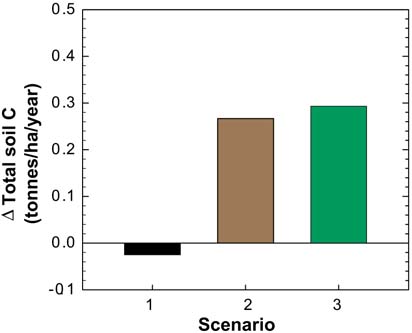
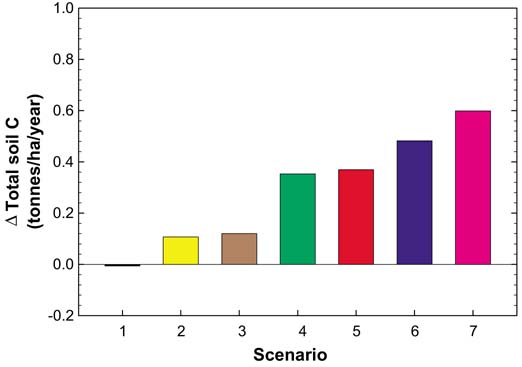
This is a low-intensity, or extensive, agropastoral system practising shifting cultivation. Some land has now become degraded. CENTURY was run for the last 60 years with alternate five-year cycles of grazing and millet cropping. Crop residues are grazed and there are no other inputs. This current practice produces a gradual and persistent decline in soil C (Figure 9). The estimated level is slightly above the measured value of soil C for cultivated soils that range between 3.5 and 4.4 tonnes/ha. RothC also predicts that the current practice will decrease soil C slightly over the next 50 years (Table 12). The scenarios in Figure 9, detailed in Table 13, compare current practices with additions of inorganic fertilizer, FYM, plant residues, fallow removal, retained plant residues and grazing. Figure 10 illustrates the predicted average annual change in soil C over a 50-year period.
TABLE 12
Total soil carbon for Futchimiram settlement
| Scenario1 | CENTURY | RothC | ||||
| 2000 | 2050 | % change | 2000 | 2050 | % change | |
| (tonnes/ha) | (tonnes/ha) | |||||
| 1 | 5.54 | 4.94 | -10.8 | 5.38 | 5.18 | -3.7 |
| 2 | | 3.93 | -29.1 | | 3.72 | -30.9 |
| 5 | | 9.40 | 69.7 | | 9.70 | 80.3 |
| 6 | | 10.57 | 90.8 | | 12.45 | 131.4 |
1Scenarios described in Table 13.
Source: CENTURY and RothC
TABLE 13
Scenarios for modelling land management practices, Futchimiram settlement
| Scenario | Land management |
| 1 | Current practice |
| 2 | Continuous cultivation |
| 3 | Continuous cultivation, no grazing of residues, harvest only grain |
| 4 | Inorganic fertilizer only (100 kg/ha urea), no grazing |
| 5 | Plant residues average 0.5 tonnes/ha/year, no grazing of residues |
| 6 | 5-year fallow, 5-year cultivation, 2 applications FYM 3 tonnes/ha, graze residues |
| 7 | Continuous cultivation, FYM 1.5 tonnes/ha/year, graze residues |
| 8 | Continuos cultivation, FYM 1.5 tonnes/ha/year |
| | Plant residues 0.5 tonnes/ha/year, no grazing |
Effect of loss of fallow
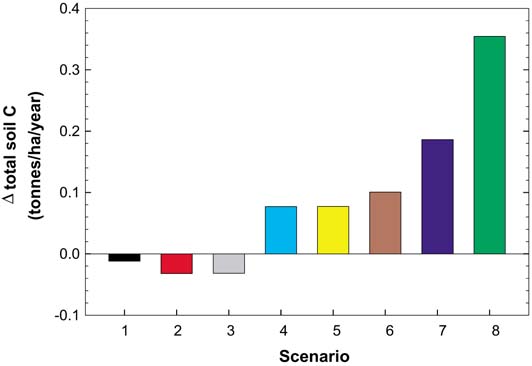
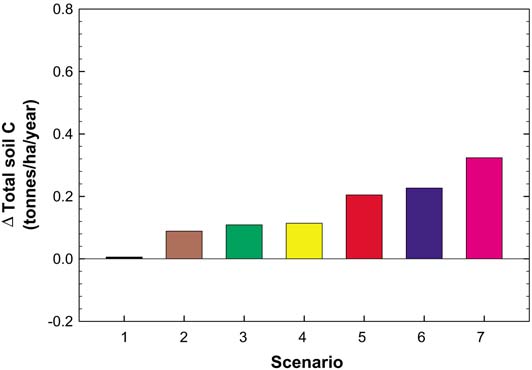
Removing the fallow period only (Scenario 2) results in a greater decline in soil C over subsequent years, with both models predicting similar reductions (Figure 9 and Table 12). Preventing grazing of the crop residues under these conditions (Scenario 3) has very little effect on soil C (Figure 10).
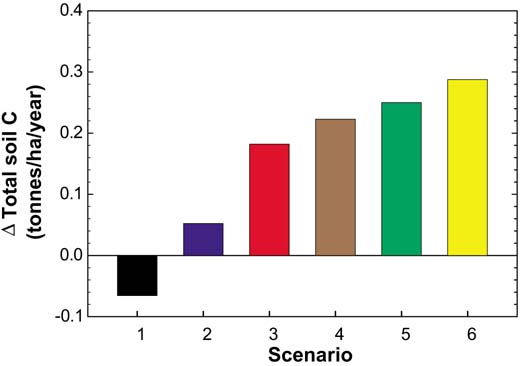
FIGURE 10 Average annual change in total soil carbon for Futchimiram settlement (CENTURY)
Effect of organic inputs
The addition of FYM (two applications of 3 tonnes/ha in each five-year cropping cycle, average 0.6 tonnes/ha/year) has a positive effect on soil C, the two models indicating an increase of 5 - 7 tonnes C/ha over the next 50 years (0.08 tonnes C/ha/year). Figures 9 and 10 show the outcome of further scenarios using different combinations of fallow and organic inputs. The gradual increase in soil C occurs with FYM, retaining plant residues and no grazing after harvest. In this case, soil stocks rise from 6 to 24 tonnes C/ha over 50 years.
Effect of inorganic fertilizer
The use of inorganic fertilizer with no other organic inputs, and no grazing or fallow (Scenario 4), leads to a modest increase in CS (0.08 tonnes C/ha/year).
Summary
This system will not yield a positive soil carbon balance without increased organic inputs. Although inorganic fertilizers can lead to CS, they bring with them a carbon cost that will result in an overall negative balance of the complete carbon budget.
ii. Kaska, Yobe State
This is a low-intensity agropastoral farming system covering lowland, upland and some wetland areas. Only the lowland soils are modelled here. There is intercropping of legumes and grains, and crop residues are fed to livestock. Manure application to fields is low and long bush fallows are used.
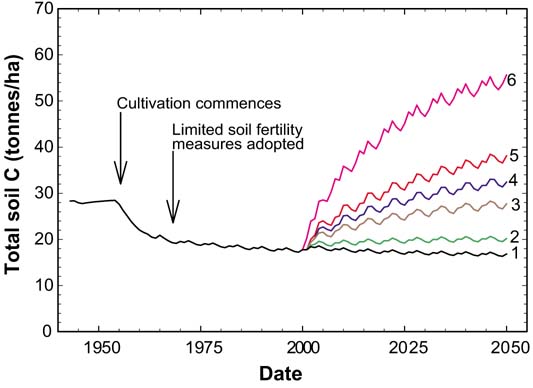
CENTURY was parametized for the last 50 years with a sevenyear cycle of 4 years of grazing and 3 years of millet - cowpea - millet cropping. FYM (0.75 tonnes/ha) was added in the first year of each cropping cycle. Cultivated soils have carbon contents of 4.5 - 7.0 tonnes/ha. The CENTURY model calculates a current carbon content of 7.7 tonnes/ha (Figure 11), and RothC gives a similar result (Table 14). Both models suggest that with current practice the system is close to steady state.
FIGURE 11 Total soil carbon for Kaska settlement (CENTURY)
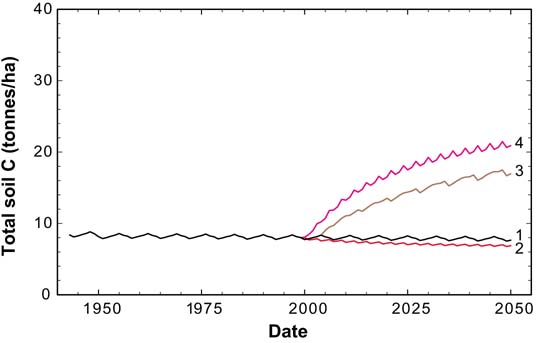
Effects of fallows and organic inputs
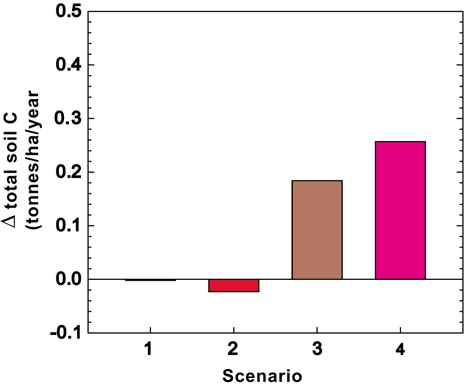
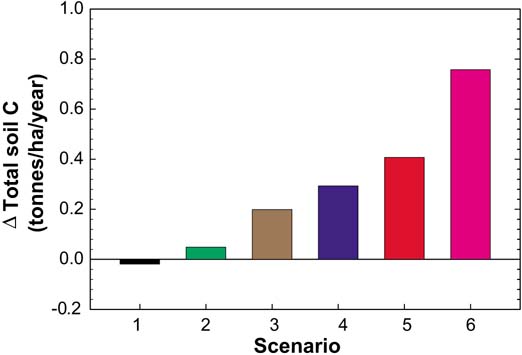
Removing the fallow from the current practice (Scenario 2) leads to a slight decline in soil C in subsequent years (Figures 11 and 12). Applying 3 tonnes/ha FYM to each millet crop (average 1.3 tonnes/ha/year over seven-year cycle) will produce a marked increase in soil C (Tables 14 and 15) representing a CS rate of 0.18 tonnes/ha/year (Figure 12). This increase will be further enhanced if the fallow is removed, because the manure application rate will now average 2 tonnes/ha/year (Figures 11 and 12).
Summary
The scenarios for Kaska illustrate the effect of fallow periods on stocks of soil C. Where the cropping regime is adding very little organic matter to the soil, fallows will often have a positive effect if correctly managed. However, if the cropping practice is accumulating significant organic matter in the soil, any interruption, such as fallowing, will decrease the overall potential for CS.
TABLE 14
Total soil carbon for Kaska settlement
| Scenario1 | CENTURY | RothC | ||||
| 2000 | 2050 | % change | 2000 | 2050 | % change | |
| (tonnes/ha) | (tonnes/ha) | |||||
| 1 | 7.73 | 7.64 | -1.2 | 7.33 | 7.87 | 7.4 |
| 3 | | 16.94 | 119.1 | | 15.57 | 112.4 |
1 Scenarios described in Table 15.
Source: CENTURY and RothC.
TABLE 15
Scenarios for modelling land management practices, Kaska settlement
| Scenario | Land management |
| 1 | Current practice |
| 2 | Continuous cultivation, millet-cowpea |
| 3 | Cultivation-fallow, FYM 3 tonnes/ha, to millet |
| 4 | Continuous cultivation, FYM 3 tonnes/ha, to millet |
FIGURE 12 Average annual change in total soil carbon for Kaska settlement (CENTURY)
iii. Dagaceri, Jigawa State
This is a region undergoing rapid intensification. It is an agropastoral system with shrub or short-bush fallowing. The length of fallow has decreased as the area of arable land has expanded. Both legumes and grains are grown, but land degradation is a problem. As the fallow period shortens, farmers rely increasingly upon manures to maintain soil fertility.
The parametization for CENTURY was initially the same as for Kaska but then, 30 years ago, cropping was increased to five years out of seven. Millet and cowpea are cropped alternately with 1.5 tonnes/ha manure added to each millet crop (average 0.64 tonnes/ha over a seven-year cycle).
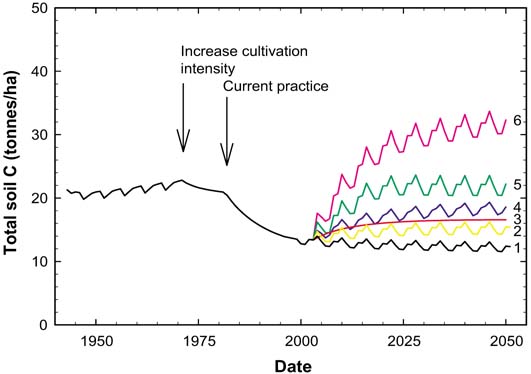
The additional manure input associated with the increase in cropping intensity results in an increase in soil C, predicted by both models, and this rise continues in subsequent years (Figure 13 and Table 16). Field measurements vary according to previous cropping intensity and range from 3 to 17 tonnes C/ha.
TABLE 16
Total soil carbon for Dagaceri settlement (CENTURY and RothC)
| Scenario1 | CENTURY | RothC | ||||
| 2000 | 2050 | % change | 2000 | 2050 | % change | |
| (tonnes/ha) | (tonnes/ha) | |||||
| 1 | 12.43 | 15 | 20.7 | 14.69 | 20.43 | 39.1 |
| 5 | | 22.22 | 78.8 | | 29.55 | 101.2 |
1Scenarios described in Table 17.
FIGURE 13 Total soil carbon for Dagaceri settlement (CENTURY)
Scenarios described in Table 17.
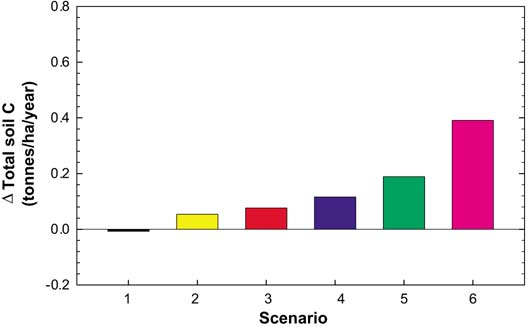
FIGURE 14 Average annual change in total soil carbon for Dagaceri settlement (CENTURY)
Scenarios described in Table 17.
Effects of fallows and organic inputs
The manure input to each millet crop is increased to 3 tonnes/ha in all scenarios (2 - 6). Carbon sequestration rates of 0.18 - 0.20 tonnes/ha can be achieved, with slight differences depending on whether the fallow is retained and crop residues grazed or ungrazed (Scenarios 4 - 6, Figures 13 and 14, Table 17). However, if fallow elimination is accompanied by harvesting all aboveground material (Scenario 3), CS is virtually halted even if manure application is maintained.
The complete removal of trees from the system results in a net loss of soil C in spite of the increased application of manure.
Summary
This system shows that SOM can be maintained and increased even with intensification of cropping, provided there are legumes in the rotation. However, careful management of crop residues is vital as is the preservation of trees.
iv. Tumbau, Kano Closed - Settlement Zone
This is a highly intensive agricultural area. All the land is cultivated although degradation reportedly affects less than 10 percent of the land area. There is a highly integrated crop and livestock production system with intercropping of legumes, intensive manuring and inorganic fertilizer application. There is virtually no grazing land so animals have to feed on crop residues and fodder from nearby fields.
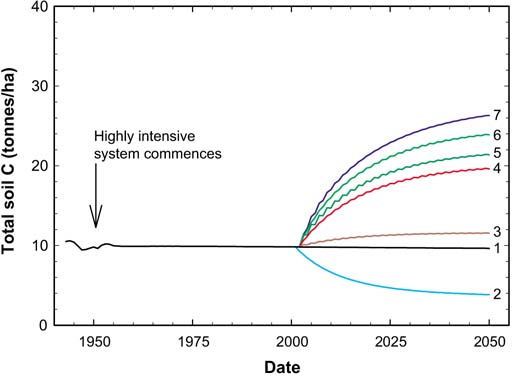
CENTURY was run for the last 50 years with a millet - cowpea rotation, 6 tonnes/ha of manure applied to the millet (average 3 tonnes/ ha/year) and all aboveground plant material harvested. This system is now close to steady state with soil C stocks at 9.8 tonnes C/ha (Figure 15). This compares with an average of 10.5 ± 1.7 tonnes C/ha measured at cultivated sites. RothC calculates a value of 11.3 tonnes/ha for 2000 but predicts that a higher soil carbon level will be reached by 2050 (Table 18).
TABLE 17
Scenarios for modelling land management practices, Dagaceri settlement
| Scenario | Land management |
| 1 | Current practice |
| 2 | Remove trees |
| 3 | No grazing of residues, harvest all aboveground |
| 4 | Continous cultivation, millet - cowpea |
| 5 | FYM average 1.29 tonnes/ha/year,fallow, graze residues, harvest only grain |
| 6 | No grazing of residues, harvest only grain |
FIGURE 15 Total soil carbon for Tumbau settlement (CENTURY)
Scenarios described in Table 19.
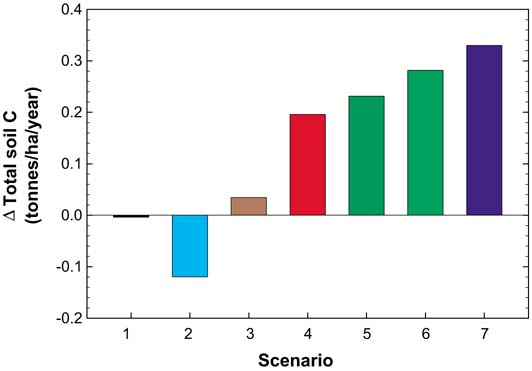
Effects of organic inputs
Additional FYM inputs have a marked impact on soil C, especially when they approach the maximum (7 tonnes/ha) normally applied in this region, i.e. an annual input of 6.75 tonnes/ha (Table 19) will result in the sequestration of 0.20 tonnes C/ha/year over the next 50 years (Figure 16). Although adding Nfixing trees and plant residues to the fields will further increase soil C, the requirement of the former for livestock feed may exceed the capacity of the current farming system.
Effect of inorganic fertilizer
Replacing the manure input to this system with inorganic fertilizer (urea 100 kg/ha, Scenario 2) results in a large reduction in soil C, with stocks falling by more than 0.1 tonnes C/ha/year.
TABLE 18
Total soil carbon for Tumbau settlement (CENTURY and RothC)
| Scenario* | CENTURY | RothC | ||||
| 2000 | 2050 | % change | 2000 | 2050 | % change | |
| (tonnes/ha) | (tonnes/ha) | |||||
| 1 | 9.82 | 9.64 | -1.8 | 11.3 | 13.39 | 18.5 |
| 3 | | 11.54 | 17.5 | | 14.96 | 32.4 |
| 6 | | 23.9 | 143.4 | | 31.7 | 180.5 |
* Scenarios described in Table 19.
TABLE 19
Scenarios for modelling land management practices, Tumbau settlement
| Scenario | Land management |
| 1 | Current practice |
| 2 | Inorganic fertilizer (110 kg/ha urea) |
| 3 | FYM 3.75 tonnes/ha/year |
| 4 | FYM 6.75 tonnes/ha/year |
| 5 | FYM 3.75 tonnes/ha/year, add nitrogen-fixing trees |
| 6 | FYM 6.75 tonnes/ha/year, plant residues 2 tonnes/ha |
| 7 | FYM 6.75 tonnes/ha/year, harvest only grain |
Summary
Provided that adequate organic matter is returned to the soil, these intensive-farming systems should maintain soil C and there is also scope for CS. These results are in agreement with findings in the field that provide no evidence for a decline in SOM in spite of increased cultivation pressure. However, the ability to realize future CS will depend on a careful balance between cropping and livestock husbandry and the overall capacity of the system. Maintaining crop yields through the application of inorganic fertilizer alone will probably result in substantial losses of SOM.
Conclusions from northern Nigeria cases
The modelling of farm data for the drylands of northern Nigeria shows that soil carbon stocks can be increased from a low base with a variety of technologies and practices already available to farmers.
The total amounts of C that can be sequestered with the use of legumes, fallow periods, FYM and retention of plant residues varies between 0.1 and 0.3 tonnes C/ha/ year. This amount rises when trees are also cultivated.
Soil C is lost when only inorganic fertilizers are used to maintain soil fertility - some 0.1 tonnes C/ha/ year in the intense systems of the Kano CSZ. Continuous cultivation results in small year-on-year losses of C where there are no additional inputs of organic matter. In spite of considerable intensification of current systems (shortening of fallow periods), farmers are maintaining carbon stocks. The benefits of maintaining trees in the landscape are shown in these modelled scenarios.
Figure 16 Average annual change in total soil carbon for Tumbau settlement (CENTURY)
Scenarios described in Table 19.
More than half of India’s farmers of India live in climate regions that can be described as semi-arid. Recent decades have seen increases in crop yields that have been attributed to the green revolution. However, the associated technologies, e.g. irrigation and inorganic fertilizer are expensive, and not readily accessible to the rural poor. These practices may lead to declines in soil fertility, and are also dependent upon fossil-fuel energy (Butterworth, Adolph and Satheesh, 2002). In fact, nearly two-thirds of the arable land in India remains dependent solely upon rainfall for agricultural production. The Natural Resources Institute (the United Kingdom), the Deccan Development Society and the BAIF Institute for Rural Development (India) have studied soil fertility management in Medak District in Andhra Pradesh and in Tumkur District in Karnataka. They have shown that there is an increasing awareness about technologies for maintaining and improving soil fertility, identifying at least 14 different practices from legume cultivation to vermicompost production. Most involve maintaining and increasing the organic matter content of the soil. These studies provide an opportunity to investigate the effect that these soil-fertility improvement techniques may have on CS.
PHYSICAL ASPECTS
Medak District forms part of the tableland of the Deccan Plateau that extends from Andhra Pradesh into Karnataka. The climate consists of a mild winter period (rabi, November - February), a hot and dry summer (March - May) and the southwest monsoon, when more than 80 percent of rainfall occurs (kharif, June - October). Average rainfall is slightly less than 900 mm. The hottest month is May, just before the onset of rains, when the maximum daytime temperature can reach 40 °C. Conversely, night temperatures can drop to 6 °C in December. Moisture availability for crop growth ranges from 120 to 150 d.
The major soil types are Alfisols and Vertisols. The former include red lateritic soils comprising loamy sands, sand loams and sandy clay loams and are usually nonsaline. The Vertisols, black cotton soils, are potentially more productive with a higher waterholding capacity, moderately alkaline and with a highly soluble salt content. They comprise clay loams, clays and silty clays. The organic carbon content of soils in the area is usually 0.5 - 1 percent. The land lies between 500 - 600 m above sea level, and very little natural vegetation remains. The tropical dry deciduous forest has mainly been felled except on protected government land.
FARMING SYSTEMS
The farming systems in this region have a high degree of integration between livestock, crops and trees (Pound, 2000). There is a huge agrobiodiversity that is combined with off-farm activities, particularly in Medak District. This situation makes for an efficient use of the limited land resources and acts as insurance against unpredictable weather conditions, a frequent problem in drylands. The average farm size is 2.6 ha (Butterworth, Adolph and Satheesh, 2002). The small and marginal farmers can grow at least eight varieties of crops per half hectare. The cattle population has been falling continuously since the 1980s. This has important implications for agriculture, not only because animal wastes are an important source of organic matter for soils, but also because bullocks make a vital contribution as draught animals, not least in the transport of FYM. Tillage is commonly performed with very basic implements. The greatest shift towards mechanized cultivation has been in Karnataka.
The predominant crops grown in Medak District are paddy, sorghum and maize while irrigated sugar cane is an important cash crop. The major crops grown in Karnataka are paddy, sorghum, finger millet, pearl millet, pigeon pea, green gram, and groundnut (Reddy, 2001).
Farmers attach a high priority to maintaining soil fertility while inorganic fertilizers are ranked poorly in terms of maintaining soil quality. However, many farmers use them because organic alternatives are often unavailable and because the inorganic fertilizers are subsidized. The importance attached to soil fertility can have unforeseen consequences such as the sale of FYM by the poorest farmers to their more affluent counterparts. The ultimate effect of this will be an increase in the fertility and carbon content of some soils while degrading neighbouring areas.
MODELLING SOIL CARBON IN THE STUDY VILLAGES
The CENTURY agro-ecosystem model was parametized using climate and soil data and run to equilibrium commencing with a grass/woodland system to represent the natural vegetation of this region. Low-intensity grazing and fires occurring every 30 years were included in the cycle. One thousand years ago, the effects of human interference were introduced with slash and burn events together with the cultivation of a grain crop. The frequency of these events was increased slowly and by the start of the twentieth century, cultivation periods of four years out of ten were introduced. In the mid-twentieth century, one year of grazed fallow was followed by four years of cropping (sorghum - kharif, and cowpea - rabi). Cultivation consisted of hand or bullock ploughing and hand hoeing. Average annual applications of FYM were 2.1 tonnes/ha over the five-year cycle and all aboveground material was harvested. For the final 30 years of the twentieth century, cultivation was adjusted to reflect current practices. The RothC model was run to equilibrium in the mid-twentieth century, and then parametized using current practice and plant residue quantities calculated by CENTURY.
Data on five types of farm and location are presented below:
i. large mixed dryland farm (Lingampally);
ii. small dryland farm, no livestock (Lingampally);
iii. large farm using irrigation (Yedakulapaly);
iv. small mixed drylands farm (Metalkunta);
v. small mixed drylands farm (Malligere);
i. Analysis of land management by a large mixed farm, Lingampally village, Medak District
This is a holding of slightly more than 5 ha on predominantly Vertisols. Livestock are fed fodder and plant residues from the fields. Consequently, no plant material is returned to the soil. The animals are also grazed on local common land. The livestock provide manure (2 - 3 tonnes/ha/year). In addition, inorganic fertilizer has been used in recent years (30 - 45 kg/ha of di-ammonium phosphate). Crops modelled are sorghum (kharif May - September) and cowpea (rabi October - January).
CENTURY predicts that the current farming practice is resulting in a nearly stable soil carbon content of about 19 tonnes/ha declining to 2050 by nearly 1.5 tonnes/ha (Figure 17). RothC shows a lower total soil carbon content of 16 tonnes/ha in 2000, declining to 15 tonnes/ha by 2050 (Table 20). The scenarios in Figure 17 (detailed in Table 21) compare current practices with additions of inorganic fertilizer, FYM, green manure, vermicompost, retained plant residues and cultivation of trees. Figure 18 indicates the average annual change in soil C in a 50-year period.
Effect of inorganic fertilizer
If the application of inorganic fertilizer were halted and the quantity of FYM increased to replace the nitrogen input and maintain yields (increase manure application by 0.6 tonnes/ha, Scenario 3), soil C would increase by only 0.85 tonnes/ ha by 2050 (Figure 17) and there would be no net gain in soil C (Figure 18). Conversely, replacing all organic additions with inorganic fertilizer would result in a decrease in soil C of more than 4 tonnes/ha by 2050, a loss of 0.09 tonnes/ha/ year (Scenario 2). Thus, inorganic fertilizer results in a fall in soil C.
FIGURE 17 Total soil carbon for a large farm (5 ha), Lingampally village (CENTURY)
Scenarios described in Table 21.
Effect of farmyard manure
Doubling the current annual input of FYM to 4 - 6 tonnes/ha (Scenario 4) without applying inorganic fertilizer has a marked effect on soil C: 0.27 tonnes/ha/year is sequestered in the next 50 years (Figure 18), with the system still not at a steady state (Figure 17). Similarly, RothC shows a continuing rise, reaching 28.3 tonnes/ha by the same date (Table 20).
TABLE 20 Total soil carbon for a large farm Lingampally village
| Scenario1 | CENTURY | RothC | ||||
| 2000 | 2050 | % change | 2000 | 2050 | % change | |
| (tonnes/ha) | (tonnes/ha) | |||||
| 1 | 20.2 | 18.8 | -7.2 | 18.3 | 17.9 | -2.3 |
| 4 | | 33.5 | 65.9 | | 28.3 | 54.2 |
| 6 | | 40.4 | 100 | | 31.0 | 68.8 |
1scenarios described in Table 21.
Source: CENTURY and RothC
Effect of other organic inputs
Adding only modest amounts of vermicompost (100 kg/ha) and green manure (250 kg/ha) in addition to the doubled FYM (Scenario 5) has a limited effect, while 2 tonnes/ha plant residues makes a bigger contribution, 0.4 tonnes/ha/year (Figure 18).
Effect of trees
This farm has a capacity for introducing N-fixing trees such as Glyricidia, which creates Scenario 7 when added to the manure and plant residues. After 10 years, the trees are cut annually for wood. The result is a very large increase in soil CS of 0.4 tonnes/ha/year (Figure 18). This increase exceeds that which would be obtained by increasing the manure application by four times.
TABLE 21
Scenarios for modelling land management practices, large farm Lingampally village
| Scenario | Land management |
| 1 | Current practice |
| 2 | FYM 3 tonnes/ha/year |
| 3 | FYM 3 tonnes/ha/year, green manure 500 kg/ha/year, |
| | vermicompost 250 kg/ha/year |
| 4 | As current practice but incorporate crop residues into soil |
| 5 | FYM 3 tonnes/ha/year, leave plant residues |
| 6 | FYM 3 tonnes/ha/year, plant residues, green manure, vermicompost |
| 7 | FYM 6 tonnes/ha/year, plant residues, green manure, vermicompost |
FIGURE 18 Average annual change (over 50 years) in total soil carbon for a large mixed farm, Lingampally village (CENTURY)
Scenarios described in Table 21.
FIGURE 19 Total soil carbon for a small rainfed farm, Lingampally village (CENTURY)
Scenarios described in Table 23.
Summary
The two soil carbon models are in fairly close agreement for this farming system. The current practice is nearly sustainable with only a small decline (< 2 percent) in soil C predicted over the next 50 years. However, cattle are currently being grazed on other land and, consequently, some C is effectively being mined from elsewhere.
A modest increase in organic material would be required to replace the inorganic fertilizers currently used. Further organic inputs could increase soil CS substantially. Introducing trees is likely to have a marked effect on soil C and would simultaneously increase aboveground carbon storage. However, a greater proportion of trees may have been introduced to the model than would be feasible and, therefore, the degree of CS that is practicable for this farming system may be overestimated.
ii. Analysis of land management by a small rainfed farm, Lingampally village, Medak District
This holding is less than 1 ha and the Vertisol has become very degraded. Animals were kept in the past but have been sold and currently sorghum is the only major crop grown. All aboveground material is harvested and removed. Some FYM is applied at different times, equivalent to 3.9 tonnes/ha/year.
The CENTURY model shows how current practices have produced a marked decline in soil C, reaching some 13 tonnes/ha in 2000 (Figure 19). However the system is reaching steady state and the current land-management practice is not predicted to cause much further decline in soil C in the next 50 years. RothC yields a slightly higher carbon content in 2000 but predicts a slightly greater decline (1.8 tonnes/ha) by 2050 (Table 22).
Effect of retained residues
Harvesting only the grain and the returning crop residues to the soil would produce a positive carbon balance, sequestering 0.05 tonnes/ha/year (Figure 20 and Scenario 2, Table 23).
Effect of farmyard manure
Increasing the input of FYM by 50 percent to 6 tonnes/ha/year would increase soil C by 3.8 tonnes/ ha by 2050 (Figure 20 and Scenario 3). RothC predicts a rise of 3.0 tonnes/ha.
FIGURE 20 Average annual change in total soil carbon for a small rainfed farm, Lingampally village (CENTURY)
Scenarios - described in Table 23.
Effect of legume crops
Adding cowpea the rotation (FYM 4 tonnes/ha, harvesting only grain, Scenario 4) would sequester 0.12 tonnes/ha/year. Introducing Nfixing trees (cut every 2 years after an initial 10 years) to the sorghum-only system with FYM at 4 tonnes/ha, would yield a sequestration rate of 0.19 tonnes/ha/year (Scenario 5). Combining all treatments would lead to a soil CS rate of 0.39 tonnes C/ha/year (Scenario 6, Figure 20).
TABLE 22
Total soil carbon for a small rainfed farm, Lingampally village
| Scenario* | CENTURY | RothC | ||||
| 2000 | 2050 | % change | 2000 | 2050 | % change | |
| (tonnes/ha) | (tonnes/ha) | |||||
| 1 | 12.77 | 12.41 | -2.8 | 16.07 | 14.92 | -7.2 |
| 3 | | 16.58 | 29.8 | | 19.11 | 18.9 |
*Scenarios described in Table 23.
Source: CENTURY and Roth C.
TABLE 23
Scenarios for modelling land management practices, for a small rainfed farm, Lingampally village
| Scenario | Land management |
| 1 | Current practice |
| 2 | Harvest only grain |
| 3 | FYM 6 tonnes/ha/year |
| 4 | Add legume (cowpea) |
| 5 | Add trees,e.g. Glyricidia |
| 6 | All additions |
Summary
The modelling suggests that the loss of soil C can be reversed for this type of farm, even on degraded soil. In addition to direct organic inputs, this example illustrates the importance of a leguminous crop, and the inclusion of trees such as Glyricidia.
iii. Analysis of land management for a large farm using irrigation, Yedakulapaly village, Medak District
The farm comprises 4.5 ha of irrigated Vertisol. Water is pumped from a borehole. For the purposes of modelling, 5 cm of water is applied when the soil waterholding capacity is < 25 percent during the vegetative growth stage of the crop. Livestock were originally kept but were sold some years ago because there was insufficient labour to collect fodder and tend to the cattle during grazing. Only inorganic fertilizers are now used - 650 kg/ha di-ammonium phosphate and 150 kg/ha of urea annually. Crops are grown in all three seasons (summer - sorghum, kharif - legume, rabi - legume) and all aboveground material is harvested and removed. For the purposes of modelling, cowpea is used for the legume crop.
CENTURY calculates that current practices have depleted soil C to 13.26 tonnes/ha and predicts no further reduction in the next 50 years (Figure 21).
FIGURE 21 Total soil carbon for a large farm using irrigation and cultivating three crops per year, Lingampally village (CENTURY)
Scenarios described in Table 24.
Effect of organic inputs
Adding 3 tonnes FYM/ha/year as per Scenario 2 (Table 24) would increase soil C by 4.4 tonnes/ha to 2050, sequestering 0.09 tonnes/ha/year (Figure 22). Including 500 kg/ha/year of green manure and 250 kg/ha/year of vermicompost (Scenario 3) would increase soil organic C by a further 1 tonne, sequestering 0.11 tonnes/ha/ year (Figure 21). A similar increase in soil C can be obtained with no extra organic additions if only the grain is harvested and the crop residues are returned to the soil (Figure 22). When 3 tonnes FYM/ha/year is applied and only the grain harvested (Scenario 5), soil C increases by more than 10 tonnes/ha by 2050, equivalent to 0.20 tonnes/ha/year. Applying all the organic inputs and increasing the FYM component to 6 tonnes/ha would sequester 0.32 tonnes/ha/year.
TABLE 24
Scenarios for modelling land management practices, large farm using irrigation Lingampally village
| Scenario | Land management |
| 1 | Current practice |
| 2 | FYM 3 tonnes/ha/year |
| 3 | FYM 3 tonnes/ha/year green manure 500 kg/ha/year, vermicompost 250 kg/ha/year |
| 4 | As current practice but incorporate crop residues into soil |
| 5 | FYM 3 tonnes/ha/year, leave plant residues |
| 6 | FYM 3 tonnes/ha/year, plant residues, green manure, vermicompost |
| 7 | FYM 6 tonnes/ha/year, plant residues, green manure, vermicompost |
Summary
A combination of leaving crop residues and adding manure could make a significant contribution to soil C in this kind of farming system, in which current practices have already caused a significant decline in soil carbon stocks. However, inorganic fertilizer and irrigation continue to have a carbon cost, resulting in smaller increases under the various scenarios. Additions of FYM can offset the nutrients applied in inorganic fertilizers. For example, removing inorganic fertilizer from Scenario 6 maintains yield without affecting soil C. Removing irrigation from the above scenario does not have a detrimental effect on soil C, but nor is there an apparent effect on yield.
FIGURE 22 Average annual change in total soil carbon for a large farm using irrigation, Lingampally village (CENTURY)
Scenarios described in Table 24
iv. Analysis of land management for a small mixed crop and livestock farm, Metalkunta village, Medak District
This landholding of 2.7 ha has a very large variety of crops on lateritic red soil. Livestock are kept, a good cultivation pattern is practised and there are also many trees present around the farm. All aboveground produce is harvested so that crop residues can be fed to the animals. Cattle are also grazed on nearby land and fodder is brought in. The average yearly manure application is 2 tonnes/ha, and vermicompost is added to the land.
FIGURE 23 Total soil carbon for a small mixed crop and livestock farm, Metalkunta village (CENTURY)
Scenarios described in Table 26.
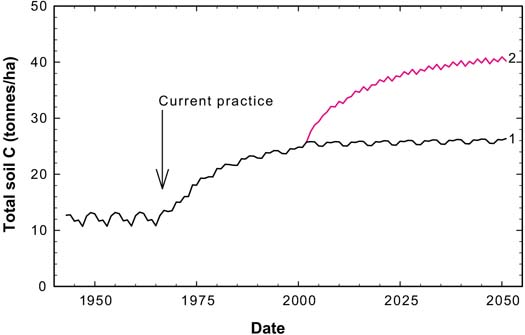
CENTURY was parametized with a sorghum - cowpea - millet - cowpea - maize - cowpea rotation to reflect the varied cropping pattern. The model was run with this scenario from the late 1960s. The model suggests that this system of land management would have approximately doubled the soil carbon content to nearly 25 tonnes/ha by 2000 and would reach 26 tonnes C/ha by 2050 (Figure 23). RothC predicts 25 tonnes C/ha in 2000 rising to 29.1 tonnes/ha in 2050 (Tables 25 and 26). This mixed cropping and livestock system has a substantial positive impact on soil C.
TABLE 25
Total soil carbon for a small mixed crop and livestock farm, Metalkunta village
| Scenario* | CENTURY | RothC | ||||
| 2000 | 2050 | % change | 2000 | 2050 | % change | |
| (tonnes/ha) | (tonnes/ha) | |||||
| 1 | 24.9 | 26.1 | 5.2 | 25.0 | 29.2 | 16.7 |
| 2 | | 40.9 | 64.7 | | 49.2 | 96.6 |
* Scenarios described in Table 26.
Source: CENTURY and RothC.
TABLE 26
Scenarios for modelling land management practices, small mixed crop and livestock farm, Metalkunta village
| Scenario | Land management |
| 1 | Current practice |
| 2 | Leave plant residues |
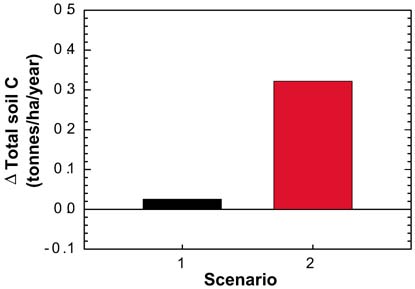
FIGURE 24 Average annual change in total soil carbon for a small mixed crop and livestock farm, Metalkunta village (CENTURY)
Scenarios described in Table 26.
Effects of retaining crop residues
Returning crop residues to the soil (Scenario 2) would greatly increase the carbon content, sequestering 0.3 tonnes C ha/year in the next 50 years (Figure 24), with the soil carbon content reaching 40.9 tonnes/ ha by 2050. RothC calculates that leaving crop residues would increase soil C to 49.2 tonnes/ha (Table 25).
Summary
The farmer is currently practising very good land management, and the models calculate that the soil carbon content has already been substantially increased. However, this is being accomplished in part by grazing cattle on other lands and bringing in fodder. This means that C is effectively being mined from elsewhere. Thus, although returning crop residues to the soil makes a further significant contribution to soil C, this would require importing more fodder to substitute for the plant residues, which again implies mining C.
FIGURE 25 Total soil carbon for a small farm, Malligere village, Tumkur District (CENTURY)
Scenarios described in Table 28.
TABLE 27
Total soil carbon for a small farm, Malligere village, Tumkur District
| Scenario* | CENTURY | RothC | ||||
| 2000 | 2050 | % change | 2000 | 2050 | % change | |
| (tonnes/ha) | (tonnes/ha) | |||||
| 1 | 17.24 | 19.97 | 15.8 | 19.82 | 24.32 | 22.7 |
| 2 | | 25.73 | 49.2 | | 34.2 | 72.6 |
* Scenarios described in Table 28.
Source: CENTURY and RothC.
TABLE 28
Scenarios for modelling land management practices, small farm, Malligere village
| Scenario | Land management |
| 1 | Current practice |
| 2 | Replace inorganic fertilizer with FYM |
| 3 | Add trees, Glyricidia |
v. Analysis of land management for a small farm, Malligere village, Tumkur District Karnataka state
This farm covers 2 ha on a red sandy soil. Tractors are hired for transport, livestock are kept and allowed to graze the crop residues, but additional fodder is brought in. The kharif crops modelled are sorghum and millet and the rabi crop is cowpea. On average, 3 tonnes/ha/ year FYM is applied. Inorganic fertilizers are also used: 75 kg/ha/ year of di-ammonium phosphate and 75 kg/ha/year of urea.
Modelling with CENTURY shows that current practices are increasing soil C and that this will continue to rise by a further 2.7 tonnes/ha in the next 50 years, reaching almost 20 tonnes C/ha in 2050 (Figure 25). RothC also shows that the current practice is increasing soil C but shows an enhanced effect. Soil C in 2000 is predicted to be 19.8 tonnes/ha, rising to 24.3 tonnes/ha in 2050 (Tables 27 and 28).
Effect of organic additions
Inorganic fertilizer has a carbon cost, so replacing the N supplied by the inorganic fertilizer with manure (annual addition 6.3 tonnes/ha) enhances the CS rate to 0.17 tonnes/ ha/year. The soil carbon level reaches 25.7 tonnes/ha by 2050 (Figure 26, Scenario 2 in Table 27,). RothC predicts a much bigger effect on SOC of replacing the fertilizer with FYM: soil C is predicted to rise to 34.2 tonnes/ha by 2050.
Effect of trees
Adding trees such as Glyricidia to the system (Scenario 3), which are cropped annually for wood after ten years, makes a very large difference, increasing CS to 0.54 tonnes/ ha/year (Figure 26).
Summary
Both models show similar trends, with a switch from inorganic to organic fertilizer increasing soil C significantly. RothC predicts a larger increase. Cessation of inorganic fertilizer use would remove the negative carbon balance associated with its production, and the addition of trees may be sufficient to offset the inputs of C that arise from fodder grown outside the farm system. However, if tractors are used to transport fodder, the carbon budget for the system will probably be negative.
FIGURE 26 Average annual change in total soil carbon for a small farm, Malligere village, Tumkur District (CENTURY)
Scenarios described in Table 28.
Conclusions from India cases
The modelling of farm data for the drylands of India shows that soil carbon stocks can be increased with a variety of technologies and practices available to farmers.
It also shows that some practices result in substantial declines in carbon stocks, particularly the use of inorganic fertilizer as the sole source of nutrients, and the continuous cultivation of cereals. In the large (5 ha) mixed farm, inorganic fertilizer results in the loss of 0.1 tonnes/ha/year, whereas the use of either FYM, green manures, vermicompost and/or plant residues produces increases of 0.2 - 0.4 tonnes/ha/year. The use of agroforestry substantially increases belowground CS to 0.9 tonnes/ha/year.
The models show substantial declines in soil C on the small farms that cultivate only sorghum and those that intensively cultivate three irrigated crops per year - a loss of 5 tonnes C/ha in a 25-year period. However, it appears that these falls can be reversed within 5 - 10 years with the adoption of legumes in rotations, the addition of FYM manure and cultivation of trees.
The small mixed cropping farm, with cereals and cowpea rotations and livestock, increases soil C from a stock of about 13 tonnes C/ha to 24.8 tonnes C/ha in 25 years. It can increase this to more than 40 tonnes C/ha in the next 50 years if plant residues are added to the soil.
For full accounting of the C used or sequestered in these farms, it is important to consider the high energy cost of nitrogen fertilizer manufacture (65.3 MJ/kg for N, 7.2 MJ/kg for phosphorus, 6.4 MJ/kg for potassium) (Pretty et al., 2002), the use of mechanized operations on farms, the cost of irrigation and mechanical transport, and the issue of the transfer of C in feed or livestock themselves from one farm to another or from grazing areas to cropped fields.
There are clear benefits for farmers and soil C if leguminous crops are included in rotations and in agroforestry systems.
Arid and semi-arid lands occupy about two-thirds of Kenya (FAO, 1999b). The major factors limiting crop growth and production in these areas of Kenya are erratic rainfall, poor husbandry and declining soil fertility caused by continuous cultivation (Kenya Agricultural Research Institute, 1999). Drylands Research has examined the sustainability of farming systems in semi-arid Kenya, recording physical aspects of the environment together with land-management practices in four villages of Makueni District (Mbuvi, 2000). These span a range of settlement times from the 1950s to the 1970s. A major problem for farming in this region has been the frequency with which it has been affected by drought. Droughts reduce the returns that farmers receive and, consequently, provide little incentive for investment in soil fertility.
PHYSICAL ATTRIBUTES
The climate of this region is characterized by two rainy periods: the short rains, which deliver most precipitation in October - December; and the long rains of March - May. However, superimposed on the average annual rainfall (600 - 670 mm) is the periodic occurrence of drought (Gichuki, 2000). Annual mean temperature is in the range of 21 - 24 °C. Elevation is 800 - 1 600 m, and the natural vegetation is grassland and dense shrub-land or woodland. Fires have affected the area in the past and the grassland is used for grazing. The soils are mostly Ferralsols (Rhodic and Xanthic) and are naturally low in phosphorus (Mbuvi, 2000).
FARMING SYSTEMS
Annual or multiple cropping is practised with occasional incorporation of one-year fallows, although the latter is becoming less common. Each year covers two cropping seasons. The main crops are maize and pulses, with millet and sorghum recommended as drought crops. Yields vary considerably between years depending on rainfall; on average maize will yield 1 tonne/ha, although some modern varieties yield 4 tonnes/ha of grain (Mbogoh, 2000).
The animal population is not large because it is difficult to supply adequate feed during periods of drought. Consequently, manure is in short supply and highly valued. Scarcity means that its application is often rotated. Little investment is made in the grazing lands, and the animals are usually kept in pens during the wet season. Very little fertilizer is used, especially as drought causes “burning” of the crops. Crop residues are burnt, fed to animals or ploughed into the soil. Tillage is accomplished by using simple ridging ploughs pulled by oxen; hand hoeing and digging are also common. Labour is in short supply and a constraint for farmers. A range of crop-residue management and tillage techniques are used to conserve moisture and to protect against soil erosion (Pretty, Thompson and Kiara, 1995; Gichuki, 2000).
Woodland is being cleared, although selective clearance is often practised to save those species that provide useful products. Most farmers also plant trees, especially fruit trees and others such as mulberry for silk production (Gichuki, 2000). The study villages lie along a gradient of precipitation, decreasing from Kymausoi through Kaiani and Darjani to Athi Kamunyuni. CENTURY was run to equilibrium using a grassland - tree scenario with grass fires every ten years and major fires every 30 years.
FIGURE 27 Total soil carbon for Darjani settlement (CENTURY)
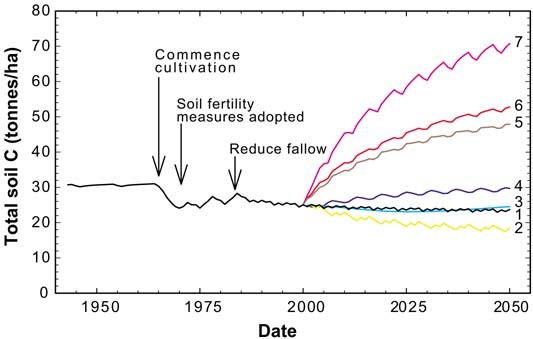
Scenarios described in Table 30.
TABLE 29
Total soil carbon for Darjani settlement
| Scenario* | CENTURY | RothC | ||||
| 2000 | 2050 | % change | 2000 | 2050 | % change | |
| (tonnes/ha) | (tonnes/ha) | |||||
| 1 | 25.04 | 23.74 | -5.2 | 34.57 | 34 | -1.6 |
| 5 | | 47.92 | 91.4 | | 59.3 | 71.5 |
| 6 | | 52.79 | 110.8 | | 65.67 | 90.0 |
* scenarios described in Table 30.
Source: CENTURY and RothC.
TABLE 30
Scenarios for modelling land management practices, Darjani settlement
| Scenario | Land management |
| 1 | Current practice |
| 2 | Remove fallow |
| 3 | Only inorganic fertilizer, burn residues, no fallow |
| 4 | Only inorganic fertilizer, burn residues, fallow |
| 5 | FYM 4.5 tonnes/ha/year, burn residues, fallow |
| 6 | FYM 4.5 tonnes/ha/year, do not burn residues, fallow |
| 7 | FYM 6.75 tonnes/ha/year, do not burn residues, fallow |
i. Darjani
The primary crops for this settlement are millet, sisal, cowpea and sorghum and the natural pasture can support low intensity grazing. Settlement took place in the 1960s. The average soil carbon content of bush soils is 37.6 ± 7.5 tonnes/ha, and for cultivated soils it is 33.7 ± 2.8 tonnes/ha (Mbuvi, 2000).
Once run to equilibrium, CENTURY gave a value for soil C of 31.0 tonnes/ha in 1964. This is just within the range expected for bush soils. The model was then run for a further 35 years, reproducing the current land management. This commenced with a six-year cycle of alternate maize and millet crops for four years followed by fallow for two years. Cultivation was accomplished using a steel ridging plough and hand weeding was included. Crop residues were burnt. In 1971, FYM additions commenced, averaging 1.5 tonnes/ha over the six-year cycle as soil fertility and conservation measures began to be adopted. In 1983, the fallow period was reduced to one year out of six, and by 2000 the modelled soil C was 24 tonnes/ha (Figure 27). This reduction of 7 tonnes/ha from the level modelled for the uncultivated bush soil is greater than the decline of 5 tonnes/ha measured in the field. Continuation of this landmanagement practice is predicted to lead to a further loss of 1.3 tonnes C/ha by 2050 (Figure 27 and Tables 29 and 30).
RothC was run to equilibrium using the current level of bush soil C and then used to predict the effect of land management using plant inputs calculated by CENTURY. RothC predicted soil C to be 34.6 tonnes/ha in 1999, which is within 1 tonne/ha of the measured value. In the next 50 years, RothC predicts a further decline of 0.6 tonnes C/ha (Table 29).
Effect of fallow removal
CENTURY predicts that removing the fallow from the current practice will result in a reduction in soil C (6.6 tonnes/ha) by 2050 (Scenario 2, Figure 27).
FIGURE 28 Average annual change in total soil carbon for Darjani settlement (CENTURY)
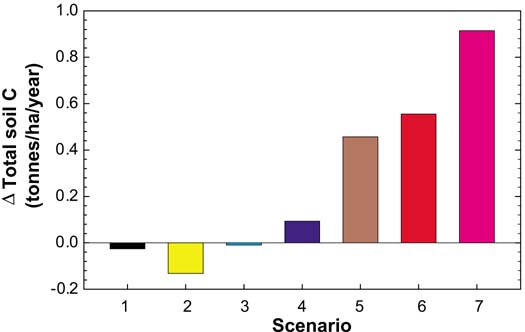
Scenarios described in Table 30.
FIGURE 29 Total soil carbon for Kaiani settlement (CENTURY)
Scenarios described in Table 31.
Effect of organic inputs
Adding an average 4.5 tonnes/ha/ year FYM over the 6-year croppingfallow cycle leads to a CS rate of 0.5 tonnes/ha/year (Scenario 5, Figure 28). If the crop residues are returned to the soil rather than burnt, a further 4.9 tonnes C/ha can be accumulated by 2050, representing a sequestration rate of 0.6 tonnes/ha/year (Figures 27 and 28). RothC predicts similar increases (Table 29). Increasing the FYM input to 6.75 tonnes/ha/year will increase the sequestration rate to 0.9 tonnes/ ha/year (Figure 28).
Effect of inorganic fertilizer
Replacing all organic inputs with inorganic fertilizer (100 kg N/ha/ year, Scenario 4) results in only a moderate increase in soil CS (0.09 tonnes/ha/year). However, the quantity of N applied is equivalent to about five times that which is added in FYM for the current practice scenario. If the fallow period is removed and only inorganic fertilizer added (Scenario 3), the system behaves very much like the current practice scenario in spite of the additional N.
Summary
The importance of FYM as an organic input is demonstrated, as is the return of crop residues to the soil rather than burning them. Although addition of inorganic fertilizer can increase CS, the increase in C per unit of N added is much less efficient than if FYM is added. The indirect energy embodied in manufactured N fertilizer is an additional carbon cost.
ii. Kaiani
The settlement of Kaiani has a farming system similar to that at Darajani. CENTURY underestimated the current bush content of soil C, yielding nearly 32 tonnes/ha compared with measured values of 41.5 ± 3.1 tonnes/ha. CENTURY was then run with a scenario to reflect the last 40 years of cultivation using a millet - cowpea system with grazing of plant residues and 4.5 tonnes/ha manure applied once in the six-year cycle. There was one year of fallow. Cultivation is calculated to have reduced soil C to 28.1 tonnes/ha by 2000, which compares with a measured value for cropped soil of 30.5 ± 4.8 tonnes/ha. Soil C is then predicted to decrease by slightly more than 1 tonne/ha in the next 50 years (Figure 29, Tables 31 and 32).
TABLE 31
Total soil carbon for Kaiani settlement
| Scenario* | CENTURY | RothC | ||||
| 2000 | 2050 | % change | 2000 | 2050 | % change | |
| (tonnes/ha) | (tonnes/ha) | |||||
| 1 | 28.07 | 26.81 | -4.5 | 42.32 | 43.89 | 3.9 |
| 2 | | 41.4 | 47.5 | | 62.82 | 48.8 |
| 3 | | 42.73 | 52.2 | | 65.16 | 54.3 |
*Scenarios described in Table 32.
Source: CENTURY and RothC.
TABLE 32
Scenarios for modelling land management practices, Kaiani settlement
| Scenario | Land management |
| 1 | Current practice |
| 2 | FYM 2 tonnes/ha/year |
| 3 | FYM 2 tonnes/ha/year, plant residues 0.3 tonnes/ha/year |
FIGURE 30 Average annual change in total soil carbon for Kaiani settlement (CENTURY)
Scenarios described in Table 32.
TABLE 33
Total soil carbon for Kymausoi settlement
| Scenario* | CENTURY | RothC | ||||
| 2000 | 2050 | % change | 2000 | 2050 | % change | |
| (tonnes/ha) | (tonnes/ha) | |||||
| 1 | 17.76 | 16.82 | -5.3 | 35.69 | 34.79 | -2.5 |
| 2 | | 20.18 | 13.6 | | 43.4 | 21.6 |
| 3 | | 27.7 | 56.0 | | 58.86 | 64.9 |
*Scenarios described in Table 34.
Source: CENTURY and RothC.
After parametization with the carbon content for bush soils, RothC shows very little effect of cultivation when using plant inputs calculated by CENTURY. Unlike CENTURY, this model predicts a slight rise in soil C by 2050 (Table 31).
Effect of organic inputs
Modest increases in the application rate of FYM (0.75 tonnes/ha/year to 2 tonnes/ha/year) result in quite marked accumulation of soil C (Figures 29 and 30). Adding additional plant residues further increase the sequestration rate to 0.3 tonnes/ha/year. RothC predicts very similar proportional increases in soil C (Table 31).
Summary
The models suggest that the current system is at or near steady state. It is possible to achieve reasonable rates of CS (0.3 tonnes/ha/year) with modest increases in organic manure inputs.
iii. Kymausoi
Kymausoi is situated in a marginal cotton zone where maize, pigeon pea and sisal are also grown. Cattle ranching is practised and the village was settled in the 1950s. The average soil carbon content for bush soils here is 38.4 ± 4.8 tonnes/ha, while for cultivated soils the average is 33.5 tonnes/ha with a range of 17.4 - 38.9 tonnes/ha. The CENTURY agro-ecosystem model was run to equilibrium and gave a bush soilcarbon level of 28.5 tonnes/ha in 1955, which is below the average concentration for soils in this area.
The model was then run to reflect the farming system since settlement commenced. This includes continuous maize cropping with grazing of the crop residues, and an average manure application rate of 0.75 tonnes/ha/ year. Soil conservation and fertility management commenced in the late 1960s, the average annual manure application rate being increased to 1 tonne/ha to reflect this. CENTURY estimated soil C to be 17.8 tonnes/ha by 2000, which is at the lower end of measured values. A decline of less than 1 tonne C/ha is predicted to occur in the next 50 years.
TABLE 34
Scenarios for modelling land management practices, Kymausoi settlement
| Scenario | Land management |
| 1 | Current practice |
| 2 | Plant residues 0.3 tonnes/ha/year |
| 3 | FYM 1.5 tonnes/ha/year, plant residues 0.6 tonnes/ha/year |
| 4 | FYM 1.5 tonnes/ha/year, plant residues 0.6 tonnes/ha/year, legume (cowpea) |
| 5 | FYM 2 tonnes/ha/year, plant residues 0.6 tonnes/ha/year, legume (cowpea) |
| 6 | FYM 4 tonnes/ha/year, plant residues 0.6 tonnes/ha/year, legume (cowpea) |
FIGURE 31 Total soil carbon for Kymausoi settlement (CENTURY)
Scenarios described in Table 33.
TABLE 35
Total soil carbon for Athi Kamunyuni settlement
| Scenario* | CENTURY | RothC | ||||
| 2000 | 2050 | % change | 2000 | 2050 | % change | |
| (tonnes/ha) | (tonnes/ha) | |||||
| 1 | 23.75 | 23.45 | -1.3 | 29.68 | 28.29 | -4.7 |
| 2 | | 29.09 | 22.5 | | 31.40 | 5.8 |
| 3 | | 29.77 | 25.3 | | 42.76 | 44.1 |
*Scenarios described in Table 36
Source: CENTURY and RothC.
After being run to equilibrium for current bush soils and then parametized with plant inputs from CENTURY, RothC calculated a reduction of 3.4 tonnes/ha in soil C resulting from cultivation. Like CENTURY, it suggests a further decline of less than 1 tonnes/ha by 2050 (Tables 33 and 34).
Effect of organic inputs
Adding additional plant residues and increasing the FYM application rate to 1.5 tonnes/ha/year (Scenarios 2 and 3) will increase soil carbon levels by at least 50 percent (Table 33).
Effect of legume crop
Introducing a leguminous crop into the system, such as cowpea, can make a significant improvement in CS (Scenarios 4 - 6, Figures 31 and 32), increasing the rate from 0.2 to 0.3 tonnes/ha/year at the same rates of FYM application.
Summary
This example illustrates the advantage of including leguminous crops in the rotation. A farm system using 4 tonnes/ha/year of FYM, maintaining plant residues in the field, and with a legume in the rotation, can accumulate 0.7 tonnes/ ha/year. The current practice is reducing soil carbon stocks.
iv. Athi Kamunyuni
This village is situated in a lowland agro-ecological zone. Ranching will only support a very low grazing density and the area is at the limit for rainfed production of millet, cowpea and sisal. The village was established in the 1970s. CENTURY was parametized for the commencement of cropping/grazing during the last 30 years. Millet was grown and an average of 0.75 tonnes/ha manure applied during the last six years.
The value for soil C modelled by CENTURY matched the current bush level (33.2 ± 3.2 tonnes C/ha). When settlement commenced, CENTURY calculated a decline in soil C of some 9 tonnes/ha over 25 years. Again, this is close to the actual measurements that show cultivated soils on average contain 24.0 ± 3.0 tonnes C/ha. Continuing this scenario into the twenty-first century suggests that the system has almost reached a new steady state (Figure 33). RothC calculates a smaller effect of cultivation on soil C, predicting a value of 29.7 tonnes C/ ha in 2000, and a slight decline over the next 50 years (Tables 35 and 36).
TABLE 36
Scenarios for modelling land management practices, Athi Kamunyuni settlement
| Scenario | Land management |
| 1 | Current practice |
| 2 | Grazing |
| 3 | FYM 1.25 tonnes/ha/year |
| 4 | FYM 2.25 tonnes/ha/year |
| 5 | FYM 2.27 tonnes/ha/year, fallow reduced to 1 year |
| 6 | FYM 3.3 tonnes/ha/year |
| 7 | FYM 3.9 tonnes/ha/year, plant residues 0.3 tonnes/ha |
FIGURE 32 Average annual change in total soil carbon for Kymausoi settlement (CENTURY)
Scenarios described in Table 34.
FIGURE 33 Total soil carbon for Athi Kamunyuni settlement (CENTURY)
Scenarios described in Table 35.
Effect of organic inputs
Increasing the current average application rate of FYM from 0.75 tonnes/ha/year to 1.25 or 2.25 tonnes/ha/year (Scenarios 3 and 4) increases rates of CS by 0.12 - 0.37 tonnes/ha/year (Figures 33 and 34). Further additions of organic inputs, if available, could yield an increase in CS rates of up to 0.6 tonnes/ha/year.
Effect of fallows
Reducing the fallow period from two years to one year (Scenario 5) has very little effect on soil C providing the organic inputs are maintained. Using this location solely for ranching would result in an increase in soil C as the system returned to similar conditions that existed before cultivation commenced (Scenario 2). The rate of CS is very similar to Scenario 3, where an average of 1.25 tonnes/ha FYM was added annually. RothC predicts a much smaller increase in soil C on return to ranching. This reflects the fact that this model initially calculated a much smaller decline in total soil C following the commencement of cultivation.
Summary
The level of soil C in this recently settled system could be restored to pre-settlement levels and then raised higher by the addition of FYM. Conditions at this location are not ideal for cropping and a return to a grazing-only system should also restore soil C to its pre-settlement level.
Figure 34 Average annual change in total soil carbon for Athi Kamunyuni settlement (CENTURY)
Scenarios described in Table 36.
Conclusions from Kenya cases
The modelling of farm data from four communities in the semi-arid Makueni District again shows that carbon stocks can increase when a variety of technologies and practices already available to farmers are used.
Modest inputs of organic material in the form of FYM and plant residues can lead to CS, particularly where systems are currently at or near steady state for soil carbon stocks.
Removal of fallow periods from existing systems results in losses of 0.1 tonnes C/ha/year. Inorganic fertilizers are again an inefficient choice for plant nutrients when soil C is a concern. Burning plant residues is not desirable.
The combination of legumes in rotations, 2 - 4 tonnes/ha/year of FYM in addition to 0.6 tonnes/ha/year of plant residues, results in the highest rate of CS in all the dryland cases - 0.7 tonnes C/ha/year. At lower levels of FYM but with maintenance of fallows, combined with legumes in rotation, increases in soil C of 0.3 - to 0.4 tonnes/ha/year can be achieved.
In recent years, Argentina has experienced a rapid growth in the adoption of reduced and no-tillage systems, especially in dryland regions. This change has been brought about by a deterioration in soil quality and associated crop yields. Many local soils are not suited to the heavy tillage and cropping practices introduced by European settlers.
The Argentine Pampa now has very little natural vegetation. Xerophitic vegetation such as Prosopis algarrobilla and Larrea divaricata can still be found in the most arid areas. Agricultural practices commenced with the arrival of colonists in the sixteenth century. Ungulates were introduced to graze the grasslands, which have now been mostly re-sown. Very few trees remain except around farmsteads. Wheat was initially cultivated and row-crop production has increased with time. In many parts, grazed pasture was dominant until the 1990s but since then there has been a marked increase in the cultivation of summer annuals, such as maize, sunflower and soybean (Diaz-Zorita, Duarte and Grove, 2002). The Argentine Pampa has been recognized as a region with potential for increased production, if soils can be improved (Alvarez, 2001).
Crop yields have declined in many areas. These declines have been correlated closely with a reduction in SOM content (Diaz-Zorita, Duarte and Grove, 2002). This has prompted the need for change in existing land-management practices. The negative effects of heavy tillage on SOM led to the commencement of no-tillage experiments in the 1960s, in an attempt to produce a more sustainable agricultural system. Now some 13 million ha, or about half of the agricultural area in Argentina, is under some form of reduced-tillage system. Fertilization of crops is primarily achieved through the use of inorganic fertilizers, with organic material tending to be conserved for use in horticultural farming systems.
NO-TILLAGE MODELLING STUDIES
Three case studies are reviewed to model soil C under a variety of conventional and no-tillage systems in Tucuman, Catamarca and Cordoba Provinces.
i. Monte Redondo, Tucuman Province
This is a semi-arid area that naturally supports xerophitic vegetation. The agricultural practices include grazed prairie lands and row cropping, the two systems often being rotated. The studied site consists of cropping for seven years followed by four years of prairie grassland. The crop sequence is wheat/soybean, maize, soybean, wheat/ soybean, maize, soybean, wheat, and four years of prairie. Both conventional tillage and no-tillage cultivation are practised. In the tillage system, disc and chisel plough are used for soil preparation, while the no-tillage system uses the same cropping sequence without tillage.
After an equilibrium phase of grassland and trees, with fire every 60 years, CENTURY was parametized to run with improved prairie grassland from the midnineteenth century. The model predicts that the prairie system is losing C at the rate of 0.06 tonnes/ha/year under the current regime, but at stocks of 55.4 tonnes C/ha, it is overestimating the current measured level of 48.8 tonnes C/ha.
Cultivation is scheduled to commence in the 1950s (Figure 35). Fertilizer applications of 110 kg/ha urea begin in 1980. Two scenarios compare the effect of conventional tillage with that of no-tillage. The model predicts a consistent difference between the two systems of less than 3 tonnes C/ha. This is less than the difference of 6 tonnes C/ha currently measured in the field. CENTURY predicts that this difference between the two systems will be maintained into the future, although both systems continue to lose soil C. The pattern of fall and rise in the soil C curve occurs because the crop part of the rotation results in soil C loss, while the return to prairie increases soil C.
FIGURE 35 Total soil carbon for Monte Redondo (CENTURY)
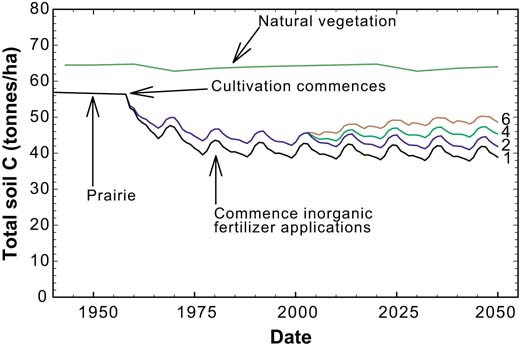
Scenarios described in Table 37.
TABLE 37
Total soil carbon for Monte Redondo
| Scenario* | CENTURY | RothC | ||||
| 2000 | 2050 | % change | 2000 | 2050 | % change | |
| (tonnes/ha) | (tonnes/ha) | |||||
| Prairie | 55.40 | 54.50 | -1.6 | 43.95 | 43.21 | -1.7 |
| Tillage | 40.43 | 39.27 | -2.9 | 32.57 | 27.58 | -15.3 |
| No-tillage | 43.64 | 42.23 | -3.2 | 35.33 | 33.58 | -5.0 |
| 5 | | 48.23 | 4.4 | | 41.89 | 18.6 |
*Scenarios described in Table 38.
Source: CENTURY and RothC.
TABLE 38
Scenarios for modelling land management practices, Monte Redondo
| Scenario | Land management |
| 1 | Conventional tillage, inorganic fertilizer |
| 2 | No-till, inorganic fertilizer |
| 3 | No-till, FYM 1.5 tonnes/ha/year, inorganic fertilizer |
| 4 | No-till, green manure 10 tonnes/ha/crop, inorganic fertilizer |
| 5 | No-till, FYM 1.5 tonnes/ha/year, green manure 10 tonnes/ha/crop, no inorganic fertilizer |
| 6 | No-till, FYM 3.3 tonnes/ha/crop, no inorganic fertilizer |
RothC calculates lower levels of soil C but predicts a greater differential of 6 tonnes/ha by 2050, mainly through a higher loss of C from the tilled system (Tables 37 and 38).
Effect of no-tillage and organic additions
Additions of green manure (10 tonnes/ha/crop) or FYM (1.5 tonnes/ha each cropping year) to the no-tillage system both lead to increases in CS (Scenarios 3 and 4; 0.029 - 0.034 tonnes/ha/year) (Figure 36). A combination of these inputs without inorganic fertilizer yields a similar result (Scenario 5).
Cessation of inorganic fertilizer usage and using FYM as a replacement source of N results in the highest rate of CS (Scenario 6), 0.1 tonnes/ha/year (Figure 36).
Summary
Both models register the improvement that no-tillage has on soil carbon content. However, if the decline in soil carbon content is to be reversed, additional inputs of organic matter are required - either from FYM or use of green manures in the rotation. An increase in prairie in the rotation will also increase soil carbon stocks.
ii. Santa María River Valley, Catamarca Province
This is an arid region, with mean annual rainfall of 400 mm and temperatures in the ranging of 7 - 32 °C. The native vegetation is xerophitic consisting of creosote bush scrub (Larrea divaricata) and trees such as Prosopis algarrobilla. In cultivated areas, vines are grown and crops include alternate plantings of red pepper and barley. Measured soil carbon stocks are high in this district at 3.9 percent.
FIGURE 36 Average annual change in total soil carbon for Monte Redondo (CENTURY)
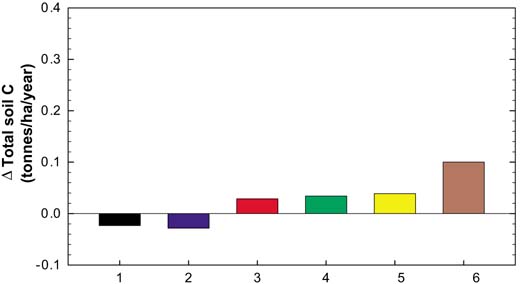
Scenarios described in Table 38.
FIGURE 37 Total soil carbon for Santa Maria (CENTURY)
Scenarios described in Table 40.
TABLE 39
Total soil carbon for Santa Maria
| Scenario* | CENTURY | RothC | ||||
| 2000 | 2050 | % change | 2000 | 2050 | % change | |
| (tonnes/ha) | (tonnes/ha) | |||||
| Prairie | 37.11 | 35.75 | -3.7 | 70.68 | 74.71 | 5.7 |
| Tillage | 21.39 | 18.11 | -15.3 | 51.46 | 47.36 | -8.0 |
| No-tillage | | 24.00 | 12.2 | | 53.53 | 4.0 |
| 3 | | 30.49 | 42.5 | | 58.71 | 14.1 |
* Scenarios described in Table 40.
Source: CENTURY and RothC.
After reaching equilibrium with natural vegetation, CENTURY was run with a prairie scenario from the mid-nineteenth century and cultivation commenced in the late 1950s using conventional tillage (disc plough). A cotton - barley rotation commenced in 1980. CENTURY calculates that soil C had decreased to two-thirds of its initial value by 2000 (Figure 37). Measurements in the region confirm declines in soil C in cultivated areas of 33 - 66 percent. Therefore, the model estimate is at the top of this range. However, the system is predicted to reach a new steady state and the decline in soil C is estimated to be 3 tonnes/ha over the next 50 years.
RothC, parametized with the higher, measured level of soil C and using quantities of plant inputs calculated from CENTURY shows a proportionately smaller effect of the current cultivation practice on soil C (Tables 39 and 40).
Effect of no-tillage
Adopting a no-tillage system not only halts the loss of soil C predicted by CENTURY. It also leads to a low sequestration rate of 0.05 tonnes/ha/ year in the next 50 years (Figures 37 and 38). The RothC model is less sensitive to this scenario (Table 39).
Effect of organic additions
Additions of FYM and green manure (Scenarios 3 and 5) both lead to marked increases in CS rates of 0.18 - 0.25 tonnes/ha/year (Figures 37 and 38). RothC again shows a smaller effect (Table 39).
Effect of inorganic fertilizer
Replacing inorganic fertilizer with FYM (Scenario 4) promotes CS (0.22 tonnes/ha/year). Combining the green manure and FYM applications gives the best carbon accrual rate, 0.29 tonnes/ha/year (Scenario 6, Figures 37 and 38). Inorganic N fertilizer is inefficient owing to the high energy cost of manufacture.
FIGURE 38 Average annual change in total soil carbon for Santa Maria (CENTURY)
Scenarios described in Table 40.
TABLE 40
Scenarios for modelling land management practices, Santa Maria
| Scenario | Land management |
| 1 | Conventional tillage, inorganic fertilizer |
| 2 | No-till, inorganic fertilizer |
| 3 | No-till, FYM 1.5 tonnes/ha/year, inorganic fertilizer |
| 4 | No-till, FYM 3.3 tonnes/ha/crop, no inorganic fertilizer |
| 5 | No-till, green manure 10 tonnes/ha/crop, inorganic fertilizer |
| 6 | No-till, FYM 1.5 tonnes/ha/year, green manure 10 tonnes/ha/crop, no inorganic fertilizer |
FIGURE 39 Total soil carbon for rotated and non-rotated plots (CENTURY)
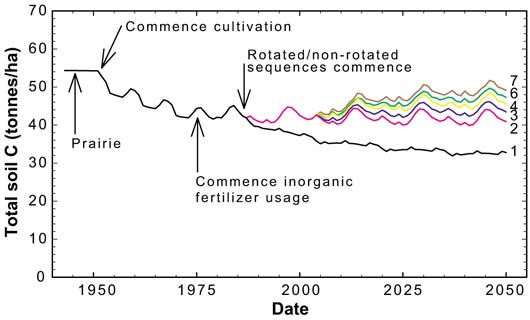
Scenarios described in Table 42.
Summary
Both models suggest that adopting no-tillage will halt the decline in soil C. However, to increase CS, higher organic additions are necessary (green manures and FYM), which can be used to replace the inorganic fertilizer applications.
iii. Cordoba Province, Buenos Aires Province, and La Pampa Province
Following an equilibrium period with natural vegetation and subsequent prairie conditions from the mid-1800s, CENTURY was parametized with a cultivation regime commencing in the 1950s. This included a fouryear cropping (wheat - soybean - maize - soybean) and a four-year prairie cycle with inorganic fertilizer applications (100 kg/ha urea) starting in 1985. In 1987, a rotated and a nonrotated cropping system was applied that is similar to cultivation practices occurring in the field. The rotated crop sequence was winter forage - soybean - maize - soybean - wheat - soybean - maize - four years of prairie and winter forage - wheat - soybean - maize - soybean - maize - prairie. The non-rotated crop sequence was similar but without the prairie interludes.
Modelled results for the nonrotated crop system show an initial steep fall in soil C to 37 tonnes/ha in 2000 and further losses over subsequent years (Figure 39). RothC estimates a proportionately larger fall from a higher base (Tables 41 and 42). The rotated crop - prairie system does not show the same sharp decline in soil C as the nonrotated system did and oscillates around a level of slightly more than 40 tonnes/ha (Figure 39). However, RothC estimates a slightly larger proportionate decline in C for the rotated crop system. Both models calculate smaller differences between the rotated and non-rotated cropping systems in 2000 compared with the difference of 8.5 tonnes/ha measured in the field.
FIGURE 40 Average annual change in total soil carbon for rotated and non-rotated plots (CENTURY)
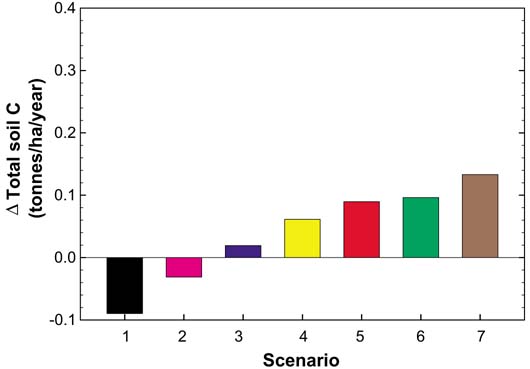
Scenarios described in Table 42.
TABLE 41
Total soil carbon for rotated and non-rotated plots, modeled with CENTURY and RothC
| Scenario* | CENTURY | RothC | ||||
| 2000 | 2050 | % change | 2000 | 2050 | % change | |
| (tonnes/ha) | (tonnes/ha) | |||||
| Non-rotated plots | 37.22 | 32.74 | -12.0 | 50.61 | 41.17 | -18.7 |
| Rotated plots | 42.47 | 40.91 | -3.7 | 54.62 | 49.53 | -9.3 |
| 4 | | 45.54 | 7.2 | | 62.86 | 15.1 |
*Scenarios described in Table 42.
TABLE 42
Scenarios for modelling land management practices, Santa Maria
| Scenario | Land management |
| 1 | Non-rotated plots, inorganic fertilizer |
| 2 | Rotated plots, inorganic fertilizer |
| 3 | Rotated plots, no-till, inorganic fertilizer |
| 4 | Rotated plots, no-till, FYM 1.5 tonnes/ha/year, green manure 10 tonnes/ha/crop, no inorganic fertilizer |
| 5 | No-till, FYM 1.5 tonnes/ha/year, inorganic fertilizer |
| 6 | No-till, green manure 10 tonnes/ha/crop, inorganic fertilizer |
| 7 | No-till, FYM 3.3 tonnes/ha/crop, no inorganic fertilizer |
Effect of no-tillage
The adoption of a no-tillage regime for the rotated-plots system increases soil C by 2.5 tonnes/ha in the next 50 years, representing a CS rate of 0.02 tonnes/ha/year (Figure 40). The rate increases to about 0.1 tonnes C/ ha/year if green manures and FYM are used instead of fertilizers.
Effect of organic inputs
Additions of green manure and FYM with or without inorganic fertilizer can lead to CS rates of 0.06 - 0.13 tonnes/ha (Figures 39 and 40). Organic material can replace inorganic fertilizer successfully.
Summary
The inclusion of prairie interludes in the cropping system is an important factor for reducing the decline in soil C. However, the models show that no-tillage and organic inputs are required if C is to be sequestered in this system.
Conclusions from Argentina cases
The modelling of farm data from three dryland provinces of Argentina shows that carbon stocks have fallen substantially since the prairies were opened up for cultivation. At all three locations, there have been sharp falls in soil carbon stocks, with losses of about 15 tonnes/ha. However, the adoption of no-tillage systems in recent years has halted these declines and, on their own, resulted in small annual increases in soil C of the order of 0.02 tonnes/ ha/year. Rotations with significant periods for return to prairie grassland (e.g. 4 years in 11) result in further increases in soil C.
The highest rates of sequestration (0.1 - 0.25 tonnes/ha/year) occur when no-tillage systems also include cultivation of green manures and additions of FYM.
FIGURE 41 CENTURY model simulation with a historic scenario based on undisturbed savannah grasslands to the current condition and the impact of selected management practices on soil and tree C, 2002 - 2050
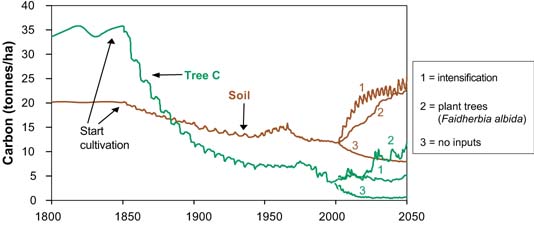
Source: Tschakert (2004b).
The Senegal study area, the “Old Peanut Basin”, is located in the west-central part of the country. The climate is semi-arid with annual precipitation ranging of 350 - 700 mm. Almost all arable land is used for rainfed agriculture, with millet, groundnuts, sorghum and cowpea as major crops. The rainy season usually lasts from July to September/October. However, both spatial and temporal variation in rainfall are high and episodic crop failures are not uncommon. The natural vegetation, including Faidherbia albida and various other tree species, has become heavily degraded, primarily because of a long agricultural history and increasing population pressure.
As described in Tschakert (2004b), CENTURY model simulations suggest that soil C in the study area decreased from 20.1 tonnes C/ha under a native savannah environment in 1851 to 11.9 tonnes C/ha in 2001. This indicates an annual loss of soil C of 0.055 tonnes C/ha/year. Tree C declined from 33.6 tonnes/ha to 4.2 tonnes/ha, corresponding to an annual decrease of 0.2 tonnes C/ha/year.
Under improved management conditions (assuming a 50 - year period), soil C could increase by 0.3 - 13.5 tonnes/ha, or 0.006 - 0.27 tonnes/ha/year. C gains in trees could be tripled (from 4.2 to 11.8 tonnes/ha), assuming a conversion of croplands to grassland - tree plantations. Given the fact that most of the C gains are achieved in the first 25 years, annual increases for this time period range from 0.02 to 0.43 tonnes C/ha/year, which is higher than the estimates provided by Lal, Hassan and Dumanski (1999). Under poor management, in this case an annual millet - sorghum rotation with no inputs and permanent browsing and pruning of tree resources, both soil and tree C continue to drop, reaching an absolute minimum level of 7.9 tonnes/ha and 0.6 tonnes/ ha, respectively (Figure 41).
Table 43 lists the various improved management practices with the anticipated changes in soil C over two time periods (2002 - 2026 and 2027 - 2050) as discussed by Tschakert (2004b). As illustrated, considerably higher gains in soil C can be achieved in the first 25 years, except for the tree-plantation scenario. However, in some cases, these gains cannot be sustained in the second twenty 25-year period, and losses would have to be expected if no additional inputs occurred. This is particularly true for the fallow scenarios.
TABLE 43
Effects of land management practices or land use on carbon sequestration potential in the Old Peanut Basin, Senegal
| Technological options* | Change in soil C (tonnes/ha/year) 2001 - 2026 (first 25 years) | Change in soil C (tonnes/ha/year) 2027 - 2050 (second 25 years) |
| Compost (2t) | 0.02 | -0.01 |
| Conversion of croplands to grasslands + grazing | 0.06 | 0.02 |
| 3-year fallow + 2 tonnes manure in rotation with 4 years cropping | 0.14 | -0.05 |
| Cattle manure (4 tonnes) | 0.10 | 0.01 |
| Conversion of croplands to grasslands | 0.17 | 0.04 |
| Cattle manure (4 tonnes) + min. fertilizer (250kg on millet; 150kg on | 0.12 | 0.01 |
| groundnuts) | | |
| Sheep manure (5 tonnes) | 0.13 | 0.01 |
| 3-year fallow + Leucaena prunings (2 tonnes) in rotation with 4 years | 0.18 | -0.05 |
| cropping | | |
| Conversion of croplands to grasslands with tree protection | 0.10 | 0.04 |
| Sheep manure (10 tonnes) | 0.17 | 0.01 |
| 10-year fallow + 2 tonnes manure in rotation with 6 years cropping | 0.25 | -0.04 |
| 10-year fallow + Leucaena prunings (2 tonnes) in rotation with 6 years cropping | 0.25 | -0.04 |
| Conversion of croplands to grasslands + tree plantation (Faidherbia albida) | 0.23 | 0.21 |
| Agricultural intensification (improved millet, manure, Leucaena prunings, min. fertilizer, animal traction, 1-year fallow) | 0.43 | 0.11 |
*All technological options calculated for 1 ha. Annual rotation between millet and groundnuts for cropping scenarios.
Source: Tschakert (2004b).
The study was undertaken in Northern Kordofan Province in the Sudan, an area dominated by coarse-textured soils of Aeolian origin, locally named Qoz. The study site is representative in terms of soils, climate and vegetation type for a large region stretching from the Atlantic coast to the Ethiopian highlands (Olsson and Ardö, 2002; Olsson and Tschakert, 2002).
The climate is semi-arid with annual rainfall ranging from less than 200 mm in the north to about 350 mm in the south. Land use can be characterized as a gradual increase in intensity with rainfall. In the northern part, only very extensive grazing by camels is possible owing to the lack of permanent water sources. Cultivation of mainly millet and to a lesser extent sesame and groundnuts predominates where rainfall and water resources increase towards the south. Grazing by cattle, sheep and goats is also an important factor in the cultivated parts of the area.
FIGURE 42 Land-use change scenarios for the Sudan case study
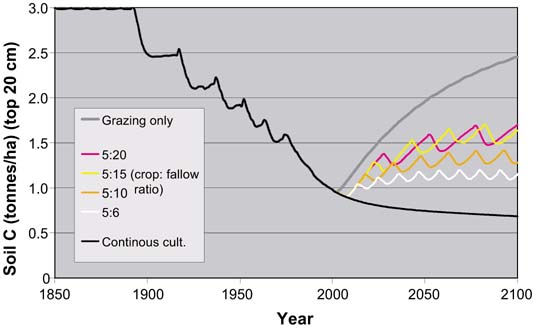
Source: Olsson and Ardö (2002).
Interviews and literature indicate that land-use practices have changed markedly from a rotation system with long fallow periods (15 - 20 years), interspersed with short periods of cultivation (4 - 5 years), to more continuous cultivation in the last three to four decades. In the same period, crop yields have decreased, mainly because of a marked decline of rainfall but to some extent also due to the abandonment of fallow periods. Increased demand for food (as a result of population increase) combined with decreasing yields has forced farmers to extend their cultivated area primarily by reducing fallow periods.
In order to investigate the potential for increasing the soil carbon content through land-management changes, a number of future scenarios were simulated. First, the equilibrium level was established by running the model for 2 000 years with no land use, and then six different land-management scenarios were simulated for the period 2000 - 2100. The land-management scenarios were: continuous cultivation, crop-tofallow ratios of 5:6, 5:10, 5:15, 5:20, and no cultivation but only grazing. Figure 42 presents the results of the simulations.
While the results in Figure 41 come from model simulations, the results in Figure 42 show the result of empirical research, using soil sampling, linking fallow periods to increased levels of SOC. In order to investigate the role of the length of fallow periods, fields in different stages of the crop rotation were sampled and their corresponding SOC levels were determined (Olsson and Ardö, 2002). The graph verifies to a large extent the model results and shows that there is significant potential for increasing SOC even in these dry sandy soils.
FIGURE 43 SOC in relation to fallow and cultivation history in fields in Northern Kordofan Province in the Sudan
Source: Olsson and Ardö (2002).
Figure 43 shows that increasing the length of the fallow periods, i.e. decreasing the crop - fallow ratio, causes an increase in the soil carbon content proportional to the ratio (i.e. longer fallow more soil C). A landuse change from millet cultivation to grazing is estimated to increase the soil carbon content from about 1.5 tonnes/ha to 2.5 tonnes/ha in 100 years. This is 82 percent of the equilibrium phase prior to millet cultivation. If millet cultivation is continued into the future, a further decrease in the soil carbon content is expected to 0.68 tonnes/ha in 2100. Changing the continuous cultivation to crop - fallow ratios of 5:6, 5:10, 5:15 and 5:20 will increase the soil carbon content according to Figure 42 to 1.15, 1.28, 1.63 and 1.70 tonnes/ha, respectively, by 2100.
![]()
![]()
![]()