![]()
![]()
![]()
Together with water availability and the absence of weeds, pests and diseases, soil fertility is the most important biophysical yield-determining factor. In the tropics, soils are generally older and poorer than in the Northern Hemisphere. This holds particularly for the vast erosional plains of Africa. In many places, the already low level of fertility tends to decline further as farmers generate many nutrient outputs in crops and through processes such as leaching and erosion without applying matching inputs in the form of fertilizers, manure and biological nitrogen fixation (BNF). Countries following structural adjustment programmes have abolished subsidies on fertilizers, resulting in a significant reduction in their use on staple food crops. For cash crops, fertilizer use depends principally on world market prices, which respond to supply and demand management and attitudes towards market protection.
In the past ten years, much attention in sub-Saharan Africa (SSA) has focused on the quantification and estimation of nutrients that enter and leave agricultural systems. The balance between these nutrient inputs and outputs shows whether the agricultural system is a net gainer or a net loser of soil fertility. An FAO-commissioned macroscale study (Stoorvogel and Smaling, 1990) showed nitrogen (N), phosphorus (P) and potassium (K) balances for land-use systems and country scales, and revealed that soil fertility in Africa is following a downward trend. Densely populated and hilly countries in the Rift Valley area (Kenya, Ethiopia, Rwanda and Malawi) have the most negative values, because of a high ratio of cultivated land to total arable land, relatively high crop yields and soil erosion.
The study triggered numerous case studies at plot, farm and village levels with different degrees of sophistication. Some studies focused on the measurement of some flows, others on the linkage between nutrient balance and farm household economic performance, and others on participatory learning and action towards improving soil fertility and its management. The results are available in books, special issues of journals (e.g. Buresh et al., 1997; Smaling, 1998; Smaling et al., 1999; Hilhorst and Muchena, 2000; Scoones, 2001; Tian et al., 2001; Vanlauwe et al., 2002), M.Sc. and Ph.D. theses, a ‘toolbox’ and a Web site (http://www.nutmon.org). The body of knowledge has grown significantly, but the linkage to soil fertility policies is modest (Scoones and Toulmin, 1999). Currently suggested ‘best bets’ and ‘best practices’ stem more from local experiences rather than from a thorough constraint analysis. Policies for soil fertility and its management evolve mainly at national and subnational levels.
There is a need to develop entry points at a level lower than ‘continent’ and ‘country’. A country soil-fertility map shows areas with richer and poorer soils, but provides no clues for the mesolevel stakeholder and the farmer. Nor do such maps show diversity at farm level. The present study hypothesizes that between country level (macrolevel) and farm level (microlevel) there is an important mesolevel, where facilitation of production can take place, and where the private sector may invest in a commodity or a production system. Therefore, the evaluation of soil fertility and the manipulation of the nutrient flows, i.e. integrated nutrient management (INM), should take place at three relevant spatial scales, which are also stakeholder-specific scales.
This study uses three scale levels: macrolevel, mesolevel and microlevel. These scale levels are not fixed, but provide an indication of the order of magnitude. This study defines the macrolevel as the nation, but it can also refer to a continental or global farming-system level (FAO, 2001b). The macrolevel nutrient balance calculation uses data that are available for each country, such as FAOSTAT data and global geographical information system (GIS) data sets. This makes the approach applicable in principle for each country. The mesolevel coincides with the level of the province, district or agro-ecological zone (AEZ). This study defines the mesolevel as an agro-economic rather than a geographical entity, e.g. cotton-based or dairy-based farming systems. Such units often have a commercial component that allows for intensification and expansion. Farm-level studies have revealed that a cash economy component in farming systems tends to drive soil fertility management, and constitutes a suitable entry point for policy and private-sector intervention. Finally, this study defines the microlevel as the farm or village level, but it can extend to the nutrient management group or gender.
The innovation in this report is the introduction of a mesolevel, and the hypothesis is that it adds value to the current macrolevel and microlevel knowledge. However, mesolevel data originate largely from macrolevel and microlevel data because most studies and data are available at these scales. Hence, it is necessary to apply procedures to disaggregate national data in order to show spatial variability within a country. At the same time, it is also necessary to aggregate results from studies at the farm level without crude averaging and without neglecting variability in complex farming systems.
A nutrient balance for a ‘system’ consists of the sum of nutrient inputs minus the sum of nutrient outputs. This system always represents a particular spatial scale, and it can range from a small soil aggregate to the entire globe.
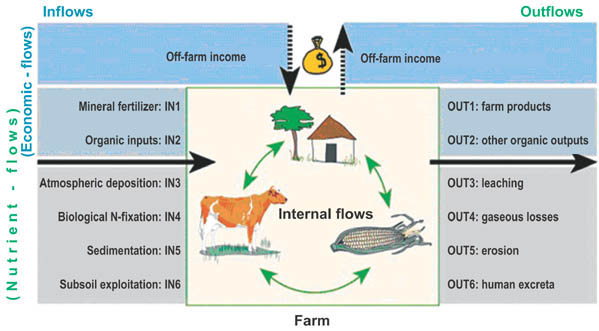
Figure 1 shows the possible nutrient flows that could influence a nutrient balance. Flows IN1 and OUT1 and, to a lesser extent, IN2 and OUT2 are so-called ‘easy flows’ because they are relatively easy to measure or calculate, and it is possible to express their values in monetary terms. The other flows are ‘difficult flows’, not normally measured on a routine basis, and less easily retrievable from land and agricultural statistics. Moreover, economic assessments seldom consider their physical or off-site effects. This report considers flows IN6 and OUT6 only at the microlevel. At higher scale levels, IN6 is too difficult to capture, and OUT6 would lead to double counting, as all nutrients in harvested products count as OUT1. It is possible to calculate a nutrient balance for each scale level. However, as data limitations between levels are different, calculation procedures also differ. This study considered all scale levels only in terms of N, P and K. Where data sets expressed P and K in terms of P2O5 and K2O, the values were divided by 2.3 and 1.2 respectively.
|
FIGURE 1
|
Source: after De Jager et al. (1998).
Determining a nutrient balance has its shortcomings. First, it shows the results of a static input-output balance, but it does not take changes in nutrient stocks into account. Second, the application is data intensive. Third, given the large diversity between farms, sampling methodology, sample density, and representativeness become issues in how to aggregate farm-level results to a subnational or national level. Nutrient flows may provide a useful tool for farmer understanding of soil management problems, but interventions still need to be profitable. At the same time, nutrient budgeting provides a template for economic budgeting and, therefore, for understanding higher-level determinants of farmers’ soil management practices (Lynam et al., 1998).
The objective of this report is to revisit and synthesize existing studies on soil nutrient stocks, flows and balances at the macrolevel and the microlevel, and to calculate mesolevel nutrient balances for three SSA countries (Ghana, Kenya and Mali). The macrolevel ‘big picture’ should help in targeting profitable soil fertility technologies at the mesolevel, taking functional microlevel diversity into account. As such, the project’s ultimate objective is to provide a methodology for mesolevel stakeholders to better articulate and target scale-specific soil fertility enhancing measures and so ensure that food security policies are sustainable in the longer term. This methodology can then also fit within FAO’s normative programmes.
The report consists of five chapters and a number of annexes. Chapter 2 describes the selection of the three pilot countries, the study areas and the different farming systems to test the mesolevel method. Chapter 3 explains the methodology for calculating the nutrient flows for the different scale levels. Chapters 4 and 5 present and discuss the results of the nutrient-balance calculations for the different scale levels. Soil fertility specialists and mesolevel stakeholders discussed the results at a workshop with 27 participants in Nairobi (17-18 February 2003). Chapter 5 incorporates the outcomes of the workshop, while Annex 11 contains the abstracts of presentations by participants at the workshop.
![]()
![]()
![]()