by Ross Shotton *
THE DEEPWATER HABITAT
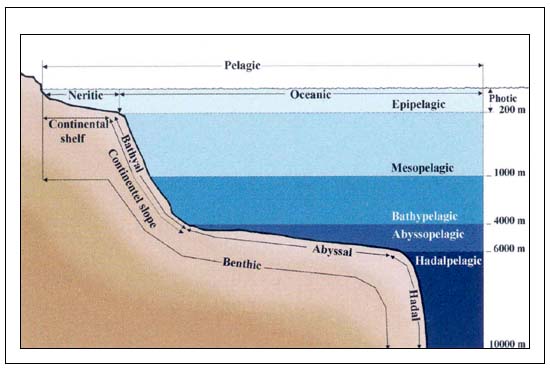
The deep-seas are the largest habitat on earth. The area over 4000m in depth covers 53 percent of the sea's surface or 38 percent of the world's surface. The continental slopes alone occupy 8.8 percent of the world's surface, compared to 7.5 percent for the continental shelf and shallow seas (Merrett and Haedrich 1997). The deep-sea can be classified into four zones: the mesopelagial is uppermost and ranges from 200 to 1000m; the bathypelagic occupies the 1000–4000m depth zone; the abyssopelagic goes from 4000 to 6000m and the hadal zone mentioned for completeness, is the habitat of the deep ocean trenches (See Figure C3.1). From a demersal fishery, the deepwater region can be taken as the continental slopes, starting at the shelf break and corresponding to the mesopelagic and bathypelagic and , beneath, the continental rise which extends down to the abyssal planes at around 6000m. Complicating this picture are the existence of seabed features that may rises thousands of metres above the surrounding areas-seamounts, or form regions of “hills” or knolls.
The main thermocline rarely extends below 1200m; below this the temperature falls to around 2°C and even lower in areas where water masses sink, such as the Weddel Sea and high-latitude areas in the NE Atlantic. Active current effects are encountered to at least mid-slope depths of about 800m, a result of eddies and turbulence caused by the poleward flow of western boundary currents. Wind-driven surface currents can also cause mid-depth upwelling of water and species and down welling of surface waters and species. On the seabed, bottom-sea friction can cause cross-shelf water movement and vertical movement of water.
No light penetrates beyond 1000m and even at depths of 150m light intensity is reduced to 1 percent of that at the surface insufficient for photosynthesis. Thus fish in deeper layers depend on organic material convected downward; this can happen in various ways. Dead phytoplankton and nekton sink, and though much is consumed as it sinks, sufficient of it enters the deepwater to sustain much of the deepwater fauna. Many species undergo extensive diel vertical migrations, feeding near the surface and descending during the day, presumably to avoid predation in the surface waters. In this way, surface production is cascaded through progressively deeper layers though the concentration of organic material decreases exponentially with depth. Organic material from large carcasses sinking to the seafloor, e.g. dead whales, and sulpha-based organic production associated with deep-sea seafloor hot-water vents are of relatively minor importance.
It is now known that seasonal effects in the surface layers are transferred into even the deeper regions of the oceans so that despite the physical uniformity of the deep oceans, an annual production signal exists resulting in seasonal migrations and reproductive cycles in deep-sea fauna.
Figure C3.1. Depth Zones of the Oceans
WHAT ARE THE DEEPWATER FISHES?
Given the continuity of the oceans as an ecosystem, any depth-based zonation will be arbitrary. Some workers use 500m as the start of the deepwater habitat, others consider deepwater fishes to be those living at depths greater than 400m - no rigid definition of what are deepwater fishes has been found to be always acceptable. However, deepwater fishes can be categorized into mesopelagic, bathypelagic and benthopelagic categories. Mesopelagic and bathypelagic species are true pelagic fish, generally of small adult size and unlikely to be exploited on a commercially scale. Mesopelagic fishes, such as lantern fishes (Myctophidae) and cyclothonids (Gonosto-matidae) live beneath the photic zone to approximately 1000m depth. Bathypelagic fishes live below 1000m and are usually highly adapted to life in a food-poor environment. The benthopelagic species live on, or close, to the bottom, a zone now known to be differentiated in its biological characteristics.
Here, deepwater species are defined as those beyond and below the depth of the continental shelf, i.e. those inhabiting the continental slopes and below. The behavioural characteristics of many “deepwater” species further complicate a search for an easy and useful definition. Many deepwater species migrate toward the surface at night returning during the day thereby forming a trophic link between surface waters and the benthopelagic fishes when these latter prey upon fish returning from the surface layers. Other fishes make this diel migration themselves, feeding in the surface layers and then descending, presumably to avoid being eaten themselves. Some species only inhabit deepwaters in their adult stage, and may be exploited during both their shallow - and deepwater phases- complicating the interpretation of whether such catches be defined as deepwater or not.
The first existing deepwater demersal species were present around 80 million years ago and, in order of their occurrence in the fossil record, were the Holosauridae, Bythitidae, Ophidiidae (cusk eels and brotulas), Macrouridae (rat-tails and grenadiers), Scorpaenidae (rockfishes), Trachichthyidae, and most recently, Notocanthidae and Moridae (morid cods) (Andriyashev, 1953). Because the demersal fishes are distributed according to depth, those inhabiting the slope and rise are spread along ribbon-like bathymetric-defined regions around the perimeters of the oceans. Where deepwater pelagic species impinge on these habitats feeding opportunities are created for both groups.
While most of these families occur world-wide, the existence of deepwater basins bounded by the continents and oceanic ridges has resulted in regional differences that are believed to have arisen from continental drift and subsequent ocean formation. Another important feature of deepwater fishes is that much remains unknown-new discoveries continue, e.g. recently that of a 4.5m 750kg shark (megamouth shark) and a six-gilled ray, both representing new taxonomic families. Indeed, deepwater elasmobranchs are one of the groups of particular conservation concern even when not exploited, given their low numbers, their late maturity, low fecundity and intermittent reproduction.
Though there have been some traditional deepwater fisheries (the drop line fishery for black scabbard fish (Aphanopus carbo) in Madeira and the Azores is one of the more interesting), the most important commercially are those that are harvested by trawling. Many of these occur in association with sea mounts and seafloor ridges while others have been taken at shallower depths in the past but fishing has extended in to deeper waters as deepwater fishing technology has improved and stocks have been fished down at shallower depths.
Important species that form deepwater aggregations include orange roughy (Hoplostethus atlanticus) and the oreos (Allocyttus spp., Neocyttus spp. Pseudocyttus spp., etc), which are often fished together, alfonsinos (Beryx spp.) in lower latitude fisheries, Patagonian toothfish (Dissostichus eleginoides) in Southern Ocean fisheries, pelagic armourhead (Pseudopentaceros wheeleri ) and various species of Scorpaenidae found on both coasts of North America.
Away from seamounts, Gadiforme fishes such as the Macrouridae predominate. These species too tend to be slow growing but are not so “extreme” in their characteristics as those species associated with seamount fisheries. Other species that may be included in this group are sablefish (Anoplopoma fimbria ), Greenland halibut (Reinhardtius hippoglossoides ), morids (Moridae), cusk-eels (Brotulidae) and hakes (Merlucciidae). Some of these species were thought by many to be unmarketable but with effective marketing and careful processing (failure to properly remove all surface waxes from orange roughy fillets during processing can cause diarrhoea) even the sceptics have been surprised at the market penetration that has been achieved by many deepwater species.
Orange roughy
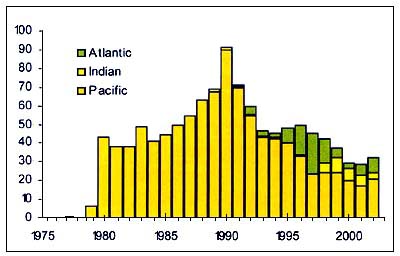
Figure C3.2 - Annual nominal catches ('000t) of Orange roughy
Source FAO
The Orange Roughy (Hoplostethus atlanticus) (Figure C3.2), is a Trachichthyidae found in the North and south Atlantic, Southern Indian Ocean, Tasman Sea, New Zealand sea, South Pacific. It is caught at depth over 800m by fisheries that often target spawning aggregations associated with seamounts. The fraction of the resource present in other areas is unknown.
The slow growth and exceptional longevity of this species means that fisheries have depended on serial stock depletion. Recruitment appears to be episodic and high market demand stimulates exploitation. Rates of sustainable exploitation may be≈5 percent of virgin biomass. This species exists as national, transboundary, straddling and high seas stocks. High sea management is confounded by the difficulty of obtaining required data.
Oreo dories
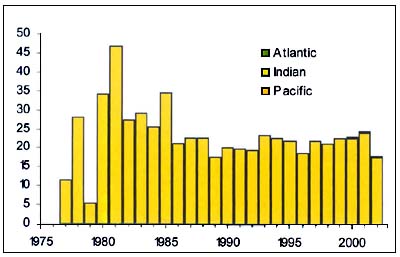
Figure C3.3 - Annual nominal catches ('000t) of Oreo dories
Source FAO
The Oreo dories (Allocystus spp. Neocystus spp. and Pseudocustus spp.) (Figure C3.3), are Oreostomadidae found close to the sea bed in deepwater and form large shoals over rough grounds near seamounts and canyons. The juveniles are pelagic and inhabit oceanic waters. They tend to be dispersed over smooth grounds. Their eggs float near the sea surface and the larvae also inhabit surface waters. In Australian waters, spiky oreo are more abundant at intermediate depths (600–800 m) and warty oreo, in deeper waters (900–1200 m). Both species are benthopelagic feeders consuming salps, crustaceans, fish and squid.
Management of these fisheries on the high seas is confounded by lack of obtaining required data. Ageing data from Australia and New Zealand indicate that the maximum age for smooth oreo is 86 years and 153 years for black oreo. Natural mortality for smooth oreo has been estimated at 0.063 yr-1and 0.044yr-1for black oreo. Estimates from New Zealand indicates “MSY” to be of the order of 1.6 percent of B0 if the population is not to be reduced to a biomass of less than 0.2 B0 (probability <0.2). For operational reasons, where they are managed at all, smooth, black and spiky oreos may be managed as a single stock with the dangers this implies (Annala, Sullivan & O'Brien 1999).
Alfonsinos
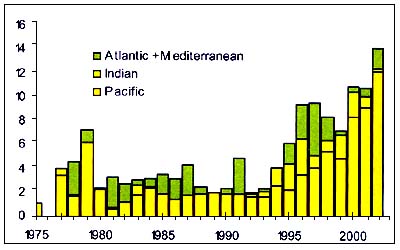
Figure C3.4 - Annual nominal catches ('000t) of Alfonsinos
Source FAO
The Alfonsinos (Beryx splendens ), (Figure C3.4) are Bericidaethat have a circumglobal distribution though they are generally not present in the northeast Pacific. They inhabit the outer shelf (180 m) and slope to at least 1300 m depth, probably moving further from the bottom at night. Beryx splendens are caught in mid-water trawls over shallower seamounts, underwater ridges and on the slope edge between 300 and 500m. The juveniles are pelagic. Genetic analysis suggests that there is, or has been, gene flow at the inter-oceanic scale and that this fishes have an ocean-wide population structure. There may be a Southern Ocean pool of juveniles that recruit northwards creating single genetic stocks of black and smooth oreo, but discrete ecological stocks with restricted post-recruitment dispersal (Lehodey, Grandperrin & Marchal 1997, Smith 2000).
These species have a maximum recorded age of 17 years and become sexually mature at about 4 years of age. Natural mortality is estimated to be around 0.23. They thus offer most chance of sustaining deepwater fisheries that target them. Little is known about the local area stock structure of these species and it is believed, e.g. that the New Zealand fishery may be exploiting a wider South Pacific stock (Annala, Sullivan & O'Brien 1999).
Toothfish
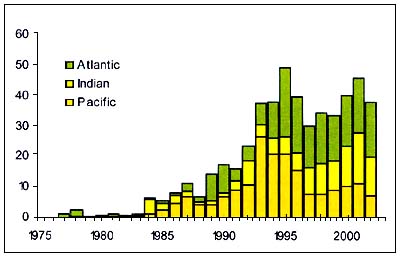
Figure C3.5 - Annual nominal catches ('000t) of toothfish
Source FAO
Toothfishes (Dissostichus spp.), (Figure C3.5) are Notothenidae that have a circumpolar distribution within Antarctic and Southern Ocean waters. Patagonian toothfish (D. eleginoides) are found around southern South America and Antarctic toothfish (D. mawsoni) occurs in high latitudes, more currently in the Pacific region. The two species overlap between 60°S and 65°S and both occur to depths of 3000 m. The northern limit for most populations of Patagonian toothfish is 45°S, except along the Chilean and Argentinean coasts where they may extend north in deeper colder water. Significant populations of Patagonian toothfish exist in the waters of, and adjacent to, the various sub-Antarctic islands and in the waters of Chile, Argentina, Uruguay and Peru.
The problem of illegal, unregulated and unreported fishing (IUU), while considerably reduced during the 2003–2004 season (6 342t in Statistical Area 41 and 3 701t in Area 87), remains the major concern. Further, catches of toothfish reported as taken outside of the CCAMLR management area, are believed by many to have been harvested from stocks within the management area. Past declines in toothfish stocks targeted by IUU fishing fleets have been fast and significant. For example, resources of toothfish in Prince Edward Islands (South Africa) have been reduced only a few percent of the pre-exploitation level.
Pelagic Armourhead
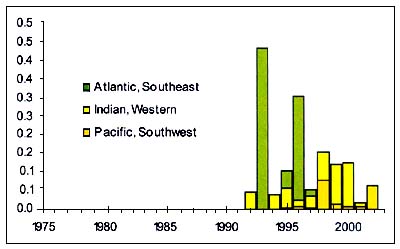
Figure C3.6 - Annual nominal catches ('000t) of Pelagic Armourhead
Source FAO
Pelagic Armourhead (Pseudopentaceros wheeleri ), (Figure C3.6) are Pentacerotidae that inhabit Sea mounts, especially in the North Pacific but also other ocean areas which are caught by bottom trawl over seamounts.
Their fishery well illustrates the possible fate of seamount fisheries. Japanese and Russian vessels began trawling in the Emperor Seamount chain and the Northern Hawaiian Ridge areas in 1969. The total catch for the Russian vessels is not known but is estimated at over 133 400t in the period 1967–1977. Between 1969 and 1977, the Japanese sent two to five trawlers a year to this area and averaged catches of 22 800–35 100t a year. Ninety percent of the catch were pelagic armourhead. After catches fell to 5 800 – 9 900t between 1977 and 1982. The once dominant pelagic armourhead have been replaced by alfonsino (Beryx splendens ), though the alfonsino stocks have never been as large as the pelagic armourhead they followed and there is no evidence that either of the fish stocks will recover to levels that will be commercially viable in the near future.
Hoki
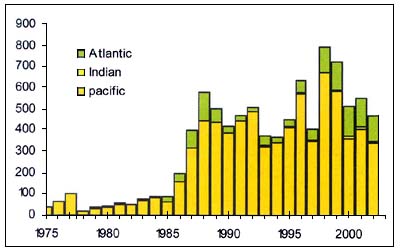
Hoki (Macruronus novaezelandiae ), (Figure C3.7) is a benthopelagic Macruronidae that usually lives near the bottom, but form mid-water aggregations for spawning. Large adult fish generally occur deeper than 400 m, while juveniles may be found in shallower water. Mid-water trawl fisheries target aggregations near canyons that are often close to coasts in areas of narrow continental shelves.
Figure C3.7 - Annual nominal catches ('000t) of hoki
Source FAO
Stock structure is often uncertain and thus the matching of TACs to the areas of fisheries is a concern; in some areas bycatch of seal and other non-target species is a problem. Management experience in at least some jurisdictions indicates that this resource can be sustainably managed, though in the major global fishery for this species, in New Zealand, the TAC is changed from time to time as the size of the hoki stocks varies and has fluctuated over the last 15 years between 200 000 and 250 000t. In 2004, the TAC was reduced to 100 000t as the spawning stock has declined - caused, it is believed, by ENSO-related oceanographic events.
Other species
A further suite of deepwater, or at least slope species, have been the target of fisheries in many tropical regions. These can be targetted by small-scale deepwater fisheries usually along the shelf break and shelf slope wherever the continental shelf is relatively narrow and the fishing grounds are accessible to fishermen using small fishing boats. The principle species consist of members of the Lutjanidae, Serranidae, and Carangidae families and mostly importantly include the Eteline snappers (e.g. Etelis coruscans and E.carbunculus ) and the jobfishes (e.g. Pristomopoides filamemtosus, P. typus and P.multidens ). These fisheries are particularly important to small island states that often have few other demersal fish resources though they are also widely found along the continental margins of many continents in tropical and sub-tropical areas.
LIFE-HISTORY CHARACTERISTICS OF DEEPWATER FISH
Not surprisingly, given the characteristics of their habitat, colouration, jaw structure, musculature, fin and swimbladder form and eyes are characteristically modified in deepwater fishes. In the absence of light most deep-sea fish are black or red as this wave length is highly attenuated in seawater and such fish effectively have black colour. Despite the lack of light, deepwater fish often have large eyes and unusual retinal and lens adaptations to detect the ambient light, which usually arises from photophores on prey, predators or co-specifics. Many deepwater species have reduced muscle and bone mass, which gives them near neutral buoyancy: those that prey by slowly cruising have swimbladders capable of excreting gas despite the ambient hydrostatic pressures of about 400 atmospheres present at great depths (Marshall 1954, 1979).
Deepwater species too, must successfully spawn, grow and return to the area of the adult habitat. The extreme conditions of the deep-sea are reflected in the variety of reproductive strategies that exist. Low population sizes not withstanding, hermaphroditism, extreme sexual dimorphism and unbalanced sex ratios occur. Despite the fewer species found in the deep-seas, they display a variety of reproductive strategies ranging from strongly K - selected species, which may be semelparous (e.g.Coryphaenoides armatus, a widely occurring macrourid), through ovoviparous and oviparous species to those that are strongly r - selected. It is believed that successful year classes may be intermittent, and many deepwater species may spawn only periodically over the years.
A number of tactics have been adopted to reduce dispersion of eggs. The buoyant eggs of the wide spread and deepwater macrourids bear sculptured patterns that slow their ascent, an adaptation not present in species of this family living in shallower waters. Eggs of Hoplostethus atlanticus are initially buoyant and later sink and probably finish their development on the seafloor, so facilitating their retention to their adult habitat.
PRODUCTIVITY
A major determinant of fishery productivity is the growth rate of the fish and invariably, the size distributions of fish populations that are usually negatively skewed. However, bimodal size distributions have been found for some deepwater species and one explanation for this is that because of their unproductive habitat, deepwater species are obliged to put their surplus production into somatic growth to achieve an optimal foraging size and only then do they allocate surplus energy to reproduction.
No matter the reason, it is clear that many deepwater species grow slowly, so slowly in fact that determination of their actual age remains difficult and age determination has been contentious. For some species, particularly orange roughy (Hoplostethus atlanticus ), the appropriate ageing technique has been vigourously contested, and depending on the assumptions that were asserted, the species could have had a potential longevity ranging from 21 to >100 years; current thinking now accepts the hypothesis that these fish grow to relatively old ages, with the maximium > 100 years.
Many deep-sea fisheries biologist have concluded that it is not meaningful to talk about deepwater fisheries in terms of sustainable fisheries, so slow are the growth rates of many of these species, a characteristic that is compounded by their apparently episodic recruitment. In such fisheries if the resource consisted of widely-separated age-classes that are fished to very low levels of abundance, stock recovery arising from good recruitment may only be possible in generation terms greater that those of humans.
DEEP-SEA FISHERIES
Until most recently, the great depth of the deep-sea has made it difficult to exploit, and the existence of relatively more abundant resources in shallower seas have meant that there was little incentive to fish in such difficult-to-exploit regions. Few deepwater fisheries are of long standing and those that are the Portuguese (Madeira) line fishery for black scabbardfish (Aphanopus carbo) and Pacific Island fisheries for snake mackerels (Gempylidae) and cutlass fish (Trichiuridae) were initially exploited by artisanal fisheries whose effects upon the resources were sustainable.
Well known among recently developed deepwater fisheries is that of the orange roughy, a species that inhabits slope waters, those of seamounts and the seafloor, most notably around New Zealand and Southeast Australia where this commercial fishery initially began; interestingly, orange roughy was first described from the Azores. The fishery later spread to the Walvis Ridge in the Southeast Atlantic (Namibia), the Southwest Indian Ocean and a small fishery exists in the Bay of Biscay. This long-lived fish reaches about 40cm and 2kg in size though the maximum size varies with region. Specialized aimed-trawling techniques have developed as at first massive catches from spawning aggregations could be taken in minutes resulting in split cod ends and lost catches. The species is sensitive to approaching objects (an adaptation to avoid predation by sperm whales?) so that acoustic assessment using towed bodies containing the acoustic transducer has proved difficult in some areas. Maximum sustainable levels of exploitation of orange roughy may be as low as 5–10 percent of unfished biomass, i.e. M ~ 0.04. Accumulating evidence indicates that few of these fisheries are being exploited sustainably and it remains uncertain what ongoing yields will be. Smaller stocks usually do not escape depletion once they become targetted, however, there is conflicting evidence that other stocks have proven more resilient to overexploitatin that expected, possible because (a) fishing disperses the fish before the stock is fished down and, (b)because of episodic spawning. In this case, where fishing depends on spawing aggregations not all of the stock may be vulnerable to capture in any one year as not all spawn each year (Butterworth and Brandão 2005).
A Trichiurid fishery, which exploits Aphanopus carbo, is a rare example of a deepwater fishery that, because it has traditionally used hook and line gear, has proved sustainable over a period of about 150 years. Adults of this species are benthopelagic living in the deep range 400- 1600m. The species ranges from Greenland to the Canary Islands and on both sides of the mid-Atlantic ridge. This deepwater species grows rapidly and has longevity of around 8 years. However, as for orange roughy, the usual ominous signs are now evident for this fishery. Catch increased from 1 100t in 1980 to 3 000t in 1992 and gear efficiency has increased through the introduction of monofilament lines and a large increase in the number of hooks per line set, now 4000–5000 per line.
The Macroudidae are another group whose members are widespread and in particular locations, abundant. They are typical pelagic “cruisers” and inhabit the mid- to upper region of the continental slope. In the North Atlantic fisheries exist for Macrourus berglax and Coryphaenoides rupestris, which use bottom trawls initially fishing in depths of 600–800m, and more recently to 1500m. However, experience in these fisheries off Newfoundland shows the all-too-familiar pattern of total allowable catches tracking declining trends in reported landings. Coryphaenoides rupestris have a potential longevity of 70 years, through in the NE Atlantic, fish ages are usually of 20–30 years. Thus, as for other deepwater species, Macrourids exhibit the characteristics of many deepwater fisheries that render them particularly susceptible to overfishing.
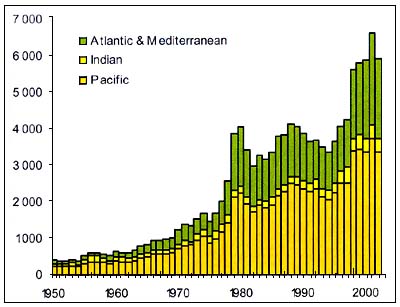
Figure C3.8 - Annual nominal catches ('000t) of Deepsea species
Source FAO
The Pleuronectidae are a highly evolved group that are not usually associated with deepwater fisheries, but important fisheries for members of this group occur in both the North Atlantic and North Pacific Oceans. In the Atlantic, the best known has been that for Greenland Halibut (Reinhardtius hippoglosoides) on the continental slope depths. This fish had an average size of around 1kg up until the mid-1980s, but has since declined to around 200g in the early 1990s.
Figure C3.8 represents the evolutioncaptures of the deep-sea species listed in table C3.1. Some of these species however can also be captured in other fisheries and there is no possiblility to determine which portion comes from deep-sea fishing. These statistics only reflect the amount of deep-sea species catches reported to FAO by member countries. No information is available to attribute the changes in 1979 and 1998 to an increase of actual catches or a better reporting.
RESOURCE MANAGEMENT ISSUES
The biological features of deepwater species that may be caught by the same fisheries are varied and require that appropriate management strategies are adapted. Different species complexes may occur in the same general area but at different depths. For example, in the southern Indian Ocean fisheries characteristically at depths of 800m commonly target orange roughy (Hoplostethus atlanticus ), black oreo (Allocyttus niger ), spiky oreo (Neocyttus rhomboidalis) and smooth oreo (Pseudocyttus maculatus ). When fishing at depths of ≈400m, these vessels would commonly harvest alfonsino (Beryx splendens ), boarfish (Pseudopentaceros richardsoni ), cardinalfish (Epigonus telescopus) and bluenose (Hyperoglyphe antartica ).
Such fisheries may have little bycatch (and thus discards), i.e. the fisheries could be considered “clean” in that few non-targeted species are taken. However, unskilled operators, who snag the bottom, can cause significant damage to the benthos. And, lost catch from burst codends results in fishing mortality that is rarely recorded.
In these fisheries, traditional tools of fisheries management, e.g. those that assume annual recruitment and a functional stock-recruitment relationships may fail so badly that using them may endanger ensuring sustainability of the resources, rather than conserving them. Although characteristically deepwater resources are harvested by trawling, from a management perspective, the fishing tactics have more in common with purse seining. Fishing may be done on acoustic marks, especially in the case of orange roughy fisheries or by extended tows as when targeting alfonsino.
When fishing for orange roughy catch success critically depends on crew skills and the success of fishing tactics rather than, e.g., the dimensions of the fishing vessel. In recording fishing effort, the main requirement is to know if the net was a bottom or pelagic trawl, and in the latter case, if it was fished “hard-down” and if the gear performed as intended, i.e. was the tow “successful” even if no fish were caught. Related to this are fishing tactics in the presence of other vessels. Vessels with crews with inferior skills often trailed better performing vessels relying on them to locate concentrations of fish. In these cases, complex gaming behaviour on the part of the skipper could result further complicating interpretation of vessel operating success. While catch per unit effort (CPUE) remains one of the most useful indices of stock status, as noted, in these vulnerable fisheries, its undue emphasis it could well be misleading, if not dangerous.
Table C3.1 Species of deepwater fish recorded in the FAO Reported Landings Database
| Crustaceans | ARISTAEIDAE | Plesiopenaeus edwardsianus | Scarlet shrimp |
| GERYONIDAE | Geryon quinquedens | Red crab | |
| LITHODIDAE | Lithodes aequispina | Golden king crab | |
| Paralomis spinosissima | Antarctic stone crab | ||
| PANDALIDAE | Pandalus spp | Pandalus shrimps | |
| SOLENOCERIDAE | Pleoticus robustus | Royal red shrimp | |
| Chondricthyans | CALLORHINCHIDAE | Callorhinchus capensis | Cape elephantfish |
| Callorhinchus milii | Ghost shark | ||
| Callorhinchus spp | Elephantfishes | ||
| Chimaeras, etc. | Chimaeriformes | Chimaeras, etc. | |
| CHIMAERIDAE | Chimaera monstrosa | Rabbit fish | |
| Hydrolagus novaezealandiae | Dark ghost shark | ||
| Hydrolagus spp | Ratfishes | ||
| HEXANCHIDAE | Hexanchus griseus | Bluntnose sixgill shark | |
| RAJIDAE | Bathyraja meridionalis | Bathyraja meridionalis | |
| Bathyraja spp | Bathyraja rays | ||
| SQUALIDAE | Centroscymnus coelolepis | Portuguese dogfish | |
| Centroscymnus crepidater | Longnose velvet dogfish | ||
| Somniosus microcephalus | Greenland shark | ||
| Somniosus pacificus | Pacific sleeper shark | ||
| Teleosteans | ARGENTINIDAE | Glossanodon semifasciatus | Deep-sea smelt |
| BERYCIDAE | Beryx spp | Alfonsinos | |
| Centroberyx affinis | Redfish | ||
| BRANCHIOSTEGIDAE | Branchiostegidae | Tilefishes | |
| CAPROIDAE | Caproidae | Boarfishes | |
| CENTROLOPHIDAE | Hyperoglyphe antarctica | Bluenose warehou | |
| Seriolella caerulea | White warehou | ||
| CHLOROPHTHALMIDAE | Chlorophthalmidae | Greeneyes | |
| EMMELICHTHYIDAE | Emmelichthyidae | Bonnetmouths, rubyfishes | |
| Emmelichthys nitidus | Cape bonnetmouth | ||
| EPIGONIDAE | Epigonus spp | Cardinal fishes | |
| GADIDAE | Brosme brosme | Cusk | |
| Micromesistius australis | Southern blue whiting | ||
| Micromesistius poutassou | Blue whiting | ||
| Molva dypterygia | Blue ling | ||
| Molva molva | Ling | ||
| GEMPYLIDAE | Lepidocybium flavobrunneum | Escolar | |
| Rexea solandri | Silver gemfish | ||
| Ruvettus pretiosus | Oilfish | ||
| Thyrsitops lepidopoides | White snake mackerel | ||
| GERYONIDAE | Geryon spp | Geryons | |
| MACRORAMPHOSIDAE | Macroramphosus scolopax | Longspine snipefish | |
| MACROURIDAE | Coryphaenoides rupestris | Roundnose grenadier | |
| Lepidorhynchus denticulatus | Thorntooth grenadier | ||
| Macrouridae | Grenadiers, rattails | ||
| Macrourus berglax | Roughhead grenadier | ||
| Macrourus spp | Grenadiers | ||
| MERLUCCIIDAE | Macruronus magellanicus | Patagonian grenadier | |
| Macruronus novaezelandiae | Blue grenadier | ||
| Macruronus spp | Blue grenadiers | ||
| MORIDAE | Antimora rostrata | Blue antimora | |
| Mora moro | Common mora | ||
| MYCTOPHIDAE | Lampanyctodes hectoris | Hector's lanternfish | |
| Myctophidae | Lanternfishes | ||
| NOTOTHENIIDAE | Dissostichus eleginoides | Patagonian toothfish | |
| Dissostichus mawsoni | Antarctic toothfish | ||
| OPHIDIIDAE | Genypterus blacodes | Pink cusk-eel | |
| Genypterus capensis | Kingklip | ||
| Genypterus chilensis | Red cusk-eel | ||
| Genypterus maculatus | Black cusk-eel | ||
| Genypterus spp | Cusk-eels | ||
| OREOSOMATIDAE | Oreosomatidae | Oreo dories | |
| PENTACEROTIDAE | Pseudopentaceros richardsoni | Pelagic armourhead | |
| PLEURONECTIDAE | Reinhardtius hippoglossoides | Greenland halibut | |
| POLYPRIONIDAE | Polyprion americanus | Wreckfish | |
| Polyprion oxygeneios | Hapuku wreckfish | ||
| SCORPAENIDAE | Scorpaena scrofa | Red scorpionfish | |
| STERNOPTYCHIDAE | Maurolicus muelleri | Silvery lightfish | |
| SYNODONTIDAE | Harpadon nehereus | Bombay-duck | |
| TRACHICHTHYIDAE | Hoplostethus atlanticus | Orange roughy | |
| Trachichthyidae | Slimeheads | ||
| TRICHIURIDAE | Aphanopus carbo | Black scabbardfish | |
| Lepidopus caudatus | Silver scabbardfish | ||
| Trichiuridae | Hairtails, scabbardfishes | ||
| Trichiurus lepturus | Largehead hairtail | ||
| TRIGLIDAE | Pterygotrigla picta | Spotted gurnard |
A further complication of deepwater research, especially on the high seas, is the provision of data that are essential for resource management FAO 2001, 2002). The operators of many high seas fishing vessels have no flag-responsibility to report their catches, fishing effort or area of operations. And, when catches are landed in foreign countries, from a data recording perspective, this situation is exacerbated. An example of such a fishery is that of the North Pacific pelagic armourhead (Pseudopentacerus wheeleri ). No trace of this fishery is to be found in the FAO Nominal Catches and Landings Database, the largest and most comprehensive global record of fish catches, despite this fishery being reported as reaching a level or 200 000t per year! Likewise, the FAO database in the period up to 2000 reports explicit landing of orange roughy from only three countries; however, informal contacts through working groups shows that at least seven countries have harvested this species from the Indian Ocean. In some cases this lack of information is a consequence of national laws regarding confidentiality of information. Characteristically only few vessels, or even one, may participate in seamount-based fisheries within a management region, which if stock-based may consist of a single seamount. And, national laws often prevent governments from releasing information that identifies the operations of a single vessel or company. This can create an insurmountable barrier to effective resource management.
MANAGEMENT OBJECTIVES: IS “SUSTAINABLE YIELD” A PRACTICAL GOAL?
Management for sustainable yields, as a management objective, has been increasingly criticized in “conventional” fisheries for nearly two decades as numerous fishery administrations have struggled to implement such a management paradigm. As a consequence, the management emphasis has changed towards the use of reference points as simpler, more tractable and more useful tools. Inacomplementary and more complex development is the emerging demand for “ecosystem” management. When considering the circumstances of many deep-sea fishes, it is clear that major challenges arise in adapting such models, if indeed they can be adapted to deep-sea fishery situations. First, “sustainability” may be an irrelevant or at least unusable management concept in fisheries where the resources have episodic and unpredictable recruitment, no matter the spawning stock size. Second, for those species with low growth rates and late sexual maturity, use of conventional limit spawning biomass reference levels, few stocks may remain which can satisfy these demands and should they do so, harvest rates may have to be in the order of five percent of virgin biomass. Third, stock recovery times may be of the order of decades, perhaps beyond normal commercial (and political) time horizons. Fourth, even if there were agreement on management objectives and harvest control functions, in many instances neither the management regimes nor regulatory mechanisms exist to ensure compliance with any management plan. These are the challenges that must be addressed if the world's deepwater resources are not to disappear as contributors to human welfare.
OPERATIONAL MANAGEMENT: THE ASSESSING AND MANAGING OF EXPLOITATION OF DEEPWATER FISHERIES
This section is drawn from the report of the FAO Workshop on the Assessment and Management of Deepwater Fisheries, University of Otago, Dunedin, New Zealand, 27–29 November 2003 (FAO 2005)
The estimation of abundance
The estimation of the abundance of deepwater fishery resources has many of the characteristics of those for more traditional shelf stocks but other attributes are unique to deepwater species. Some deepwater species, such as orange roughy, have low productivity, are highly aggregating, are often, but not exclusively, found around underwater features, and that they react to survey and fishing gear not just at the time of capture but also over longer periods. The reasons for aggregating behaviour (e.g. suitable conditions or learned behaviour) remain uncertain and more research on fish behaviour is highly desirable. However, the low productivity in deepwater may not be universal. Some “deepwater” species (particularly those with long pelagic phases, strong diurnal migration patterns, or preferred depths above about 800m) have moderate levels of productivity.
Egg surveys, methods often used for shallow water stocks, may peform poorly in estimating abundance for a variety of reasons, among which are the highly localized spawning behaviour (e.g. orange roughy) of some species while others (e.g. some oreos and boar fish) may have wide-region panmictic spawning behaviour. Trawl and acoustic surveys are potentially the most useful methods for estimating abundance and both can be used to obtain relative abundance indices, although the use of acoustics is difficult even for relative abundance estimation when the target species is also associated with other species during the survey period. Both methods present problems with respect to the estimation of absolute abundance. For acoustics assessment, difficulties include identification of the values of species-specific backscattering cross section areas and target species identification. For trawl surveys, estimating the vulnerability to capture (i.e. survey catchability) is problematic.
The use of remotely operated vehicles and autonomous underwater vehicles has potential for use in abundance estimation, or in experiments to estimate vulnerability to capture by trawls but further development is needed. But, methods based on developments in technology will require advances in the understanding of fish behaviour (natural and in response to fishing and research vessels and gear). In particular, further work is needed on factors influencing aggregating behaviour and such underwater technology may offer opportunities in this respect.
Additional issues concern those relating to identifying stock structure, stock distribution and movement. Obtaining some form of relative or absolute abundance estimates may be feasible, but their validity will depend on appropriate survey designs that take account of underlying distributions and movements. As yet, it appears that there is no single best way to estimate abundance and that use of a range of methods will offer the best way forward. In some areas, trawl and acoustic surveys are in regular use and the estimates and indices derived are used in stock assessments with varying degrees of success, but this often depends on the availability and quality of other data sources.
The costs of deepwater fishery resource surveys is high and commonly the cost-benefit of surveys is a consideration in deciding on best ways forward in any particular circumstance. Dedicated research cruises provide the best means of providing abundance estimates, and can often undertake a wider range of associated work at the same time. However, the use of industry-based surveys (especially acoustic surveys) is providing useful inputs for stock assessments and considerable advances are being made in this direction.
Biology, age and growth
Management of deepwater species is complicated by the wide variability in their biological characteristics. Many species have high longevity, slow growth rates, high age at maturity and low fecundity and many, but not all, deepwater species have relatively low annual production to biomass ratios. For such stocks, this means that sustainable yield levels are relatively low, and recovery from depleted states can be slow.
Routine data collection and analysis is essential for effective management and should not be restricted to the needs for immediate stock assessment purposes. Biological characteristics (e.g. size-at-maturity) can change as fish stock size changes so such characteristics need to be monitored as ancillary inputs to evaluating stock status. Density dependent effects need to be considered in the stock assessment, as estimates of catchability, maturity, growth rates, spawning success and other factors may change. Stock structures of most deepwater species are generally poorly known and their depth means that direct methods to monitor distribution and movements (such as by tagging) can rarely be applied.
Fish population parameters are often poorly known, and variable. And complicating the use of spawning models is that several deepwater species (e.g. orange roughy and hoki) do not spawn each year. This means that reliance upon gonad stage data to determine age at maturity, or the maturity ogive, may be misleading. In the case of orange roughy, there is a transition zone in the otolith that appears to mark the onset of spawning. However, the frequency of spawning is important, in terms of the proportion of the population available to the fishery or the biomass survey each year, particularly if the proportion varies between years. Stock-recruitment relationships, and levels of recruitment, are poorly known for most, if not all, deepwater species. Yet this is important for understanding changes in stock size, and for the management of sustainable fisheries.
Chemical and radiometric methods have improved confidence in the interpretation of otolith rings of deepwater species and improved age-method validation. In the absence of initial data, general age and growth estimates may be available from other areas or fisheries. Ageing for production estimation is still needed, however, in the major fisheries.
There is a pressing need to try to understand the ecological processes affecting biological variability for without this, predictive modelling can be misleading. At the least, consideration should be given to trophic interactions and links between deepwater demersal fish and the mesopelagic energy source.
Assessment of deep-sea fisheries
A number of key data gaps and data needs exist for reliable assessments of deepwater species. Three, in order of priority are:
- Catch data at the minimum, it is essential to know the amount and location of fisheries catches. This needs to be collected at an appropriate spatial scale given the localized aggregations formed by many deepwater species. It would also be useful to collect data on length frequency distributions of target species, and catches of by-catch species.
- Valid indices of relative abundance-preferably, these should be fishery-independent but, realistically, they are likely to be fishery-dependent commercial catch rates. It is extremely difficult to develop “valid” interpretations of the indices at the beginning of a fishery; however, programmes should be developed to collect data on relevant factors such as the relationship between commercial CPUE and abundance, selectivity by fisheries, stock boundaries, migration patterns, and the dynamics of aggregating behaviour.
- Estimates of absolute abundance-ultimately, these are needed to estimate long-term sustainable yields. They can be obtained either from a fishery-independent survey that provides estimates of absolute abundance (e.g., an acoustic survey) or an assessment model that estimates absolute abundance based on catch and relative abundance.
Other data needs that may be crucial for some stocks, and will almost always improve the accuracy and precision of assessments if available, include:
- relative or absolute estimates of recruitment;
- the relationship between stock size and recruitment; and
- age data.
Although age information is essential for estimating population productivity, it is less important to devote resources to ageing stocks for which age and growth information already exists for other stocks of the same species. Knowledge of fish ages (which enables estimation of growth rates, natural mortality, and sometimes recruitment) was crucial for determining sustainable yields for orange roughy fisheries when they were first initiated. But, it was not until a validated ageing system was developed that it became evident that orange roughy had unusually low growth rates, low natural mortality, high age at maturity and high longevity. Ageing of other orange roughy populations has demonstrated some differences in these life history parameters, but such differences may be insufficient to justify initiation of major research initiatives on ageing, particularly if resources are limited. It may be better to give higher priority to other data needs, such as the need for abundance indices, and simply adopt the age-length keys, growth parameters and natural mortality estimates from other similar stocks.
Finally, to satisfy objectives that are often mandated by international agreements or national policy, it may be necessary to augment existing, or to set up new, programmes to provide data on ecosystem considerations, such as bycatch species, other associated species, and the effects of fishing on habitat. In multi-species fisheries for which it is extremely difficult to obtain species-specific data on catch and abundance, these may need to be assessed and managed as species assemblages, with application of the precautionary approach with regards to setting catch or effort limits.
Management concerns of deep-sea fisheries
Biological reference points
Options for reference points include frameworks based on control rules using target and limit reference points and management procedures that consider the assessment and management systems in concert using various performance measures to evaluate outcomes. In general, the use of evaluation approaches to derive robust management procedures is desirable; however, in the case of many information poor fisheries the feasibility of doing this is questionable. For many low-productivity stocks, target biomass levels used for management purposes vary from about 30 percent to 55 percent or higher of the unexploited level and rather than setting targets, a more useful approach may be to concentrate on avoiding a lower biomass (typically 20 percent of unexploited) with a high probability (typically 90 percent). Depending on the uncertainty inherent in any assessment and projection, the implied target biomass would vary but would likely fall within the range of typically adopted targets. In this regard though, some scientists consider fishing mortality reference points to be a superior approach.
Ecosystem approach to fisheries management
Even in deepwater fisheries, the single most important first step in moving towards an ecosystem approach to fisheries management is to get single-species fishing mortality under control and reduce it to appropriate levels. For this to happen, assessment and management of marine resources must be better integrated with appropriate management frameworks that ensure single stock management is successful while considering wider environmental or ecosystem issues.
Data-poor situations
In many deepwater fishery situations, there may be little or no information available to set initial catches, assess stock status or estimate reference points. Adaptive management may be useful but there is often tension between adaptive management procedures that probe for information (and therefore require that catches be high enough (or low enough) to create contrast in data sets) and the adoption of a precautionary approach, which would suggest low catches for low productivity stocks. Evaluated (adaptive) management procedures may also be problematic if the information that is accrued shows that the assumptions used in management and resource modelling are untenable and must be re-evaluated. In these situations meta-analyses may provide a means of garnering the maximum possible benefit from the dispersed global data on deepwater stocks, fisheries and associated habitats. Such an analysis could provide a means for setting initial catch limits for new fisheries as a basis for adaptive and/or precautionary management.
Precautionary approach
The approach of treading carefully and restricting catches in early phases of deepwater fisheries is well supported. In New Zealand, new orange roughy fisheries are voluntarily capped at 500 t while information is gathered. The Commission for Conservation of Antarctic Marine Living Resources (CCAMLR) does not allow new fisheries unless they are explicitly allowed and involve permit conditions such as mandatory data collection procedures. Although there is growing support for such approaches, still, rapid declines in biomass of low productivity stocks occurs as the initial biomasses of the resources have, almost invariably, been overestimated.
ECOSYSTEM CONSIDERATIONS OF THE DEEP-SEA ENVIRONMENT
Given its great depth, extent and, until only the most recent years, its low to non-existent visible profile, it is unsurprising that the environment of the deep-sea has escaped concern. But, much evidence now shows that human activity is degrading the deep-sea floor and along with it the habitat of the fish that live there. Major causes of this damage the physical impact by trawls on benthos (Koslow et al. 2000) and ocean dumping of sludge residuals from the processing of sewerage; of growing concern is petroleum exploration activities, and potentially in the future, mineral extraction.
Deep-sea surveys have shown the existence of deepwater corals in the North Atlantic, North Pacific, south of Australia, about New Zealand and almost certainly they will occur elsewhere. In the North Atlantic, the dominant genus Lophelia occurs in depths between 200–1000 m and grows at a rate of about 1 mm per year. The highest reefs have measured 35 m, implying an age of 8500 years and the largest Lophelia reef are more than 13 km long and reach 400m in width. Off Nova Scotia, corals are found far from shore in depths > 200m. Here, species known to exist include Paragorgia arborea (Gorgonacea), which can be up to five metres in height and Primnoa resedaeformis (Paragorgia), which, fishermen report, grows in dense patches where is has not been removed by demersal trawling.
Such reefs provide shelter for marine fishes, which in the NE Atlantic include commercial species such as redfish, saithe, cod, ling and tusk. The reefs have traditionally been rich fishing grounds for longline and gillnet fisheries and experimental fishing has shown the occurrence of productive fishing grounds in relation with the presence of bottom corals. Evidence is emerging that the maintenance of bottom habitat corals structure is important to maintaining fish production and at least in shallower waters, habitat degradation by bottom trawling can result in fish species succession, perversely, for types that are of least commercial value.
Deepwater corals are sensitive to damage from bottom trawls, e.g. in Norwegian waters it is estimated that 30–50 percent of the Lophelia reefs have been affected or impacted by trawling. Damage has also been reported from other parts of NW Atlantic, including northwest of Scotland and in the Porcupine sea bight in Irish waters and off the coast of Nova Scotia where active clearing of bottom corals has been reported. In Australia and New Zealand it is claimed that fisheries using demersal trawls have cleared corals from the rocky tops of seamounts and fish that were once abundant among the corals have disappeared.
Seamounts provide another particular fish habitat of concern. These seafloor features are usually found in the open oceans and are the remains of extinct volcanoes. They range from 500 to 1000m in height above the seafloor; some reach within tens of metres of the surface while others have tops more than a kilometre deep. The associated fauna with seamounts is poorly studied and highly diverse and can include corals, soft sea pens, sponges, sea spiders and lobsters. Many of the species are endemic to particular sea mounts as they form isolated habitats. Once damaged by fishing gear, it is believed that recovery may take decades, if not centuries.
REFERENCES
Andriyashev, A.P. 1953. Ancient deepwater and secondary deepwater fishes and their importance in a zoogeographical analysis. In “Notes on Special Problems in Icthyology. Akademiya Nauk SSSR, Ikhtiologicheskaya Kommossiya, Moscow: 58–64. (English translation by A.R. Gosline, Bureau of Commercial Fisheries, USNM, Washington.
Annala, J. H., Sullivan, K.J., & O'Brien, C.J. 1999. Report from the Fishery Assessment Plenary, April 1000: stock assessments and yield estimates. Ministry of Fisheries. 430pp.
Butterworth, D.S. & Brandão, A. 2005. Experiences in Southern Africa in the Management of Deep-sea Fisheries. In Proceedings of the Conference on Management and Governance of Deepwater Fisheries . 1–4 December 2003, Queenstown, New Zealand. In press.
FAO. 2001. Report of the Ad Hoc Meeting on Management of Deepwater Fisheries Resources of the Southern Indian Ocean, Swakopmund, Namibia, 30 may–1 June 2001. FAO Fish. Rep. 652. FIRM, Rome. 61pp.
FAO. 2002. Report of the Second Ad Hoc Meeting on Management of Deepwater Fisheries Resources of the Southern Indian Ocean, Fremantle, Western Australa, 20–22 May 2002. FAO Fish. Rep . 677. FIRM, Rome. 106pp.
FAO, 2005. Report on DEEP-SEA 2003; An International Conference on Governance of Deep-sea Fisheries. Queenstown, New Zealand, 1–5 December 2003. FAO Fish. Rept . In press.
Garibaldi, L & Limongelli L. 2002. Trends in oceanic captures and clustering of large marine ecosystems: two studies based on the FAO capture database. FAO Fisheries Technical Paper . No. 435. Rome, FAO. 71pp.
Koslow, A.J., Boehlert, G.W., Gordon, J.D.M., Haedrich, R.L., Lorance, P. & Parin, N. 2000. Continental slope and deep-sea fisheries: implications for a fragile ecosystem. ICES J. Mar. Sci. 57:548–557.
Lehodey, P., Grandperrin, R. & Marchal, P. 1997. Reproductive biology and ecology of a deep-demersal fish, alfonsino Beryx splendens, over the seamounts off New Caledonia. Mar. Biol. 128(1):17–27)
Marshall, N.B. 1954. Aspects of Deep-sea Biology. Hutchinson Press, London. 380pp.
Marshall, N.B. 1979. Developments in Deep-sea Biology. Blandford Press, Poole. 566pp.
Merrett, N.R. & Haedrich, R.L. 1997. Deep-sea Demersal Fish and Fisheries. Chapman & Hall. London. 282 pp.
Smith, P.J. 2000. Managing biodiversity: Invertebrate by-catch in seamount fisheries in the New Zealand Exclusive Economic Zone. NIWA, Wellington, New Zealand. 30p
by Jorge Csirke and Marcelo Vasconcellos *
INTRODUCTION
An important source of concern for fishers, fishery scientists and fisheries administrators dealing with most wild fish stocks from the oceans is the high variability of fish abundance and fish catches. This makes even short-term planning a rather difficult task as in those cases not even good statistics describing past and present catches are, by themselves, usable proxies for what could be produced in the years to come. Experience has shown that much more needs to be known about the natural fluctuations in fish stock abundance, their causes and trends, and how to deal with them.
Persisting attempts have been made to control or alleviate year to year changes in fish catches and stock abundance. For several decades fisheries scientists and administrators had concentrated major efforts in controlling fishing pressure and in tackling the overfishing problem on the assumption that environmental factors and natural causes of change in stock abundance could be taken as a random or a constant parameter. However, the relatively high proportion of fish stocks that over the years have been overexploited and depleted suggest that the attempts to tackle the overfishing problem and control resources fluctuations by controlling fishing pressure as taught by Russell (1931), Beverton and Holt (1957), Ricker (1958) Gulland (1969) and others, have not always been a successful undertaking.
Causes for failure in maintaining exploited fish stocks in healthy condition and in preventing or avoiding their overexploitation and eventual depletion are at least twofold: the variable character of Nature and the poor performance of fisheries management and decision making. In several cases large and unpredictable natural changes in stock abundance could be blamed for the decline of fish populations and the collapse of important fisheries. However, greediness and poor management, including feeble application and enforcement of accepted guidelines and regulations are also to be blamed, and often solely, for the severe decline of important fish resources and the collapse of their fisheries. Although important, not much will be said here on the latter, nor on the short-term natural causes of stock fluctuations to focus on some relevant aspects of natural long-term changes in climate that may affect fisheries by causing wild fish stocks to vary, even widely, with time.
FISHERIES LONG-TERM FLUCTUATIONS
An important meeting that looked into the matter of changes affecting fish stocks and fisheries was organized by FAO in 1983, where different causes of change, fluctuation patterns, their possible causes and relationship with environmental factors and suggested research and management strategies to face them were discussed and recounted (Sharp and Csirke, 1983; Csirke and Sharp, 1984). While at first it was mostly considered a scientific problem, as world fisheries developed, and as more and longer fishery records became available, long-term changes affecting fisheries have attracted more the attention of fishers, fisheries managers, policy- and decision-makers and the general public.
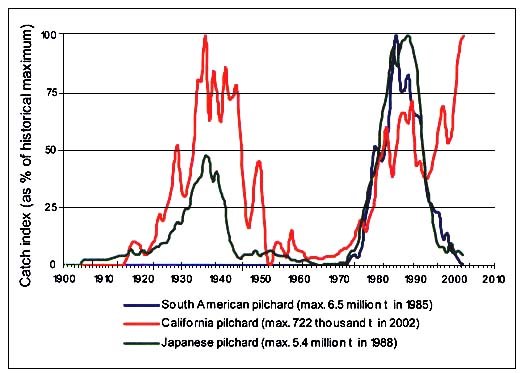
The first scientific report of long-term fluctuations in herring abundance was published in 1879 based on observations made since the sixteenth century. Ljungman (1879, cited in Lindquist, 1983) described the so-called “herring periods” in the Bohuslän archipelago, Sweden, which lasted from 30 to 60 years. Since then, many more reports dealing with long-term fluctuations in marine capture fisheries have appeared, and of particular relevance are Kawasaki's attempts to explain why some pelagic fishes have wide fluctuations in their numbers (Kawasaki, 1983). His report showing the synchronized catch patterns of the three main Pacific sardine (or pilchard) species of the genus Sardinops since the early 1900s convinced the scientific community that there was a clear underlying natural cause for the blooms, peaking and general return to very low levels of these resources (Csirke and Sharp, 1984). Kawasaki's theories found confirmation as world fisheries expanded and more evidence of long-term fluctuations in fish abundance emerged. This is shown, for instance, through the update of the main pilchard (genus Sardinops) catches in Figure C4.1 where, however, it is noted that since the early 1990s the California pilchard (or sardine) does not follow the trend observed in other cogeneric species in the Pacific. Catches of California pilchard peaked in 2002, the last annual data recorded, while that of South American and Japanese pilchards have been declining sharply after peaking in 1985 and 1988, respectively.
There seems to be at least two sets of reasonable explanations for the continued increasing trend in California pilchard catches. A sequence of good year classes, particularly in 1998, and high stock biomass off California, which has stabilized at around 1 million tonnes since 1999 (Conser et al., 2002) is one. The 1997–98 “El Niño” might have had an influence here. Also, there is an intense Mexican fisheries inside the Gulf of California (which in recent years represent ca. 60 percent of total catches) while catches off Ensenada are much lower, the same as off the Pacific coast of USA, where the fishery is tightly regulated under a quota management scheme intended to protect the stock and prevent overfishing. Both sets of factors might have a role in delaying the declining phase of this recent high abundance cycle of California pilchard.
As will be described later, long-term fluctuations in fish abundance and/or catches have been reported for several other important fish stocks of the world, including cods, salmons and tunas.
Figure C4.1 - Observed long-term catch variability of Japanese pilchard (Sardinops melanostictus) in the Northwest Pacific, California pilchard (S.caeruleus) in the Eastern Central Pacific and South American pilchard (S.sagax) in the Southeast Pacific (updated after Kawasaki, 1983, Csirke, 1995 and FAO, 1997)
Possible causal mechanisms
There have been increased attempts to relate fisheries cycles to available long-term climatic variability signals as a means of identifying the possible causal mechanisms of fish fluctuations. In the last two decades several relevant research efforts have been devoted to describing and analysing long-term fluctuations in the abundance of commercial species and the possible relationships between ocean climate and fish stock size. Amongst these, one of the best documented cases in the literature is the above mentionned regular synchronous outbursts of sardine (or pilchard), and also anchovy populations in both northern and southern hemispheres which suggest that fish populations are governed by similar global climatic events. Following his earlier work, Kawasaki (1994) was one of the first to develop further the concept of cyclic climate changes to explain the regular cycles in the Japanese pilchard catches in the last 350 years.
The analysis of reconstructed time series of cod catches in the North Atlantic have also showed synchronous oscillations in western and eastern stocks which are likely to be caused by the same climatic mechanisms (Garrod and Schumacher 1994; Jonsson 1994). Others have analysed possible links between global warming and fish stock fluctuations (Francis, 1990; Glantz, 1990; Regier and Meisner, 1990). Kawasaki (1992) and Lluch-Belda et al. (1992) suggested the dependence of Japanese and California pilchard catches on changes in surface air and water temperature in the northern hemisphere. Beamish and Bouillon (1993) showed that fluctuations in Pacific salmon catches are in agreement with the dynamics of the regional Aleutian Low Pressure Index, which is recognized as the main climate-forcing for the North Pacific. Bakun (1990; 1996) related the long-term fluctuations of small-pelagic fishes with changes in upwelling intensity, and according to the author, global climate changes are accompanied with significant changes in atmospheric circulation and in upwelling intensity. As the largest populations of small pelagic stocks are associated with centres of intense upwelling activity, any changes in upwelling intensity will affect considerably the oceanic primary production and fish harvest in these areas. Also, after analyzing long-term time series of bluefin tuna catches from traditional Mediterranean and Atlantic trap fisheries spanning for more than 300 years, Ravier and Fromentin (2001) showed that the eastern Atlantic bluefin population displays fluctuations with a period of 100–120 years and also cyclic variations of about 20 years. The long-term fluctuations were strongly and negatively correlated to trends in temperature. The close relationship between catches and temperature seems to be best explained by changes in the migration patterns of bluefin tunas, and consequently changes in their availability to the fixed gears, imposed by modifications in oceanographic conditions of spawning areas (Ravier and Fromentin, 2004).
In line with its role as the main specialized UN agency responsible for fisheries matters, FAO has supported several studies to improve knowledge on possible relationships between climate and fisheries changes, its causes and mechanisms, as well as the possible uses and applications of this improved knowledge for world fisheries conservation and development planning. The FAO Expert Consultation that analysed these changes (Sharp and Csirke 1983; Csirke and Sharp 1984) was an important attempt in this direction. Other attempts have followed, and the reviews by Klyashtorin (2001) and Sharp (2003) are some of the most recent ones.
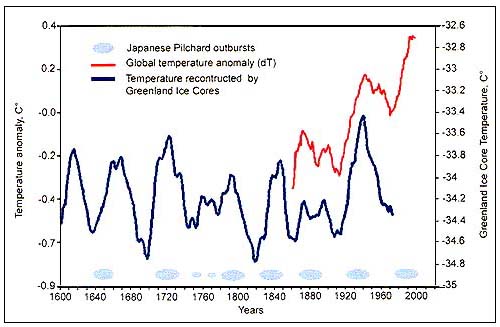
The changes in abundance of a number of species that have long-term fluctuations, have shown to have some correlation with climatic indices. Long-term observations of Japanese pilchard outbursts and atmospheric temperature indices (Figure C4.2) have led to proposals that the long-term regular changes in Japanese pilchard catches could be explained by cyclic climate changes (Kawasaki, 1994). More recently, available FAO and other data sets of world fisheries catches were analysed by Klyashtorin (2001) in an attempt to explore the possible relationships between various climate indices and the catches of selected groups of fish stocks. He also developed a time series model based on well-known climate cycles to forecast possible trends in main commercial fish catches from 5 to 15 years into the future. While such forecasts must be taken with great caution, their results are both provoking and interesting enough to merit further attention and analysis. Recent theories and findings by Klyashtorin are based on the analysis of the possible relationship between fish abundance indices, as reflected by annual catches, and climate changes. In this context, the term “climate change” refers to large-scale, long-term effects (or shifts from one climatic state to another) that seem to respond to deterministic cycles, rather than individual climatic events, such as El Niño, or long-term trends, such as global warming.
The causal mechanisms that drive most of the long-term periodic fish abundance fluctuations analysed by Klyashtorin remain unclear, and some of his findings are still working hypotheses. However, the signals and trends in climatic indices and historical fish landings that emerge from his work are of utmost interest, and merit close study. Through this, it is hoped that the mechanisms governing climate change and long-term fish production variability will be better understood and used for management purposes.
The argument put forward in most of the cases discussed by Klyashtorin is that biomass and catches are ultimately driven by climate fluctuations. This runs counter to the conventional wisdom of fisheries management, which considers that biomass and catches are driven mostly by fishing pressure and that environmental effects of fish stocks are mostly random or stochastic. In fact, what the climate-fisheries studies have demonstrated is that the environmental effects on fish populations are characterized by a long sequence of patterns and processes that tend to fall into rhythms or regimes (Sharp, 2003). Given enough observations about causal links one hopes that transitions from one regime to the other can be forecasted.
Figure C4.2 - Cyclic temperature fluctuations and Japanese pilchard (S.melanosticus) outbursts, years 1600–2000 (from Klyashtorin, 2001)
It has already been suggested (Bakun, 1996) that upwelling intensity is linked to large-scale climatic effects, which ultimately affect the rate of nutrient transport into the eutrophic upper ocean layer, thereby changing primary production and, subsequently, fish production. However, while hypotheses relating climate to nutrient availability may be correct, there is no direct evidence of the mechanism, and no conclusive modelling of the causal relationship has so far been possible.
Figure C4.3. Periodicity of the zonal atmospheric circulation index (ACI), the detrended values of global temperature anomaly (dT) and negative length of day (-LOD) with lag-time unmodified (A, top) and with ACI and - LOD shifted 4 and 6 years ahead (B, bottom) (redrawn after Klyashtorin, 2001)
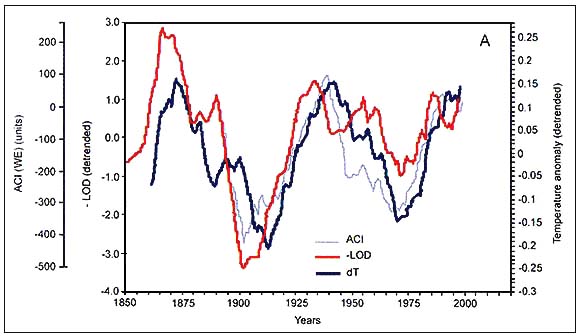
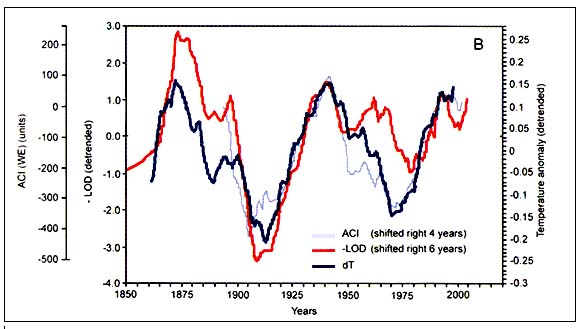
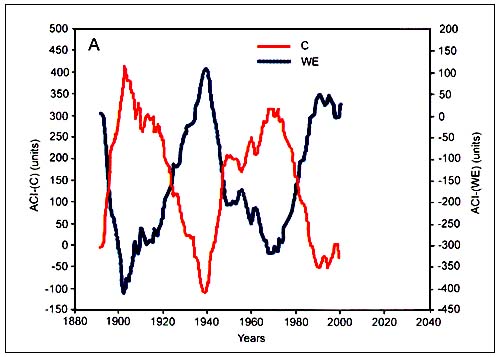
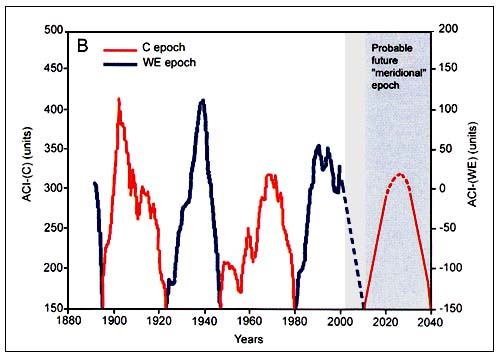
Figure C4.4. Dynamics of meridional (C) and zonal (WE) forms of the atmospheric circulation index (ACI) (A, top) and alternation of corresponding meridional and zonal circulation epochs (B, bottom) (from Klyashtorin, 2001)
The work of Klyashtorin showed consistent correlation of climatic and geophysical indexes with manifestation of important processes related to fisheries. The indexes are the surface air temperature anomaly (dT), which is the most important index of global climatic change; the length of day (LOD), a geophysical index that characterizes variation in the earth rotation velocity; and the Atmospheric Circulation Index (ACI), which characterizes the periods of relative dominance of directional transport of air masses on the hemisphere scale. The LOD index is calculated as the difference between the astronomical length of day and the standard length of day. Time scales to calculate the LOD index are available from the records maintained by the International Bureau of Weights and Measures (http://www.bipm.org), and the time series of data cover more than 350 years of data.
The ACI index is calculated based on a classification system developed by Russian climatologists. According to this system, all observable variation in atmospheric circulation is classified into three basic types by the direction of the air mass transfer: meridional, zonal western and zonal eastern. Air mass transfers in each direction are calculated based on daily atmospheric pressure charts over the northern Atlantic and Eurasian region. The ACI index is defined by the number of days with the dominant type of atmospheric circulation, being expressed as an anomaly from the long-term average.
Spectral analysis of the time series of dT, ACI and LOD estimated from available direct observations (110–150 years) shows a common periodicity of 55–65 years (Figure C4.3). Spectral analysis of the reconstructed time series of air surface temperatures for the last 1500 years suggests a similar (55–60 years) periodicity. Furthermore, the ACI observations show two alternating climatic periods, each of approximately 30 years duration, according to the dominance in air mass transport on the hemispheric scale (Figure C4.4).
Each 30-year period corresponds to a “circulation epoch” of meridional (C) and zonal (W+E) air masses transfers. Zonal epochs correspond to periods of global warming and meridional epochs correspond to periods of global cooling (Sharp, 2003). Long-term changes in global scale indexes (LOD) have also been associated with changes in regional processes in the Pacific, such as intensity of local upwelling and basin-wide sea level pressure (Sharp, 2003). That is, there is a direct wind-driven force that occurs in synchrony with LOD and that controls warm/cold regimes in the Pacific Ocean. These regimes are known to affect the marine fauna of the North Pacific, including the large populations of small pelagic fish. Studies in Eastern Boundary Ecosystems show for instance that anchovies thrive during cooler coastal upwelling periods. Pilchards prefer warmer conditions and seem to cope with the strong upwelling periods by subsisting in small colonies away from the upwelling influences (Sharp, 2003). Klyashtorin used the ACI and LOD as suitable climatic indexes for further investigation of long-term regular changes in catches of major commercial fish stocks.
CLIMATE-FISHERIES CORRELATION
Evidence of the relationship between climate and fisheries landings comes from two main sources: a few long-term indices of climate and fish stock size up to 1700 years, which show similar cyclic patterns as well as correlation between series; and fluctuations in catches of 12 major commercial species in the Atlantic and Pacific, which have synchronized since 1900, corresponding to climatic indices over the same period. Both long- and short-term series appear to have a common cycle. The most pronounced periodicity of long-term fluctuations in catches for all time series (excluding anchovy) varies from about 54 to 58 years. The corresponding climate cycles (both measured and reconstructed) vary from 50 to 65 years (with an average of 56 years). Other less significant cycles (13 and 20 year fluctuations of summer temperature) may also be of interest, but so far no reliable correlation between these cycles and commercial catch fluctuations have been found.
Figure C4.5. Annual catch of Japanese pilchard (A, top) and Pacific salmon (B, bottom) in relation to the zonal atmospheric circulation index (ACI) (from Klyashtorin, 2001)
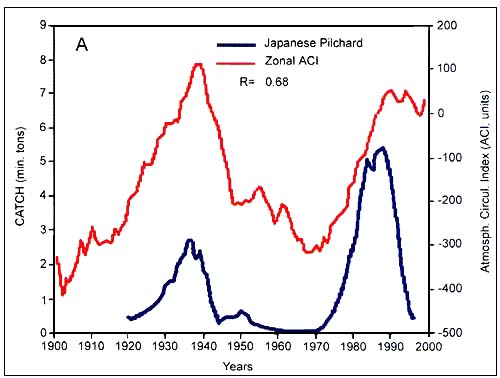
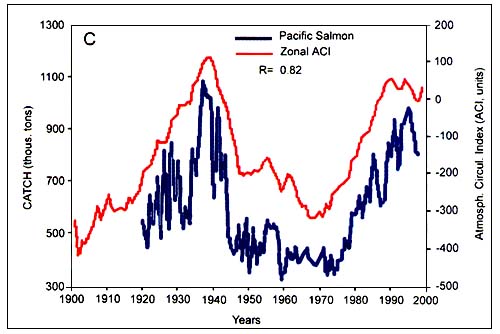
Figure C4.6. Annual catch of Atlantic cod (A, top) and Pacific herring (B, bottom) in relation to the meridional atmospheric circulation index (ACI) (from Klyashtorin, 2001)
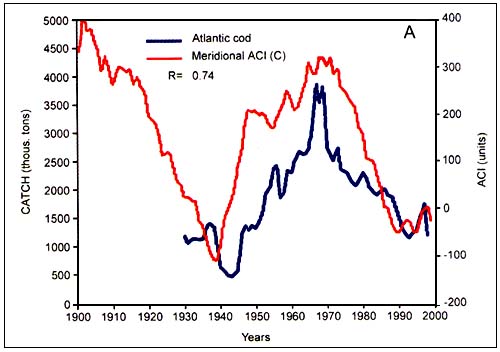
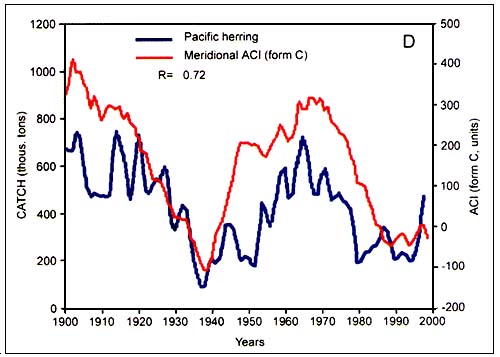
According to the peculiarities of their long-term dynamics, Klyashtorin divided the 12 species that were examined in two groups. The first group consisted of Japanese, California and South American pilchard, Pacific salmon, Alaska pollock, Chilean jack mackerel and European sardine. Catch time series of these species show a maximum in the late 1930s and early 1990s and minimum in the 1960s. The second group comprizes Atlantic cod, Atlantic and Pacific herring, South African pilchard and Peruvian anchovy. It shows a production cycle opposite in phase, with maximum catch in the 1960s and the minimum in 1930s and 1990s. While the catch of the first group (Figure C4.5) are closely correlated with the zonal ACI curve, catches of the second group (Figure C4.6) are closely correlated with the meridional ACI curve.
Among the long-term cycles, Japanese chronicles contain historical information on Japanese pilchard abundance for the last 400 years (FigureC4.2). Changes in the availability and abundance of pilchards off Japan led to the development of several coastal fishing villages, as well as the collapse of others. The average cycle length is about 60 years, and periods of high abundance tend to coincide with warmer atmospheric periods.
Off the coast of California, anaerobic conditions in seasonally layered sediments have preserved fish scales from populations of small pelagic fish. Two time series of the abundance index could be reconstructed for pilchard and anchovy stocks for the last 1700 years from these sediments (Baumgartner, Soutar and Ferreira-Bartrina, 1992). Although they demonstrate large fluctuations, these time series show no clear differences between the earlier period, when fishing was negligible, and the more recentperiod, when exploitation has become far greater.
Analysis of the long-time series of sediment scales indicated two principal oscillations in pilchard abundance: one occurring every 54 to 57 years, and the other every 223 to 273 years. The first of these oscillations is similar to that observed in both air temperature as measured from fossil ice cores and pilchard biomass, making it particularly important for fishery forecasting. Dominant fluctuation periods for anchovy are about 100, 70 and 55 years in duration. The increases in pilchard and anchovy abundance appear to be linked, respectively, to the two atmospheric regimes (zonal and meridional epochs) that have already been mentioned, suggesting that these two species may be favoured by different climatic conditions. However, unlike other commercial pelagic species, the regular climate-dependent dynamics of Peruvian anchovy are greatly perturbed every 10 to 15 years by strong El Niño events, so the future catch dynamics of this species are not well approximated by a smooth “average” curve. In non-El Niño years about 70 to 90 percent of the total anchovy catch in the Pacific is Peruvian anchovy.
It is reasonable to expect that fish catches would have a greater correlation with corresponding regional climatic indices than with more global ones. However, the results obtained by Klyashtorin (2001) suggest that the catch dynamics of the main Pacific commercial species (Pacific salmon, Japanese, Californian and South American pilchard, Alaska pollock and Chilean jack mackerel) are in closer correlation with the global climatic indices, dT and ACI than they are with their corresponding regional indices. There is not as yet a satisfactory explanation for this.
One possible explanation for the weak correlation with regional indices is the tendency, in climate-fisheries analyses, to lump together data from wide regions and geographically separated stocks. That seems to be case for the populations of Pacific salmon. Analysing recruitment rates of multiple salmon stocks from different watersheds in British Columbia and Alaska, Peterman et al. (1998) concluded that environmental causes of variation in survival rates operate mainly on regional spatial scales. They showed, for example, that a decadal shift in productivity in the 1970s, as proposed by Klyashtorin, occurred only in salmon stocks from certain watersheds. This indicates that important environmental processes affecting salmon survival operate at regional scale, rather than at ocean-basin scale. In the case of Pacific salmon stocks the causes of changes in productivity are the result of a combination of both freshwater and marine processes which are still not completely understood.
FORECASTING POSSIBILITIES
One particularly interesting feature of the correlations between dT, LOD and ACI indices is that although the curves are very similar in shape, the changes in dT lags behind LOD by approximately 6 years (Figure C4.3) and behind ACI by 4 years. This coincidence makes it possible to predict dT dynamics for at least 6 years ahead. The observed time lag between climatic indices, their recurrent pattern in the past, and their synchronous oscillation with fisheries production has prompted Klyashtorin to forecast changes in climate and marine populations.
Assuming that the observed past correlation between fish catches and atmospheric regimes will continue in the future, Klyashtorin attempts to forecast total catches of a selected group of major commercial species by fixing the cycle periods at 55, 60 and 65 years (based on the climate cycle) rather than relying on estimates of the cycle length from the relatively short catch time series. His analyses suggest that a shift between the two alternative atmospheric regimes is, indeed, occurring. As a result, provided that the observed synchrony between fish and climatic epochs persists, and that fishing effort does not change substantially, production of the selected major commercial species over the next decade would be expected to decrease in the North Pacific and increase in the North Atlantic (FigureC4.7). Forecasting of the major commercial fish catches for the next 30 to 40 years is largely insensitive to the choice of periodicity within the 55 to 65 year range. Species such as Atlantic and Pacific herring, Atlantic cod, South African pilchard and Peruvian and Japanese anchovy would be expected to increase during 2000–2015, decreasing thereafter. During the same period, total catch of species such as Japanese, South American, Californian and European pilchard (or sardines), Pacific salmon, Alaska pollock and Chilean jack mackerel would be expected to decrease, increasing thereafter. Overall, the total catch of the main world commercial species considered in the analyses, and representing about one-third of world marine capture landings, would be expected to increase by 5.6 million tonnes by 2015, then to decrease by 2.9 million tonnes by 2030, due to climate effects alone.
CAUTIONS AND LIMITATIONS
Klyashtorin concluded that climatic periodicity serves as a basis for predicting production and catches of major commercial fish species. He warns however that his model is applicable to the abundant species only (commercial catch >1–1.5 million tonnes) yielded over large areas, such as North Pacific or North Atlantic as a whole. One other limitation highlighted by the author is that forecasts will be valid only with the assumption that the intensity of commercial fishing does not change substantially from the average of the last 20–25 years.
As suggested by Sharp (2003) one important requirement for studying complex systems, such as the interaction between climate and fisheries, are reasonable monitoring schemes, operated for sufficiently long periods so they could capture the full system dynamics. In fisheries there are very few cases where time-series cover more than one or two complete rise and fall cycles for the populations involved. There are even fewer cases that are accompanied by observations of the forcing system(s) that directly or indirectly affect them. Data scarcity is, according to Sharp (2003), one of the main problems that limit the forecasting capabilities of the effect of climate on fisheries. To make matters even worse in this respect, most of the fishery data used in climatic analyses are from the last 50 years, a period which, according to the author, is notable for its lack of dynamics and low variance in comparison to century and longer time-scale records.
Figure C4.7. Observed (1920–1998) and forecast (2000–2040) catches changes for selected major commercial species in the North Atlantic and North Pacific (redrawn afterKlyasthorin, 2001)
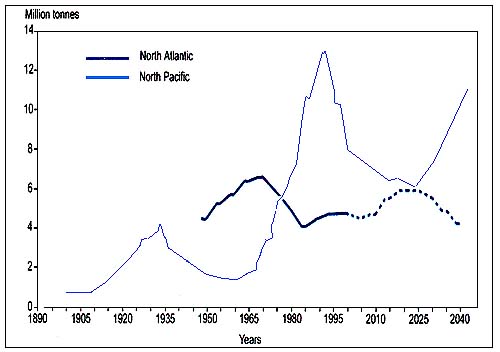
It is also important to consider that the 50 years of data available for most stocks examined by Klyashtorin (2001) are from a period marked by the most drastic changes in fishing effort and in the technologies for fish location and capture. These changes enabled fisheries to expand to areas not fished before and with a much higher efficiency. The analysis of trends in fisheries catches during this period has to take such effects into account. Finally, as components of ecosystems, fish stocks are linked to other species through predator-prey and other types of interactions, therefore large removals of fish biomass by fisheries are expected to cause positive and negative responses in production of other resources, which may themselves be also target by commercial fisheries. There are many examples in the literature of changes of species dominance as a possible consequence of competition or predation release. For instance, Fogarty and Murawski (1998) showed evidence that a reduction of more than 50 percent of gadid and flounders biomass on Georges Bank due to fisheries has led to an increase in the abundance of dogfish sharks and skates. Attempts have been also made to link the observed alternations between pilchard and anchovy species to overfishing and trophic mechanisms. The most frequently visited hypotheses in the literature are food competition, and predation of adult anchovy/pilchard on the early life stages of the competing species (Vasconcellos, 2000).
In summary, any trends in fisheries catches during the last 50 years should be viewed as the result of the interaction of human (fisheries), ecological and climatic processes on fish populations, but their relative importance remains unknown. These processes are confounded in the time series of catch statistics; hence any forecast and correlations based on this data should be viewed with caution.
POLICY IMPLICATIONS
Climate changes can affect fisheries in both short and long term. While fisheries have developed mechanisms to cope with short-term environmental variations (e.g. seasonal calendars of activities), it is the long-term component of variability (between years and decades) that is less understood, normally unpredictable and most influential to fisheries sustainability.
The possibility of forecasting long-term changes in world capture fish production, based on observable indices of long-term climatic variability, raises justified scientific, economic and policy expectations and concerns. Management organizations tend to assume that fishing pressure is the major influence on the long-term productivity and size of wild fish stocks. It is commonly accepted that appropriate management could maintain stock size that are commensurate with sustainable high catches, and that the usual consequences of management failure are depressed - and even depleted - stock sizes and lower yields. Recognition that, for some key species, deterministic long-term climate-driven impacts on stock abundance are, or could be, as important as suggested calls for a review of research and management strategies and objectives regarding fisheries of the species concerned, as well as of related species. Management responses to short-term fluctuations would have to take into account the possibility that underlying long-term deterministic fluctuations exist. Long-term management aims, which would typically involve capital investment, and social and infrastructure development, would also benefit from consideration of the long-term climate effects.
Overall, deterministic climate-driven increases and decreases in fish production do not seem to be of great global importance, as increases in a group of stocks in one region tend to be balanced by decreases in another group in another region. However, the fact that long-term climatic changes could determine major epochal increases in fish production from some stocks in some areas, and equivalent declines from other stocks and areas, merits serious consideration because the impacts at the local and regional levels are bound to be far larger. For instance, at present, large international market flows come from developing into developed areas (i.e., from the south to the north), but the oscillations in production between the North Atlantic and the Pacific Ocean are likely to result in changes to these trade flows. Such changes would have significant impacts on national and regional markets, even though the total world supply could remain stable. Changes in investments and fleet movements (and fishing agreements) are also expected to be greater than suggested by the world accumulated total landing figures.
This analysis has not considered anthropogenic climate change and its possible effects on fish production. However, as available data suggest that there is a link between fish production and climate, the need to include the effects of global warming in possible projections is clear. The results reported suggest that shifts in climate could have noticeable positive or negative effects on some, if not most, major commercial fish stocks.
One important element of the interaction between fisheries and climate is uncertainty. In this context an important policy question is how management strategies should be formulated in order to cope with uncertainties on future climatic changes affecting fish stocks? There seems to be a worldwide consensus that a key element of long enduring resource-base human systems in a changing environment is adaptation (IPCC, 2001). Fisheries management adaptation to climate changes can be based on formal and informal arrangements. Formal policies refer to actions taken by Governments, including legislation, regulations and incentives to mandate or facilitate changes in socio-economic systems, aimed at reducing vulnerability to climate change. Informally, fishing communities have also found ways to increase their chances of success and survival in a changing environment. Community adaptive strategies include flexibility in seasonal fishing patterns, the development of networks for sharing food and other resources and intercommunity trade (Berkes and Jolly, 2001). The goal of adaptive management policies and strategies is to reduce vulnerability, and research on vulnerability of fisheries to present and future changes in climate can certainly contribute to the formulation of better adaptive policies.
Fisheries management under climatic uncertainties can also benefit from risk assessment and management procedures and the adoption of a precautionary approach (Cochrane, 2002). The risk to be assessed and managed in this particular case would be the probability that stocks will fall below minimum accepted thresholds as a result of climate and fisheries. A strategy that tighten protection of the resource at periods of low abundance and/or when it goes below a certain threshold and allows fishing to expand when abundance is high, has been suggested as an alternative to deal with highly variable resources and fisheries (MacCall, 1980; Csirke, 1984, 1987). This should provide sufficient protection from fisheries driven depletion while allowing fishing to expand to make full use of epochs of high abundance. However, this approach relies on timely and reliable information on what would happen next and the capability of managers and harvesters to adapt timely to these changes, the absence of which will only add to the underlying uncertainty. But risk management involves to a large extent finding, and taking, decisions that are more robust to the uncertainties on future climatic regimes and to lack of knowledge. A robust strategy is one that minimizes the chances that a decision will go very wrong and that leaves room for ignorance. In this respect, it has been proposed that in many instances a robust strategy to cope with uncertainties created by climatic effects on marine fish populations is rather the adoption of a constant harvest rate rule, in which a fixed proportion of the stock is allowed to be harvested annually (Walters and Parma, 1996).
Management strategies should also allow quick adaptation in case the system does not behave as the assessment suggested without causing unnecessary economic and social disorder (Cochrane, 2002). The precautionary approach, on the other hand, sets the general principles to be adopted when taking uncertainties into account in fisheries management decisions. The precautionary approach proposes that when there are uncertainties about the productive capacity of the stocks priority should be given to conservation. One example of precautionary actions for fish stocks characterized by long-term regimes in productivity is to adopt conservative management measures and adjust investment plans considering the high fish productivity in a preceding regime as a limit. Precaution also involves avoiding changes that may not be potentially reversible and prior identification of undesirable outcomes and measures that will avoid or correct them promptly.
Lastly, the success of any management strategy to cope with climate variability hinges on information. One of the major constraints in understanding the causes of regional variations in fisheries production and forecasting future regimes is the lack of long-term data. Information about past changes and impacts also plays a fundamental role in building management institutions with the required adaptive flexibility, as expectations about future changes tend to be better understood if there is a clear parallel with past experience (IPCC, 2001). Improvements of the quantity and quality of information on fishery-climate interactions depend on better fishery monitoring schemes, the development of integrated sampling systems for physical and biological properties of the ocean, including the abundance of fish early life cycles, advances in circulation and ecosystem models, as well as collection of data on social and economic impacts of climate variability and extremes.
REFERENCES
Bakun, A. 1990. Global climate change and intensification of coastal ocean upwelling. Science, 247: 198–200.
Bakun, A. 1996. Ocean processes and marine population dynamics. California Sea Grant and Centro de Investigaciones Biologicas, La Paz, Mexico. 323p.
Baumgartner, T.R., A. Soutar & Ferreira-Bartrina, V. 1992. Reconstruction of the history of Pacific sardine and northern anchovy populations over the past two millennia from sediments of the Santa Barbara Basin, California. CalCOFI Report, 33:24–40.
Beamish, R.J. & Bouillon, D.R. 1993. Pacific salmon production trends in relation to climate. Can. J. Fish. Aquat. Sci., 50: 1002–1016.
Berkes, F. & Jolly, D. 2001. Adapting to climate change: Social-ecological resilience in a Canadian western Arctic community. Conservation Ecology 5(2): 18p.
Beverton, R.J.H. & Holt, S.J. 1957. On the dynamics of exploited fish populations. Fishery Invest., Lond., Series 2, 19: 533p.
Conser, R.J. Hill, K.T. Crone, P.R. Lo, N.C.H. & Bergen, D. 2002. Stock assessment of Pacific sardine with management recommendations for 2003. Executive Summary. Pacific Fishery Management Council, October 2002. 11p.
Cochrane, K.L. 2002. A fishery manager's guidebook. Management measures and their application. FAO Fisheries Technical Paper, No. 424: 231p.
Csirke, J. 1984. Report of the working group on fisheries management, implications and interactions. In G.D.Sharp & J. Csirke, eds. Reports of the Expert Consultation to examine changes in abundance and species composition of neritic fish resources. San José, Costa Rica, 18–29 April 1983. pp. 67–90. FAO Fisheries Report, No. 291 Vol.1: 102p.
Csirke, J. 1987. The patagonian fishery resources and the off-shore fisheries in the South-West Atlantic. FAO Fisheries Technical Paper, No. 286: 75p.
Csirke, J. 1995. Fluctuations in abundance of small and midsize pelagics. In C. Bas, J.J.Castro & J.M. Lorenzo eds. International Symposium on Middle-Sized Pelagic Fish. Sci. Mar., 59: 481–492 (see also erratum: Sci. Mar. 60: 431).
Csirke, J. & Sharp, G.D. (eds). 1984. Reports of the Expert Consultation to examine changes in abundance and species composition of neritic fish resources. San José, Costa Rica, 18–29 April 1983. FAO Fisheries Report, No. 291 Vol.1: 102 pp. (also available from http://www.fao;org/fi)
Fogarty, M.J. & Murawski, S.A. 1998. Large-scale disturbance and the structure of marine systems: fishery impacts on Georges Bank. Ecological Applications, 8(1): 6–22.
Francis, R.C. 1990. Climate change and marine fisheries. Fisheries (Bull. Amer. Fish. Soc.), 15(6): 7–10.
Garrod, D.J. & Schumacher, A. 1994. North Atlantic cod: the broad canvas. ICES Mar. Sci. Symposium, 198: 59–76.
Glantz, M.H. 1990. Does history have a future? Forecasting climate change effects on fisheries by analogy. Fisheries (Bull. Amer. Fish. Soc.), 15(6): 39–45.
Gulland, J.A. 1969. Manual of methods for fish stock assessment. Part 1. Fish population analysis. FAO Manual in Fisheries Science., (4): 154 pp.
IPCC. 2001. Climate Change 2001: Synthesis Report. Summary for Policymakers. 34 pp.
Jonsson, J. 1994. Fisheries off Iceland, 1600–1900. ICES Mar. Sci. Symposium, 198: 3–16.
Kawasaki, T. 1983. Why do some pelagic fishes have wide fluctuations in their numbers? Biological basis of fluctuation from the viewpoint of evolutionary ecology. In G.D.Sharp & J. Csirke, eds. Proceedings of the Expert Consultation to examine changes in abundance and species composition of neritic fish resources. San José, Costa Rica, 18–29 April 1983. pp. 1065–1080. FAO Fisheries Report, No. 291 Vol.3: 557–1224.
Kawasaki, T. 1992. Climate-dependent fluctuations in far eastern sardine population and their impact on fisheries and society. In M. Glantz, ed. Climate variability, climate change and fisheries, pp. 325–355. Cambridge Univ. Press.
Kawasaki, T. 1994. A decade of the regime shift of small pelagics. FAO Expert Consultation (1983) to the PICES III (1994). Bull. Japanese Soc. Fish. Ocean, 58: 321–333.
Klyashtorin, L.B. 2001. Climate change and long-term fluctuations of commercial catches: the possibility of forecasting. Rome, FAO Fisheries Technical Paper, No. 410: 86 pp.
Lindquist, A.V. 1983. H erring and sprat: fishery independent variations in abundance. In G.D.Sharp & J. Csirke, eds. Proceedings of the Expert Consultation to examine changes in abundance and species composition of neritic fish resources. San José, Costa Rica, 18–29 April 1983. pp. 813–821. FAO Fisheries Report, No. 291 Vol.3: 557–-1224.
Ljungman, A.V. 1879. Bidrag till lösningen of fragan om de stora sillfiskenas sekulära periodicitet. Nord. Tidskr. f. Fiskeri : pp. 257–268.
Lluch-Belda, D. Hernandez-Vazquez, S., Salinas-Zavala, C. & Shwartzlose, R. 1992. The recovery of the California sardine as related to global change. Calif. Coop. Oceanic Fish. Invest. Rep., 33: 50–59.
MacCall, A.D. 1980. Population models for the northern anchovy (Engraulis mordax ). Rapp. P.–V. Réun. CIEM, 177: 282–306.
Peterman, R.M., Pyper, B.J., Lapointe, M.F., Adkison, M.D. & Walters, C.J. 1998. Patterns of covariation in survival rates of British Columbian and Alaskan sockeye salmon (Oncorhynchus nerka ) stocks. Can. J. Fish. Aquat. Sci., 55: 2503–2517.
Ravier, C. and Fromentin, J.M. 2001. Long-term fluctuations in the eastern Atlantic and Mediterranean bluefin tuna populations. ICES Journal of Marine Science 58: 1299–1317.
Ravier, C. and J-M. Fromentin, J.M. 2004Are the long-term fluctuations in Atlantic bluefin tuna (Thunnus thynnus) population related to environmental changes. Fisheries Oceanography, 13(3):145–160.
Regier, H.A. & Meisner, J.D. 1990. Anticipated effects of climate change on freshwater fishes and their habitats. Fisheries (Bull. Amer. Fish. Soc.), 15(6): 10–15.
Ricker, W.E. 1958. Handbook of computations for biological statistics of fish populations. Bull. Fish. Res. Bd. Can., 119: 300 pp.
Russell, E.S. 1931. Some theoretical considerations on the overfishing problem. J.Cons. Perm. Int. Explor. Mer., 6(1): 3–27
Sharp, G.D. 2003. Future climate change, and regional fisheries: a collaborative analysis. FAO Fisheries Technical Paper, No. 452: 75 pp.
Sharp, G.D. & Csirke, J. (eds). 1983. Proceedings of the Expert Consultation to examine changes in abundance and species composition of neritic fish resources. San José, Costa Rica, 18–29 April 1983. FAO Fisheries Report, No. 291 Vols. 2–3: 1224 pp.
Vasconcellos, M.C. 2000. Ecosystem impacts of fishing forage fishes. An analysis of harvesting strategies for the Brazilian sardine. PhD Thesis. University of British Columbia. Canada. 190 pp.
Walters, C.J. & Parma, A.M. 1996. Fixed exploitation rate strategies for coping with effects of climate changes. Can. J. Fish. Aquat. Sci., 53: 148–158.
* FAO, Marine Resources Service, Fishery Resources Division