![]()
![]()
![]()
This and the following chapters 4 and 5 present the main findings and analyses of the survey. This chapter describes the demographic, socio-economic, food, health and nutrition characteristics and results, disaggregated by age and sex as appropriate. Significant differences are highlighted, using the cut-off of p < 0.05 to define differences that are statistically significant. The characteristics of the households included in the survey sample are presented first, followed by the characteristics of the individuals.
HOUSEHOLD SIZE AND COMPOSITION
A total of 1 051 households were included in the sample. Household size (Table 3.1) ranged from one to 14 members, with a mean of 2.92 and a median of three.
Households with only men represented 16.9 percent (178) of all households, while 17.6 percent (185) of households comprised females only.
A little more than 25 percent of the total (25.2 percent, N = 265) were single-person households. Of these, 41 percent (109) were females and 59 percent (156) males.
44.6 percent (469) of households were headed by women; 23.6 percent (179) of men and 58.9 percent (557) of women lived in households headed by women.
INCOME
Nearly a quarter of the households (23.4 percent, N = 246) failed to provide data on income (they either refused to answer questions or did not know the answers). Of those who responded:
monthly income per person ranged from B$16.5 to B$25 616;
the median income was B$600 per person per month;
using the UNDP poverty cut off of B$5 503 per annum per household (equivalent to B$459 per household per month), 14.9 percent of households fell below the poverty line, compared with the national figure of 9 percent (see Chapter 1).
Table 3.1 Household size
| Number of members | Number of households | Percentage of households |
| 1 | 265 | 25.2% |
| 2 | 256 | 24.4% |
| 3 - 4 | 356 | 33.9% |
| ³ 5 | 174 | 16.6% |
| Total | 1 051 | 100% |
Monthly income per capita deciles are shown in Figure 1. Of the households that provided information on income:
68.1 percent (567) received one or more wages;
23.6 percent (248) received one or more pensions;
4.8 percent (50) received cash from relatives or friends;
3.2 percent (27) acquired some income through sales of produce;
4.3 percent (45) had other sources of income;
46.6 percent of the largest families (³ 5 members) fell into the lowest quartile (£ B$320) of income per person per month;
33.3 percent (46) of the female-only households fell into the lowest income per person quartile, compared with 13.5 percent of male-only households;
the median monthly income of female-headed households was significantly lower than that of male-headed ones:
| | Female-headed | Male-headed |
| - Income per household | B$1 200 | B$2 000 |
| - Income per person | B$471 | B$750 |
Figure 1 Monthly income per capita deciles
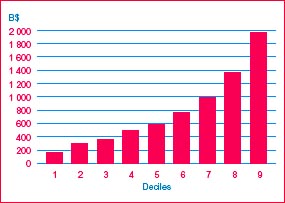
Table 3.2 Types of food crops grown
| Food crops | Percentage of households* |
| Starchy roots and tubers | 10.8 |
| Starchy fruits | 22.2 |
| Dark-green and yellow vegetables | 15.3 |
| Other vegetables | 22.2 |
| Legumes | 15.6 |
| Fruits | 84.4 |
| Seasonings and herbs | 12.9 |
| Other crops | 2.4 |
* Expressed as a percentage of households who stated that they were engaged in food production activities
Table 3.3 Constraints to food crop production
| Constraint | Percentage of households | |
| Engaged in food crop production | Not engaged in food crop production | |
| Insufficient land | 35.0 | 58.2 |
| Lack of labour | 15.0 | 8.3 |
| Household members too old | 9.2 | 10.7 |
| Praedial larceny | 10.1 | 3.4 |
| Other reasons | 12.7 | 5.6 |
| No constraints perceived | 30.7 | 22.1 |
FOOD ACQUISITION
Food production
Food crop production. A little more than 32 percent (32.2 percent, N = 338) of households engaged in food crop production. Of these:
25.7 percent had £ 50 square feet[6] of land under cultivation;
36.2 percent had 51-1 250 square feet of land under cultivation;
38 percent had more than 1 250 square feet of land under cultivation;
68 percent stated that some or all of the household members engaged in food production were £ 60 years of age;
34 percent stated that some or all of the household members engaged in food production were over 60 years of age.
Table 3.2 lists the types of food crops mentioned and the percentages of households (of those engaged in food production) that mentioned each crop. The fruits mentioned most frequently were limes, bananas and mangoes. The most popular green and yellow vegetables were okra, sweet peppers, carrots, lettuce and tomatoes.
All households were asked if they perceived any constraints to food crop production. Households engaged in food production interpreted this question as relating to difficulties experienced in crop production or constraints to increased crop production. Non-producer households interpreted it as asking for reasons for not engaging in food production activities. A total of 990 households answered the question. Table 3.3 lists the constraints identified by producer and non-producer households.
Livestock rearing. Only 11.2 percent (116) of households were engaged in livestock rearing. Poultry, sheep and pigs were the animals mentioned most frequently, by 53.8, 29.1 and 25.6 percent, respectively, of households stating that they engaged in livestock rearing.
Table 3.4 Constraints to livestock rearing
| Constraint | Percentage of households | |
| Engaged in livestock rearing (N = 99) | Not engaged in livestock rearing (N = 880) | |
| Insufficient land | 24.2 | 49.5 |
| Covenant land | 4.0 | 12.5 |
| Lack of labour | 7.1 | 7.6 |
| Household members too old | 4.0 | 10.5 |
| Complaints from neighbours | 2.0 | 4.8 |
| Other reasons | 5.1 | 9.7 |
| No perceived constraints | 53.5 | 17.6 |
As with the question on constraints to crop production, households engaged in livestock rearing interpreted the question on constraints differently from those not engaged in it. A total of 979 households answered the question. Table 3.4 lists their answers.
Food purchasing
The survey questioned households on their food purchasing habits in relation to the purchase of fish, fruits and vegetables, and other groceries. The following were the main findings:
Nearly 97 percent (1 015) of households purchased (or caught their own) fish.
Of these, 82 percent procured the fish from one source only. The fish market (there are three major fish markets in Barbados, as well as some smaller ones) was the most popular source of fish. The sources of fish mentioned were:
| - Fish market | 66 percent |
| - Supermarkets | 18 percent |
| - Fishers | 15 percent |
| - Wayside vendors | 9 percent |
| - Mobile vendors | 8 percent |
| - Own catch | 2 percent |
Supermarkets were the primary source of fruits and vegetables, and other groceries, but wayside vendors were also an important source for fresh produce:
| Source | Fruits and vegetables | Other groceries |
| - Supermarkets | 71 percent | 97 percent |
| - Wayside vendors | 37 percent | 1 percent |
| - Mobile vendors | 7 percent | 1 percent |
| - Village shops | 4 percent | 3 percent |
| - Automarts | 1 percent | 1 percent |
A total of 1 704 respondents from 1 051 households participated in the survey. Of these, 55.5 percent (945) were women and 44.5 percent (759) men. Only 2.6 percent (12) of women of child-bearing age (< 50 years) were pregnant, and 2.4 percent (11) stated that they were lactating. The age distribution of the survey sample is shown in Table 3.5.
EMPLOYMENT
Nearly 60 percent of the whole sample (68 percent of men and 53.1 percent of women) were employed. Of those who were unemployed, 80.6 percent of men and 85.8 percent of women were retired, students or housewives. Actual unemployment therefore stood at 6.2 percent among men and 6.7 percent among women. These figures are somewhat lower than the government rate of 9.3 percent for the year 2000. Table 3.6 provides the breakdown of employment by the different categories.
EDUCATION
The education level was high (Table 3.7), with 44.2 percent of the sample having completed secondary school, and a further 23 percent continuing to technical or vocational training (6.6 percent) or university (16.4 percent). There were no significant differences between men and women regarding the highest level of education attained.
Table 3.5 Age statistics and distribution, by sex
| | Men | Women | Total |
| Number | 759 | 945 | 1 704 |
| Mean age (SD) | 47.8 (17.6) years | 49.7 (17.7) years | 48.9 (17.7) years |
| Median | 46 years | 47 years | 47 years |
| Range | 18 -96 years | 18-99 years | 18-99 years |
| Age groups | |||
| 18-29 years | 17.2% | 14.1% | 15.5% |
| 30-39 years | 18.2% | 16.9% | 17.5% |
| 40-49 years | 21.7% | 23.5% | 22.7% |
| 50-59 years | 15.8% | 15.6% | 15.7% |
| 60-69 years | 12.4% | 13.9% | 13.2% |
| 70-79 years | 10.8% | 10.1% | 10.4% |
| ³ 80 years | 3.9% | 5.9% | 5.0% |
HEALTH AND NUTRITION
Chronic disease and diet
Respondents were asked whether they had ever been diagnosed with any of the following CNCDs: diabetes, hypertension, coronary heart disease and cancer. The survey did not attempt to diagnose the CNCDs among respondents, so the findings may reflect differences in health-seeking behaviour, in particular regarding the apparent difference in prevalence between men and women. The respondents were also asked whether either of their parents had ever suffered from any of these diseases. The results were as follows:
10.1 percent (77) of men and 15.2 percent (144) of women stated that they had been diagnosed with diabetes.
17.3 percent (131) of men and 28.8 percent of women (272) had been diagnosed as having high blood pressure.
3.8 percent (29) of men and 6.5 percent (61) of women had been diagnosed with heart disease.
2.0 percent (15) of men and 2.6 percent (25) of women had been diagnosed with cancer.
The prevalence of both diabetes and hypertension increased sharply with age - among those aged 50 years or over, 15.8 percent of men and 27 percent of women were diabetic while 28.2 percent of men and 47.1 percent of women were hypertensive.
Table 3.6 Percentages of men and women in each employment category
| Employment category | Men | Women | Total |
| Professional/semi-professional | 9.2 | 7.8 | 8.5 |
| Administrative/management | 7.0 | 6.1 | 6.5 |
| Skilled/technical | 24.8 | 6.8 | 14.8 |
| Clerical/service | 17.0 | 19.2 | 18.2 |
| Farmer | 0.7 | 0.6 | 0.6 |
| Labourer/domestic | 9.4 | 12.6 | 11.2 |
| Unemployed* | 32.0 | 46.9 | 40.3 |
* Includes retirees, students and housewives.
Table 3.7 Highest level of education attained, by sex (percentage)
| Highest level attained | Men | Women | Total |
| Primary | 32.4 | 33.1 | 32.8 |
| Secondary | 42.3 | 45.7 | 44.2 |
| Technical/vocational | 9.2 | 4.5 | 6.6 |
| Tertiary | 16.0 | 16.7 | 16.4 |
Table 3.8 shows the importance of having a family history of chronic disease as a risk factor for that disease. As expected, in all four chronic diseases investigated, the percentages of men and women diagnosed with a disease were higher among those with a family history of that disease.
Table 3.8 The relationship between family historya and diagnosedb chronic disease, by sex
| Disease | Percentage diagnosed with chronic disease | |||
| Men | Women | |||
| With family history | Without family history | With family history | Without family history | |
| Diabetes | 37.7 | 17.2 | 44.4 | 23.2 |
| High blood pressure | 35.1 | 21.4 | 47.1 | 28.5 |
| Heart disease | 27.6* | 4.2 | 9.8* | 8.7 |
| Cancer | 13.3* | 6.7 | 16.0* | 9. |
a The question related only to the existence of the disease in the biological parents of the individual.
b Diagnosed by a medical doctor or nurse.
* Sample sizes were small (£ 8). dietary management of the chronic disease. On the whole, more women than men stated that they followed a specific diet:
The survey investigated whether respondents followed specific diets that could be beneficial in the dietary management of the chronic disease. On the whole, more women than men stated that they followed a specific diet:
48.3 percent of men and 51.6 percent of women diagnosed with diabetes mentioned a diet that could assist in the dietary management of diabetes (low-calorie, low-fat, diabetic or low-sugar).
Only one man, but 23 percent of women diagnosed with heart disease mentioned a diet that could assist in the dietary management of heart disease (low-calorie, low-fat or low-cholesterol).
25.2 percent of men and 36 percent of women diagnosed with high blood pressure mentioned a diet that could assist in the dietary management of that disease (low-calorie, low-fat, low-cholesterol or low-salt).
Respondents without a diagnosed chronic disease but with a family history of a chronic disease were also asked whether they followed an appropriate diet as a preventive measure. The results were as follows:
10.1 percent of respondents with no diagnosed diabetes but with a family history of diabetes mentioned some form of diabetic diet.
13.2 percent of respondents with no diagnosed heart disease but with a family history of heart disease mentioned a diet that could reduce the risk of developing heart disease.
17 percent of respondents with a family history of high blood pressure mentioned a diet that could reduce the risk of developing high blood pressure. This was significantly higher than the proportion of respondents diagnosed with hypertension but had no family history who mentioned an appropriate diet.
The section on Healthy lifestyles in Chapter 5 discusses further issues related to CNCDs.
Nutritional status
Malnutrition, whether undernutrition or overnutrition, is a risk factor for many diseases. Overweight and obesity are established risk factors for many chronic disorders, especially those investigated in this survey - diabetes, hypertension, heart disease and many cancers. The survey therefore assessed the nutritional status of the respondents.
Valid weights and heights were obtained from 1 653 respondents (733 men and 920 women). The body mass index (BMI) is used as an indicator of the nutritional status of adults. It relates the weight of the individual to his/her height:
BMI (kg/m2) = weight (kg)/height (m)2
Table 3.9 Anthropometric characteristics, by sex
| Measure or index | Men | Women |
| 1. Weight (kg) | ||
| Mean (SD) | 77.0 (14.0) | 72.2 (15.2) |
| Median | 75.7 | 70.7 |
| Range | 41.2-130.9 | 35.8-131.4 |
| 2. Height (cm) | ||
| Mean (SD) | 173.0 (7.9) | 162.0 (7.2) |
| Median | 172.7 | 162.6 |
| Range | 134.6-198.1 | 134.6-198.1 |
| 3. BMI (kg/m2) | ||
| Mean (SD) | 25.8 (4.3) | 27.6 (5.6) |
| Median | 25.6 | 27.0 |
| Range | 15.1-45.4 | 14.5-49.7 |
Table 3.10 Comparison of mean BMIs of people in Barbados, Jamaica, the United Kingdom and the United States
| Country | Year | Age group | Mean (SD) BMI in kg/m2 | |
| Men | Women | |||
| Barbados* | 2000 | 18-64 | 26.0 (4.4) | 27.9 (5.6) |
| Jamaica | 1984 | 20-59 | - | 25.1 (4.2) |
| UK | 1990 | 16-64 | 24.9 (3.7) | 24.6 (5.1) |
| USA: Blacks | 1988-1994 | 20-59 | 26.6 (12.3) | 29.0 (17.1) |
| USA: Whites | 1988-1994 | 20-59 | 26.7 (10.7) | 26.0 (15.2) |
| Jamaica | 1993-1995 | 25-74 | 23.4 (4.3) | 27.5 (6.4) |
| Barbados | 1993 | 40-79 | 25.8 (3.6) | 28.0 (5.5) |
| Barbados* | 2000 | _ 65 | 25.0 (3.8) | 26.6 (5.2) |
| Jamaica | 1984 | _ 60 | - | 25.5 (4.3) |
| UK | 1998 | _ 65 | 26.5 (3.7) | 26.8 (4.7) |
| USA: Blacks | 1988-1994 | _ 60 | 26.2 (11.4) | 29.3 (13.2) |
| USA: Whites | 1988-1994 | _ 60 | 26.4 (7.8) | 26.3 (11.8) |
* Current survey.
Source: Data for this table come from Broome, 1984; HMSO, 1990 and 1998; CDC, 1988-1994; Fraser et al., 1996; and Foster et al., 1993.
Table 3.9 gives the anthropometric characteristics (weight, height, BMI) of the respondents.
Table 3.10 compares the Barbados BMI figures with similar figures from the United Kingdom and the United States. Mean BMIs of Barbadian men aged less than 64 years are similar to those from the United States, but Barbadian women in both the younger and older age groups have substantially lower mean BMIs than their counterparts from the black United States population, as do the older Barbadian men. These differences in means between Barbadians and people from the United States, although apparently small, can have a significant impact on disease prevalence. Older Barbadian women have a mean BMI that is closer to the mean of their counterparts from the United Kingdom.
FAO/WHO have established BMI cut-offs to define underweight, normal weight, overweight (pre-obesity) and three degrees of obesity. According to this classification, the survey respondents' mean BMIs of 25.8 kg/m2 (men) and 27.6 kg/m2 (women) are high, and fall into the overweight (pre-obese) category. The means of the BMIs of respondents aged 40 to 79 years are 26.4 kg/m2 for men and 28.2 kg/m2 for women. These figures are similar to those found in the Barbados (1993) study shown in Table 3.10.
Table 3.11 Nutritional status of respondents, by sex
| Nutritional status | BMI (kg/m2) range | Men | Women | Total sample | |||
| N | % | N | % | N | % | ||
| Underweight | <18.5 | 23 | 3.1 | 30 | 3.3 | 53 | 3.2 |
| Normal weight | 18.5-25.0 | 301 | 41.1 | 302 | 32.8 | 603 | 36.5 |
| Overweight (pre-obesity) | 25.1-30.0 | 296 | 40.4 | 315 | 34.2 | 611 | 37.0 |
| Obesity I | 30.1-35.0 | 94 | 12.8 | 178 | 19.3 | 272 | 16.5 |
| Obesity II and III | >35.0 | 19 | 2.6 | 95 | 10.3 | 114 | 6.9 |
Table 3.11 classifies the respondents according to BMI categories. The prevalence of overweight (pre-obesity) and obesity among adult Barbadians is very high (60.4 percent), and is significantly higher among women (63.8 percent) than men (55.8 percent). As a comparison, the prevalence of overweight and obesity among 277 urban Jamaican women was 50.5 percent (Broome, 1984).
Figure 2 Percentage overweight by age group
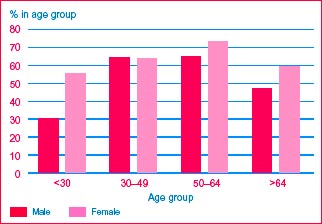
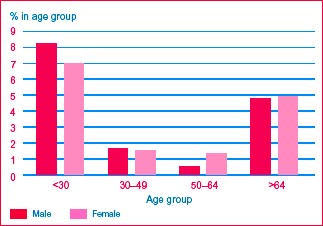
Figure 3 Percentage underweight by age group
Of special concern is the fact that nearly 30 percent of Barbadian women fall in the higher grades of overnutrition: obesity grades I to III. This figure is very similar to that found in urban communities of Jamaica (Jackson et al., 2002), where prevalence is 30.7 percent. Barbadian men however had a much higher prevalence of obesity (15.4 percent) than urban Jamaicans (6.7 percent).
Figures 2 and 3[7] show the variations in prevalence of overweight (and obesity) and underweight among Barbadian men and women by age group. The prevalence of overweight increases steadily with age, until the 60s when it begins to fall (Figure 2). Overweight and obesity in young women (< 30 years) is alarmingly high at more than 50 percent.
Underweight is also found in both young men and young women (Figure 3: 8.3 percent among men and 7 percent among women < 30 years), as well as among older people (4.8 percent in men and 5 percent in women).
However, the prevalence of underweight among Barbadians aged 30 to 64 years is well below 2 percent, no higher than would be expected in any healthy adult population. Moderate and severe undernutrition (16 to 17 kg/m2 and < 16 kg/m2, respectively) are virtually non-existent in any age group. Clearly the primary nutrition problem of Barbadian adults is overweight and obesity, but the lack of comparable data makes it impossible to comment reliably on trends.
Perceptions of nutritional status, dieting and exercise
The first step in efforts to reduce weight is to recognize that one is overweight. The survey asked respondents whether they perceived themselves to be underweight, overweight or of the correct weight (Tables 3.12 and 3.13). Only 40 percent of men and 59.2 percent of women who were overweight or obese considered themselves overweight. In 1981, the Barbados National Health and Nutrition Survey found that 47.2 percent of obese women considered themselves "fat".[8]
Young women were more likely to recognize overweight in themselves than older women. This contrasted with young men, who were less likely to do so than older men. Moreover, awareness of overweight was less frequent among overweight respondents with lower educational attainment (primary school only) than among those with higher educational attainment. Recognition of overweight and obesity was not significantly related to economic status.
Even fewer men and women recognized underweight in themselves: only 30.4 percent of underweight men and 26.7 percent of underweight women considered themselves to be underweight.
Table 3.12 Men's perception of own weight by actual nutritional status
| Actual nutritional status: BMI (kg/m2) category | Perception of own weight (percentage in BMI category) | ||
| Underweight | Correct weight | Overweight | |
| Underweight (< 18.5) | 30.4 | 69.6 | 0 |
| Normal weight (18.5-25.0) | 9.0 | 87.0 | 4.0 |
| Overweight (> 25.0) | 0.8 | 59.3 | 40.1 |
Note: Correct perception underlined.
Table 3.13 Women's perception of own weight by actual nutritional status
| Actual nutritional status: BMI (kg/m2) category | Perception of own weight (percentage in BMI category) | ||
| Underweight | Correct weight | Overweight | |
| Underweight (< 18.5) | 26.7 | 66.7 | 6.7 |
| Normal weight (18.5-25.0) | 3.6 | 85.4 | 10.9 |
| Overweight (> 25.0) | 0.7 | 40.1 | 59.2 |
Note: Correct perception underlined.
However, smaller percentages of the respondents (29.4 percent of men and 45.3 percent of women) stated that they would like to change their weight. Of these, 19.4 percent of men and 5.0 percent of women wished to gain weight, and 80.6 percent of men and 95.0 percent of women wished to lose weight.
Very few men and women stated that they were on weight reduction diets (low-calorie or low-fat): only 1.7 percent of all men and 3.5 percent of all women. The percentages were higher (but still low) among overweight respondents, at 7.3 percent of men and 10 percent of women.
An essential component of any weight reduction strategy is to increase energy expenditure through a programme of exercise. The survey made no effort to assess normal energy expenditure and physical activity levels, but it did ask respondents whether they engaged in planned exercise. Fairly high percentages of men (48 percent) and women (37.6 percent) claimed that they took planned exercise. Surprisingly, there was no difference between overweight and non-overweight respondents. Among those who stated that they engaged in planned exercise, walking was by far the most popular (41 percent), followed by aerobics (14.6 percent), jogging (8.1 percent), ball games (7.5 percent), swimming (7.2 percent), gardening (5.5 percent), cycling (5.4 percent), and body building (4.7 percent).
Food practices
Other than those related to chronic diseases, respondents mentioned a number of diets that they followed. The most popular of these were vegetarian and semi-vegetarian diets (11.6 percent of men and 0.3 percent of women).
The survey gathered information on the frequency of purchasing meals outside the home (Table 3.14), and the locations where the meals were purchased (Table 3.15). The results indicated that eating out and purchasing ready-to-eat meals are widely prevalent in Barbados.
Table 3.14 Total purchase of ready-to eat-meals,* by age and sex
| Frequency of purchase | Percentage of each group | ||||
| < 30 years | 30-49 years | 50-64 years | ³ 65 years | % of sample (by sex) | |
| Men | |||||
| Never | 23.9 | 42.0 | 67.1 | 89.1 | 54.8 |
| 1-2 times per week | 29.2 | 28.6 | 20.4 | 6.8 | 22.2 |
| ³ 3 times per week | 46.9 | 29.4 | 12.5 | 4.1 | 23.1 |
| Women | |||||
| Never | 33.9 | 56.9 | 81.8 | 96.5 | 69.1 |
| 1-2 times per week | 40.2 | 23.2 | 15.1 | 3.5 | 18.9 |
| ³ 3 times per week | 25.9 | 19.9 | 3.1 | 0 | 12.1 |
* Including eating in restaurants, fast-food outlets and canteens.
Analysis by age and sex indicated the following:
A substantially higher percentage of men (45.3 percent) than women (31.0 percent) purchased ready-to-eat meals.
In both sexes, purchase of ready-to-eat meals was significantly higher in the younger age groups.
Nearly 47 percent of younger men (< 30 years) and 26 percent of younger women consumed ready-to-eat meals three or more times per week.
Table 3.15 Location of purchase of ready-to-eat meals, by age and sex
| Location | % of age group purchasing ready to eat meal ³ once a week | % of total sample | |||||||
| Men | Women | ||||||||
| < 30 | 30-49 | 50-64 | ³ 65 | < 30 | 30-49 | 50-64 | ³ 65 | ||
| Canteen | 35.7 | 24.8 | 18.1 | 2.0 | 18.7 | 15.1 | 4.0 | 1.0 | 14.6 |
| Fast food outlet | 53.7 | 35.1 | 15.2 | 4.7 | 44.0 | 26.3 | 10.1 | 1.5 | 23.1 |
| Restaurant | 26.2 | 16.0 | 7.5 | 4.1 | 24.6 | 16.7 | 8.0 | 1.0 | 12.7 |
| Supermarket | 8.2 | 2.9 | 3.8 | 1.4 | 2.5 | 4.0 | 2.0 | 0.5 | 3.0 |
| Automart | 14.0 | 6.5 | 3.2 | 0.7 | 4.2 | 3.7 | 2.0 | 0.5 | 4.0 |
| Other | 5.2 | 6.2 | 3.9 | 2.0 | 6.1 | 4.4 | 1.6 | 0.5 | 3.8 |
By far the most popular venues for such purchases were fast-food outlets:
Nearly 54 percent of men and 44 percent of women less than 30 years of age obtained meals at a fast-food outlet at least once a week.
More than 35 percent of men and 26 percent of women aged 30 to 49 years used a fast-food outlet at least once a week.
These findings are discussed further in the section on Healthy lifestyles in Chapter 5, in relation to food and nutrient intakes and socio-economic factors.
Use of supplements
A large proportion of respondents stated that they took micronutrient supplements: 41.3 percent of men and 47.3 percent of women took vitamin and mineral supplements. A smaller percentage of older (³ 60 years) than of younger men and women used such supplements.
Some 40 percent of respondents consumed one or more dietary supplements or dietetic products. A wide range of such products was mentioned, but most by very few respondents. Those consumed by more than 10 percent of men or women were cod liver oil (men: 14.2 percent; women: 20.2 percent) and Supligen (men: 17.3 percent; women: 8.8 percent).
Alcohol consumption
Respondents were asked whether they had consumed alcohol in the previous 24 hours. More men (25.6 percent) than women (6.8 percent) responded positively. Alcohol consumption was highest in the 40 to 59 years age group in both men (33.3 percent) and women (8.5 percent). These figures must be viewed with caution because responses regarding alcohol consumption are generally unreliable.
Healthy eating
The survey included some questions regarding healthy eating practices, which are presented in the following, along with the results:
Respondents were asked whether they felt that they consumed adequate amounts of fruit, vegetables, and peas and beans. The percentages of positive responses to this question were:
| - Fruit | 80 percent; |
| - Vegetables | 76 percent; |
| - Peas and beans | 84 percent. |
Table 3.16 Food preparation practices*
| Practice | Percentage of respondents from households where practice used | ||
| Always/usually | Sometimes | Rarely/never | |
| Remove skin/fat from poultry | 79.9 | 13.3 | 7.7 |
| Remove skin/fat from meat | 80.5 | 11.0 | 8.5 |
| Add butter, oil or margarine to gravy | 44.9 | 22.6 | 32.5 |
* Healthy practices underlined.
However, perceptions of adequate consumption of fruits and vegetables bore no relation to the reality: 86 percent of those respondents who were consuming less than the 370 g of fruits and vegetables a day recommended by WHO felt that they were consuming adequate amounts.
The percentages of men and women responding positively were very similar.
In both men and women, perceived adequacy increased with age, although there was no significant rise in actual consumption.
One respondent per household was questioned with regard to three practices related to healthy food preparation (see Table 3.16). About 80 percent of respondents lived in households where the skin and fat were removed from poultry or meat during preparation.
However, only 32.5 percent of respondents lived in households where fats (butter, oil or margarine) were rarely or never added during the preparation of gravy or sauce.
These findings are discussed further in the section on Healthy lifestyles in Chapter 5.
NUTRIENT INTAKES
Dietary intake data were obtained by means of 24-hour recalls (one per respondent). After removing cases with extreme values and those for whom ages[9] were missing, the total sample for dietary intake analysis was 1 600 individuals (711 men and 889 women).
The main findings were as follows:
Median energy intake was 2 136 kcals (8.95 MJ) for men and 1 715 kcals (7.17 MJ) for women (Table 3.17).
In both sexes, energy and nutrient intakes fell with age. However, when expressed as percentages of RDA, significantly higher levels of adequacy were found in the oldest age group (> 64 years) for energy, iron, vitamin A, thiamin, riboflavin and niacin for women, and for energy, thiamin and riboflavin for men (Table 3.18).
The median percentage adequacy of energy intake would seem to be low (at 82 percent across the total sample). However, in the context of the data on nutritional status (BMI) and the high prevalence of overweight and obesity, it is unlikely that the Barbadian population is undernourished as a whole (although there may be pockets of nutritional vulnerability). It is more likely that the 24-hour recall underestimated actual food intake, either because respondents failed to recall or mention all the foods consumed, or because household measures or portion sizes were underestimated. Furthermore, overweight individuals are more likely to underestimate portions or omit foods.[10]
Compared with men, women consumed a significantly higher proportion of the RDA for energy, but significantly lower proportions of the RDAs for calcium, iron and folate. There were no other significant differences in nutrient intakes between men and women.
Intakes of calcium and zinc in relation to the RDAs were particularly low across the whole sample (69 percent and 49 percent adequate, respectively). In the case of zinc, the actual intakes may be artificially low because of the absence of data on the zinc content of a number of foods, such as cassava, eddoes, some peas, beans and seeds, and many varieties of fish and shellfish, which are commonly consumed in the Caribbean.[11] While programme planners may decide to recommend increasing the calcium intake (especially in view of the link between calcium intake and osteoporosis in later years), the issue of zinc should be investigated further before action is taken.
On the whole, iron intakes were adequate. However, among women of child-bearing age they seem to be low (78 percent of RDA for the < 30 year age group, and 82 percent for the 30 to 49 years age group). This is investigated and discussed further in the section on Iron-deficiency anaemia in Chapter 5.
Also of concern among women of child-bearing age are the low intakes of folate. As with zinc, this is a nutrient for which the Caribbean Food Composition Tables frequently lack data. However, data are available for most of the food that are commonly consumed in Barbados, and so this survey finding is probably reasonably accurate. Low folate status has been associated with birth defects, especially neural tube defects. Furthermore, folate supplementation during pregnancy is of little use because it must begin very early in pregnancy to be effective. Hence, a nutrition education programme to improve the folate intakes of women of child-bearing age, or a supplementation programme for women planning a pregnancy, are options that should be considered.
Table 3.17 Selected median nutrient intakes, by age and sex
| Nutrient | Median intake by age group (years) | Total sample | |||||||||
| Men | Women | ||||||||||
| < 30 | 30-49 | 50-64 | > 64 | All ages | < 30 | 30-49 | 50-64 | > 64 | All ages | ||
| Number* | 118 | 263 | 161 | 149 | 711 | 125 | 362 | 199 | 203 | 889 | 1 600 |
| Energy (kcal) | 2 408 | 2 262 | 2 002 | 2 026 | 2 136 | 1 772 | 1 709 | 1 698 | 1 720 | 1 715 | 1 896 |
| Protein (g) | 84.4 | 87.3 | 85.5 | 84.8 | 85.1 | 63.1 | 71.1 | 69.5 | 71.5 | 68.6 | 76.3 |
| Fat (g) | 64.6 | 61.1 | 49.3 | 51.0 | 55.5 | 46.9 | 47.4 | 49.7 | 42.3 | 46.6 | 50.6 |
| Carbohydrate (g) | 335 | 306 | 277 | 270 | 291 | 269 | 229 | 245 | 247 | 244 | 262 |
| Calcium (mg) | 550 | 528 | 507 | 575 | 542 | 415 | 442 | 427 | 505 | 447 | 487 |
| Iron (mg) | 16.5 | 15.0 | 14.5 | 14.9 | 15.0 | 12.0 | 12.4 | 11.9 | 12.3 | 12.3 | 13.3 |
| Zinc (mg) | 8.0 | 7.7 | 6.5 | 7.2 | 7.3 | 5.8 | 6.2 | 5.4 | 6.1 | 5.9 | 6.5 |
| Vitamin A (RE) | 721 | 689 | 1 000 | 963 | 810 | 499 | 669 | 760 | 729 | 669 | 712 |
| Thiamin (mg) | 1.52 | 1.67 | 1.52 | 1.53 | 1.59 | 1.34 | 1.20 | 1.28 | 1.27 | 1.23 | 1.38 |
| Riboflavin (mg) | 1.25 | 1.33 | 1.32 | 1.54 | 1.35 | 0.96 | 1.05 | 1.14 | 1.20 | 1.08 | 1.19 |
| Niacin (mg) | 21.2 | 23.4 | 22.3 | 23.2 | 22.6 | 17.7 | 18.8 | 17.7 | 18.0 | 18.0 | 19.8 |
| Folate (µg) | 191 | 227 | 191 | 208 | 296 | 134 | 169 | 189 | 196 | 172 | 189 |
| Vitamin C (mg) | 91.7 | 103.5 | 57.4 | 74.8 | 82.3 | 92.9 | 75.3 | 62.1 | 70.1 | 72.1 | 76.2 |
* Figures on this line refer to number of respondents in that age and sex category.
It is interesting to compare the results of this survey with those of other surveys. Unfortunately, no recent national data are available for either Barbados or other English-speaking Caribbean countries, so comparison data from two United Kingdom surveys (HMSO, 1990 and 1998) has been used instead. The comparison of respondents aged 18 to 64 years is presented in Table 3.19, while that of older respondents is discussed in the section on Older people in Chapter 4.
Table 3.18 Selected nutrient intakes as percentages of Caribbean RDAs, by age and sex
| Nutrient | Median percentage of RDA by age group (years) | Total sample | |||||||||
| Men | Women | ||||||||||
| < 30 | 30-49 | 50-64 | > 64 | All ages | < 30 | 30-49 | 50-64 | > 64 | All ages | ||
| Number* | 118 | 263 | 161 | 149 | 711 | 125 | 362 | 199 | 203 | 889 | 1 600 |
| Energy | 81 | 79 | 72 | 88 | 80 | 81 | 79 | 83 | 94 | 83 | 82 |
| Protein | 159 | 165 | 161 | 160 | 161 | 140 | 157 | 154 | 159 | 152 | 158 |
| Calcium | 75 | 75 | 72 | 82 | 77 | 57 | 63 | 61 | 72 | 64 | 69 |
| Iron | 161 | 150 | 145 | 149 | 149 | 78 | 82 | 93 | 123 | 91 | 114 |
| Zinc | 54 | 51 | 43 | 48 | 49 | 48 | 51 | 45 | 51 | 49 | 49 |
| Vitamin A | 113 | 106 | 154 | 148 | 125 | 87 | 120 | 136 | 130 | 119 | 121 |
| Thiamin | 127 | 152 | 145 | 170 | 152 | 149 | 130 | 147 | 181 | 148 | 149 |
| Riboflavin | 96 | 102 | 102 | 118 | 104 | 83 | 95 | 104 | 109 | 97 | 101 |
| Niacin | 109 | 123 | 126 | 155 | 127 | 117 | 125 | 125 | 150 | 127 | 127 |
| Folate | 96 | 113 | 96 | 104 | 103 | 67 | 83 | 94 | 98 | 85 | 94 |
| Vitamin C | 153 | 172 | 96 | 125 | 137 | 147 | 125 | 104 | 117 | 119 | 127 |
* Figures on this line refer to number of respondents in that age and sex category.
Table 3.19 Comparison of Barbados and United Kingdom median intakes, by sex
| Nutrients | Men | Women | ||
| Barbados | UK | Barbados | UK | |
| 18-64 | 16-64 | 18-64 | 16-64 | |
| Energy (kcal) | 2 166 | 2 440 | 1 710 | 1 690 |
| Protein (g) | 85.4 | 84.0 | 68.3 | 61.8 |
| Carbohydrate (g) | 296 | 268 | 244 | 192 |
| Fats (g) | 56.2 | 101.8 | 48.0 | 73.3 |
| Calcium (mg) | 528 | 917 | 428 | 716 |
| Iron (mg) | 15.1 | 13.7 | 12.3 | 9.8 |
| Zinc (mg) | 7.3 | 10.9 | 5.9 | 8.2 |
| Vitamin A (RE) | 758 | 1012 | 667 | 810 |
| Thiamin (mg) | 1.61 | 1.65 | 1.23 | 1.22 |
| Riboflavin (mg) | 1.31 | 2.0 | 1.05 | 1.5 |
| Niacin (mg) | 22.5 | 39.2 | 18.0 | 28.1 |
| Folate (µg) | 205 | 300 | 168 | 208 |
| Vitamin C (mg) | 83.9 | 57.6 | 72.3 | 52.6 |
Table 3.19 shows that median energy intakes are fairly similar in the two surveys, although there are greater differences between the male populations. Regarding the intakes of nutrients, however, there are two striking differences:
On the positive side, fat intakes are substantially lower in Barbados than in the United Kingdom. Every effort should be made to maintain this healthy practice. Table 3.17 indicates that men below the age of 50 consume more fat than those over the age of 50; this may suggest a trend towards higher fat consumption. The relative contributions of the macronutrients (protein, fats and carbohydrates) to total energy intake are discussed further in the following section.
On the negative side, with the exception of iron and vitamin C, the Barbadian diet falls far below the United Kingdom diet for all micronutrients (vitamins and minerals). This probably reflects a relative lack of diversity and a lower consumption of fresh fruits[12] and vegetables, as well as fortified foods (especially breakfast cereals).
CONTRIBUTIONS OF ENERGY INTAKES FROM PROTEIN, FATS AND CARBOHYDRATES
Table 3.20 shows the percentage contributions made by the three macronutrients - protein, fat and carbohydrate - to dietary energy. High fat intakes, in both absolute terms and relative to the other macronutrients in their contribution to dietary energy intake, are strongly associated with many chronic disorders. Current WHO guidelines propose that a maximum of 30 percent of energy should come from fat. The United Kingdom recommends a maximum of 33 to 35 percent. At 24.5 percent for men and 25.0 percent for women, Barbadians fall well below both of these recommendations, but well above the recommended maximum for the Caribbean (15 to 20 percent). As with total fat intake, Table 3.20 shows that the proportion of energy from fat is higher in the younger age groups (< 30 and 30 to 49 years), suggesting an emerging trend towards higher-fat diets. This, combined with Barbados' high levels of chronic disease and obesity, and the use of fast-food outlets (which is especially high in the younger population - see Table 3.15), indicates serious cause for concern.
Table 3.20 Median percentages of energy intakes from macronutrients, by age and sex
| Age group (years) | Median percentage of energy intake from macronutrient | |||||
| Men | Women | |||||
| Protein Fat Carbohydrate | Protein | Fat | Carbohydrate | |||
| < 30 | 14.6 | 24.9 | 58.1 | 15.1 | 24.4 | 61.1 |
| 30-49 | 16.6 | 25.1 | 57.5 | 16.4 | 26.5 | 57.2 |
| 50-64 | 17.0 | 23.2 | 58.5 | 16.4 | 24.5 | 58.0 |
| > 64 | 16.6 | 24.2 | 58.8 | 16.2 | 23.4 | 59.3 |
| Total | 16.4 | 24.5 | 58.2 | 16.2 | 25.0 | 59.3 |
Table 3.21 shows that despite a low mean percentage of energy from fat (25 percent, see Table 3.20), at least relative to the United Kingdom (< 65 years: 38.7 percent; ³ 65 years: 36. percent) and by WHO standards, 31 percent of Barbadian men and women consume high-fat diets, in which fat contributes more than 30 percent of the energy (the WHO recommended maximum).
Table 3.21 Percentages of men and women with low, medium and high* contributions of macronutrients to calories
| | Low | Medium | High |
| Men | |||
| Protein | 10.7 | 31.8 | 57.5 |
| Fat | 22.6 | 46.1 | 31.2 |
| Carbohydrate | 38.1 | 49.1 | 12.8 |
| Women | |||
| Protein | 9.6 | 34.8 | 55.7 |
| Fat | 19.3 | 49.4 | 31.3 |
| Carbohydrate | 36.3 | 53.5 | 10.1 |
* Low, medium and high are defined as follows:
| % of calories from: | Low | Medium | High |
| Protein | < 10% | 10-15% | > 15% |
| Fat | < 15% | 15-30% | > 30% |
| Carbohydrate | < 55% | 55-75% | > 75% |
Table 3.22 Percentages of men and women consuming less than 90 percent of RDA for each nutrient (using actual and corrected values)*
| Nutrient | Men | Women | ||
| Actual | Corrected | Actual | Corrected | |
| Energy | 60.3 | - | 56.1 | - |
| Protein | 18.6 | 4.1 | 20.1 | 3.1 |
| Calcium | 59.4 | 44.3 | 70.4 | 61.3 |
| Iron | 19.3 | 3.0 | 49.6 | 28.8 |
| Zinc | 80.6 | 74.7 | 79.0 | 76.4 |
| Vitamin A | 44.4 | 36.7 | 43.3 | 37.0 |
| Thiamin | 21.8 | 6.6 | 23.5 | 9.6 |
| Riboflavin | 42.1 | 15.5 | 44.7 | 20.6 |
| Niacin | 33.3 | 10.4 | 30.8 | 11.0 |
| Folate | 42.9 | 30.7 | 52.3 | 43.8 |
| Vitamin C | 39.8 | 32.2 | 41.5 | 38.5 |
* Corrected for energy intake.
Analysing by age, 36 percent of men under 50 years of age are high fat consumers (fat contributes > 30 percent of total energy), compared with 24.5 percent of men aged over 50 years. This is a significant difference.
The trend is similar in women (34.3 percent of under-50s and 27.6 percent of over-50s), but the difference is not statistically significant. These findings support the concern that younger Barbadians are consuming increasingly high-fat diets.
MICRONUTRIENT ADEQUACY
Inadequate intakes of some micronutrients (especially the antioxidants) have been linked to a number of chronic diseases, including cancers and coronary heart disease. There are also indications that higher than normal intakes of some micronutrients may delay the onset of AIDS in HIV-positive individuals.
Intakes of many micronutrients are closely related to energy intakes. Thus, a high energy consumer is more likely to achieve adequate intakes of a range of micronutrients. Energy intakes fluctuate substantially from day to day, and one-day 24-hour recalls cannot capture these fluctuations.
Table 3.23 Mean micronutrient adequacy scores (as percentages), by age and sex
| Age group | Mean (SD) score | |
| Men | Women | |
| < 30 years | 74.9 (18.7) | 65.1 (20.9) |
| 30-49 years | 77.7 (17.6) | 69.1 (21.2) |
| 50-64 years | 77.0 (16.2) | 72.0 (19.0) |
| > 64 years | 74.2 (17.3) | 69.5 (19.9) |
| All ages | 76.4 (17.3) | 69.3 (20.4) |
In order to get a better idea of the micronutrient adequacy of the Barbadian diet, micronutrient intakes were corrected for energy intakes so as to answer the question: If an individual is consuming his/her energy requirement, is the range of foods consumed such that micronutrient requirements are also met? Table 3.22 shows the proportions of men and women who fail to achieve micronutrient adequacy (using 90 percent of the RDA as the cut-off) once energy requirements are met. These figures are compared with micronutrient adequacy as obtained from the 24-hour recalls.
Table 3.22 highlights a finding that has important policy and programme implications: even after correcting for energy intake, substantial proportions of men and women still have inadequate intakes of a range of micronutrients. In other words, what is needed is not more or less of the same diet, but a more diverse diet, with foods that contribute significantly to the intakes of certain vitamins and minerals, but not of fat. These foods include fruits and vegetables and low-fat dairy products.
Researchers have developed dietary scores of various kinds in order to examine aspects of dietary adequacy. This report presents two such scores: a micronutrient adequacy score and a dietary diversity score. Table 3.23 gives the mean micronutrient adequacy scores by age and sex. The micronutrient adequacy score[13] was devised as follows:
The percentage adequacy for each micronutrient was scored as 0 if less than 70 percent, 1 if between 70 and 90 percent, and 2 if greater than 90 percent.
The scores for the micronutrients were then summed and expressed as a percentage.
Analysis of the micronutrient adequacy scores indicated the following:
Only two respondents had a micronutrient adequacy score of 0 (i.e. less than 70 percent of RDA for all vitamins and minerals).
83 respondents (5.2 percent of the total) scored 100 percent (i.e. more than 90 percent of RDA for all vitamins and minerals).
Women had significantly lower micronutrient adequacy scores than men.
Women's micronutrient adequacy scores differed significantly by age, with the lowest mean score found in the youngest age group (< 30 years) and the highest in the 50 to 64 years age group. There were no differences by age in the men's scores.
The section on Determinants of micronutrient inadequacy in Chapter 4 presents the results of a multiple regression analysis to identify the significant determinants of micronutrient adequacy.
DIETARY DIVERSITY
A semi-quantified food frequency questionnaire covering 84 foods was used to examine dietary diversity. The questionnaire asked whether the foods were consumed daily, weekly, monthly or not at all. The results were then quantified using numbers of measuring units consumed. The full results of the questionnaire, expressed simply as frequency of consumption of each food, are given in Annex II. The semi-quantification aspect of the questionnaire was used to identify the six main food sources of nutrients in the Barbadian diet (Table 3.24). This was based on the mean for the total sample (consumers and non-consumers of each food).
A slightly different list of food sources is obtained if the mean is based on consumers alone. These results are provided in Annex III. If a food is consumed by few respondents, even if it is an excellent source of a nutrient, it will be so for those consumers only. Annex III reflects the best food sources for each nutrient in the Barbadian food supply, rather than in the actual Barbadian diet. The findings of Annex III are useful for nutrition education programmes aimed at encouraging (or discouraging, in the case of a high-fat food, for example) the consumption of a food that is a particularly rich source of a nutrient, but that is consumed by few people.
As a first step to examining dietary diversity, the foods covered by the frequency questionnaire were classified into nine groups (as shown in Annex II). Scores were assigned to each food as follows:
0 if never consumed;
1 if consumed monthly;
2 if consumed weekly;
3 if consumed daily.
Table 3.24 Best food sources of nutrients in the Barbadian diet*
| Energy | Protein | Carbohydrates |
| Fresh meat | Poultry | Carbonated beverages |
| Fats | Saturated fats** | Cholesterol** |
| Fresh meat | Fresh meat | Eggs |
| Calcium | Zinc** | Iron*** |
| Evaporated milk | Fresh meat | Fresh beans/peas |
| Vitamin A | Vitamin C | Folate |
| Sweet potatoes | Citrus juice | Dried peas |
| Thiamin | Niacin | Riboflavin |
| Fresh meat | Poultry | Evaporated milk |
* Where more than six foods are listed, the last two or three foods emerged as equally good sources.
** The food composition tables lack information on these nutrients for many foods.
*** This list takes no account of iron absorption, which is far higher from animal foods than from vegetable foods. The seventh and eighth items are fresh meat and poultry; taking absorption into account, these would probably emerge as the best sources of iron in the Barbadian diet. Absorption of haem iron from animal sources is 20 to 30 percent, compared with 2 to 5 percent absorption from legumes (other than soybeans).
Table 3.25 Men's mean food group scores, by age
| Food group | Mean (SD) scores | ||||
| < 30 | 30-49 | 49-64 | > 64 | All ages | |
| Cereals | 12.2 | 11.0 | 10.6 | 10.6 | 11.0 |
| Starchy roots, tubers, fruits | 9.2 | 10.6 | 11.3 | 11.0 | 10.6 |
| Legumes, nuts, seeds | 14.2 | 13.8 | 13.1 | 11.5 | 13.2 |
| Meat, poultry, fish, eggs | 9.3 | 10.7 | 10.5 | 10.8 | 10.4 |
| Dairy products | 6.0 | 5.9 | 5.4 | 5.6 | 5.7 |
| Vegetables | 16.9 | 19.0 | 19.5 | 19.3 | 18.9 |
| Fruits | 12.1 | 11.5 | 11.6 | 9.5 | 11.2 |
| Fats and oils | 8.3 | 8.0 | 7.7 | 8.3 | 8.1 |
| Sugars, sodas, alcohol | 8.6 | 7.6 | 7.0 | 6.9 | 7.5 |
Table 3.26 Women's mean food group scores, by age
| Food group | Mean (SD) scores | ||||
| < 30 | 30-49 | 49-64 | > 64 | All ages | |
| Cereals | 12.0 | 11.4 | 11.0 | 10.8 | 11.3 |
| Starchy roots, tubers, fruits | 8.9 | 9.9 | 11.1 | 11.3 | 10.4 |
| Legumes, nuts, seeds | 12.2 | 13.2 | 12.1 | 10.4 | 12.2 |
| Meat, poultry, fish, eggs | 9.4 | 10.3 | 10.7 | 10.1 | 10.2 |
| Dairy products | 5.6 | 5.8 | 5.3 | 5.4 | 5.6 |
| Vegetables | 17.6 | 19.4 | 20.2 | 19.4 | 19.3 |
| Fruits | 12.0 | 11.9 | 11.6 | 10.1 | 11.4 |
| Fats and oils | 7.8 | 7.8 | 8.3 | 7.8 | 7.9 |
| Sugars, sodas, alcohol | 7.5 | 6.8 | 5.7 | 5.6 | 6.4 |
In order to allow for comparison across food groups, individual food scores within each group were then summed, divided by the number of food items in that group, and multiplied by ten. These food group scores thus represent scores out of a total possible maximum of 30, i.e. if each food item within a food group was consumed daily, the score assigned for that food group would be 30. Tables 3.25 and 3.26 shows food group scores by age and sex. Analysis by age and sex revealed the following:
Among both men and women, significant differences across the age groups were found in the food group scores for cereals; starchy roots, tubers and fruits; legumes, nuts and seeds; meat, poultry, fish and eggs; vegetables; fruits; sugars, sodas and alcohol.
Individuals consuming higher-fat diets were more likely to consume fewer fruits and starchy roots, tubers and fruits.
Men achieved significantly higher scores in two food groups - legumes, nuts and seeds; and sugars, sodas and alcohol.
Women scored significantly higher than men in one food group only - vegetables.
Table 3.27 Mean dietary diversity scores (as percentages), by age and sex
| Age group | Mean (SD) percentage diversity scores | ||
| Men | Women | Both sexes | |
| < 30 years | 35.8 (8.4) | 34.5 (8.4) | 35.2 (8.4) |
| 30-49 years | 36.3 (7.4) | 35.7 (7.5) | 36.0 (7.4) |
| 50-64 years | 35.8 (7.9) | 35.5 (7.2) | 35.7 (7.5) |
| > 64 years | 34.6 (7.8) | 33.7 (8.1) | 34.1 (8.0) |
| All ages | 35.8 (7.8) | 35.1 (7.7) | 35.4 (7.8) |
A diet that is diverse is more likely to be well balanced and to achieve adequacy across the full range of nutrients. To assess the diversity of the Barbadian diet, a dietary diversity score based on the data from the food frequency questionnaire was developed. To calculate the score,[14] the food group scores were summed and expressed as percentages. Table 3.27 presents the dietary diversity scores by age group and sex.
Analysis of the diversity scores revealed the following:
Men's diversity scores ranged from 11.7 to 60.5 percent. Women's from 4.6 to 63 percent.
Men's mean diversity score was not significantly higher than women's.
Among women, the oldest age group (> 64 years) achieved a significantly lower mean score than did two other age groups (30 to 49 years and 50 to 64 years). Among men, although the oldest age group also showed the poorest diversity, the differences were not significant. Dietary issues of older Barbadians are discussed in the section on Older people in Chapter 4.
Although the mean scores of older people are lower than those of other age groups, on the whole there is considerable homogeneity in scores across the age groups.
Strong positive correlations were found between the diversity scores on the one hand and the protein intakes and micronutrient adequacy scores on the other. As diversity increased, so did protein intakes and micronutrient adequacy.
In the Barbadian context there is therefore a clear need to improve diversity selectively, so as to improve intakes of micronutrients while limiting or reducing intakes of fats and carbohydrates[15] (and hence energy), through the inclusion of foods that are rich in micronutrients but not in energy.
Socio-economic and other factors affecting both dietary diversity and micronutrient adequacy are analysed further using multiple regression in Chapter 4.
| [6] 1 square foot = approximately 0.09 m2. [7] Note that the scales on the y-axes of Figures 2 and 3 are very different from each other. [8] Because different indicators of obesity were used, the figures are not directly comparable (see section on Healthy lifestyles in Chapter 5). [9] It is necessary to know an individual’s age when assessing his or her RDA, and hence the percentage of RDA represented by his/her nutrient intake. [10] These are standard limitations of the 24-hour recall method of dietary assessment, and are discussed in the section on Recommendations for future surveys: difficulties encountered and limitations of the survey in Chapter 2. [11] This is also discussed in the same section in Chapter 2. [12] The relatively high intake of vitamin C in Barbados can be explained by the high vitamin C content of some tropical fruits that are frequently consumed as juices: the West Indian (or Barbadian) cherry, guava. [13] A number of ways of calculating an adequacy score were attempted. The one described was found to have the best distribution and internal validity. See also footnote 18. [14] As with the micronutrient adequacy score, a number of methods of calculating the dietary diversity score were attempted. The one described here produced a score with near-perfect normal distribution. It assigns equal weight to each food group, and to each food within each food group. Arguably, a score assigning equal weight to each food item (by simply summing all individual food scores) is preferable. However, such a score was found to be less well distributed. Neither score assigns any weight on the basis of the nutritional value of the foods. Neither the micronutrient adequacy score nor the dietary diversity score has been validated. However, a measure of internal validity is demonstrated in this report by the results of analyses that relate the scores to other variables. [15] Reduction of carbohydrate consumption should be selective: sugars should be reduced, but not wholegrain flour or its products, nor starchy roots and tubers. |
![]()
![]()
![]()