We contend that the sector can have a particularly important role to play in the national development process on two counts. First, when it either contributes - or could potentially contribute - to underlying growth processes in a substantive manner (what we choose to term "the growth basis for fisheries insertion into national development processes"). The exponential growth in the exploitation of anchovy stocks off Peru from the late 1950s onwards, for example, saw the sector accorded a central role in 1971-76 National Development Plan (Ibarra, Reid and Thorpe, 2000:510). Equally, a belated recognition of the value of squid stocks off the Falkland Islands has converted an ailing colonial outpost into a relatively prosperous fishing-fuelled domain since the late 1980s, with a licensing regime depositing some £ 27.5 million annually into the island's coffers (Economist, 30/3/2002; World Fishing, 2001). Second, in those instances where a substantial number and/or substantive percentage of a countries fisheries-dependent population are enmeshed in poverty (what we choose to term "the equity basis for fisheries insertion into national development processes"). The STREAM initiative (2000:23), for example, suggests that 88 percent of the very low income households encountered in Tay Ninh province in Viet Nam in 1999 were linked to the fisheries sector (whereas only 44 percent of high income households were similarly linked). Conversely, however, Mkenda (2000:10) suggests that, in Zanzibar at least, fishing households are not the "poorest of the poor" - with "only" 43 percent of such households falling below an expenditure-based poverty line, in contrast to 60 percent of subsistence and cash-cropping peasants. Kotikula (2003) reaches similar conclusions regarding Thailand; finding the poverty rate (at 9.8 percent) within fishing communities to be two and a half times less than in the rural north-east. Examining each of these rationales for insertion in more detail;
3.1 The "Growth Basis" for fisheries insertion into national development processes
"In terms of policy challenges, strong growth was recognized as key to poverty reduction (IMF/World Bank, 2002:9)".
National development strategies across the world are - and have always been - predicated on the basis that adoption of the proposed strategies will have a positive impact on the economic growth rate and thereby contribute to a sustained elevation in the aggregate welfare of domestic citizens (See Box 3).
There would appear, however, to be no unique growth blue print, with extensive empirical research identifying a substantial number of factors which have been found to be partially correlated to economic growth rates (Sala-I-Martin, 1997:178; Easterly, 2001). These factors include; foreign aid (Burnside and Dollar, 1997), openness to trade (Sachs and Warner, 1995) and capital flows (Rappaport, 2000), school enrolment rates (Barro, 1991), population growth rates (Solow, 1956), technological innovation (Scherer, 1999), democracy (Barro, 1996) and property rights (de Soto, 2001; Goldsmith, 1995), social capital (Helliwell and Puttnam, 1995), and corruption (Mauro, 1995). For this reason, as we have already noted, the contents of contemporary PRSPs differ markedly, reflecting local realities.
Nevertheless, a central component of the neo-liberal development strategy espoused by the main multilateral institutions during the 1980s and early 1990s, and one which has carried over into many of the poverty reduction strategies of the early years of the twenty-first century, was an emphasis on export-led growth. Drawing its inspiration from neo-classical trade theory (Corden, 1993; Krueger, 1982), the new development paradigm argued for exchange rate and trade regime liberalization (tariff and export subsidy reductions), with unambiguous welfare gains expected as resources were allocated more efficiently. As exports and imports adjusted to reflect international comparative advantage, developed and developing countries alike had the opportunity to harness trade as "an engine of growth".
|
Box 3 "With many roots and multidimensional characteristics, all routes matter for the poverty reduction strategy... The first set of policies would accelerate and expand the scope for pro-poor economic growth... (Bangladesh: A National Strategy for Economic Growth, Poverty Reduction and Social Development, March 2003, p.8)." "Given the still-lagging state of our economy, substantial increases in incomes, in the sense of purchasing power, will be essential to permit our citizens to realize their talents and aspirations. For that reason, promotion of economic growth has to play a central role in the Strategy (Guyana: National Development Strategy 1997-2007, Chap.2.p.1)." "In our development strategy... agriculture would be given priority. In the context of that strategy, our main concern is to ensure that the peasantry shall be the first to benefit... (Partido Africano da Independencia da Guine e Cabo Verde (PAIGC), 1977:25)." "In the period 2001-7, we shall establish the basis for a productive model capable of generating sustainable growth, promoting the diversification of production and achieving international competitiveness in the context of macroeconomic stability (Venezuela: Plan de Desarrollo Económico y Social de la Nación 2001-2007, p.16)." "The people of East Timor have many expectations, but these focus strongly on two over-riding development goals; ...(b) to promote economic growth that is equitable and sustainable... (East Timor: First National Development Plan, 2002, p.1)." "The restoration of economic growth is a fundamental factor for resolving the problems of employment and poverty (Colombia: Plan Nacional de Desarrollo 2002-06: Hacia Un Estado Comunitario, Chap.2. p.71)." |
Capital scarcity within much of the developing world however ensured that just two principal developmental paths existed - a physical (natural) resource, and a human resource-based path - though the two are not mutually exclusive. China is a good exemplar of the latter. It has successfully used its immense pool of low-cost labour to make increasing inroads into the labour-intensive, manufacturing sphere of global trade, much to the consternation of other East Asian economies who had previously dominated the market sector (The Economist, 17/3/2001). Chile elected to follow the alternative route; natural resource exports (copper, agriculture, forestry and fish products) and processed derivatives thereof dominating a dynamic export portfolio that accounted for over 40 percent of growth in GNP between 1990 and 2000 (UNDP, 2001).
For those countries not fortunate to count upon depletable natural resources in the shape of copper, oil, natural gas, diamonds and the like, agricultural exports have been the cornerstone of neo-liberal trade promotion strategies (Thrupp, Bergeron and Waters, 1995; Quiroz, 2000; Wobst, 2001; Takane, 2002). The importance of agriculture to the growth process is not limited to its capability to enhance export earnings however, especially given its key contribution to domestic employment and consumption in many developing countries. As FAO (2002:29) note; "all PRSPs recognize the important role that agriculture and rural development can play in terms of broad based economic growth." This is reflected in international donor support, most notably with regard to USAID, which has doubled funding extended under its Economic Growth, Agriculture and Trade (EGAT) pillar in Latin America[13], and launched a Cut Hunger in Africa initiative in 2003 - along with a commensurate 25 percent increase in programme funding - following the realization that the agricultural sector is "the most cost-effective engine of growth" for the continent (USAID, 2003:3).
Other renewable resource sectors (forestry and fisheries) have generally been accorded much less attention than agriculture in either national development strategies or donor support programmes as their respective contributions to export earnings, domestic employment and domestic consumption are relatively smaller - albeit with some exceptions. In Latvia, for example, the forestry sector accounts for 10-15 percent of GDP and 4.3 percent of total employment, whilst 12 percent of Icelandic GDP and around 70 percent of export earnings is derived from fisheries (Tikkanen et al., 2002:36; FCO, 2003). While the fisheries sector may not be the principal motor of growth in many countries it can, nevertheless, still play an important ancillary role in enhancing growth rates over time through;
(i) The exploitation of underexploited marine and inland stocks, although this avenue has been progressively closed over time.
(ii) The initiation and/or continued development of aquaculture and mariculture activities, the two fastest growing food export activities in the world in value terms (IFPRI, 1997).
(iii) Improvements in value-added within the sector. This could be through the provision of new infrastructure (landing facilities, processing, curing and canning installations) in order to reduce domestic wastage rates, and/or strategies designed to exploit opportunities in the more profitable export market. In Senegal, for example, the Stradex programme proposes to develop new seafood export products, to improve the quality of existing ones, to create new types of ready-to-use products for export markets, and to introduce quality labels and, by so reinforcing Senegal's export market position, augment the sector's earnings (Agro-Ind, 2002).
(iv) Integrating the sector more closely - where warranted - into tourism and coastal-zone management programmes so as to derive benefits through eco-tourism and marine park initiatives, sport fishing and the like (FAO, 1996:10).
While this importance can be measured in a number of ways (sectoral contribution to GDP, generation of resource rents, net or gross export earnings, licence fee receipts, inward investment into the sector, the role of fisheries in contributing to food security etc.) this paper selects two criteria for illustrating the current significance of the sector in growth terms. First, given the scarce capital and foreign-exchange constraints encountered by many developing countries, we highlight the standing of the sector as a generator of foreign exchange[14], arguing that the larger is its contribution, the more likely is - or the greater the opportunities are for - its insertion into national policy formulation processes. Although gross export earnings affords no great insights into the resource rent generating - and hence efficiency - capacity of a particular national fishery, it does provide both a (rough) indicator of the sector's capital accumulating capacity and a proxy for the presence of an important pressure group who can lobby for greater inclusion of sectoral interests in national policy documents. Equally, we wish to stress that using exports to provide a snapshot illustrating the current significance of the sector from a developmental perspective should not be construed as providing any justification for the adoption of policy measures designed to further expand exports[15].
Second, given that the sector plays a crucial role in underpinning nutritional standards and/or food security in many countries - providing 15-16 percent of global animal protein intake (FAO, 2003:5)- we also highlight national reliance upon the sector for provision of animal protein needs. The greater the reliance upon fish protein, the greater the likelihood that national development strategies will reflect this[16], embracing policies designed to either safeguard this protein source[17] and/or reduce dependence thereon - either way such a dependence affords opportunities for influencing the policy-making process.
Growth is not necessarily an end in itself however but, as the increasing distributional re-orientation of national development strategies in recent years shows, can also impact upon poverty. Although there is widespread recognition that growth can be beneficial to the poor, there is marked disagreement as to the extent to which such benefits "trickle-down" (Sharma, 1997; Foster and Székely, 2001; Norton 2002). While Dollar and Kraay (2001) have uncovered a unitary growth elasticity - a one percent increase in growth translates into an equivalent increase in income - for the bottom quintile of the income distribution, scepticism over the extent of "trickle-down" has led to demands for pro-poor growth (see Stiglitz, 2002; and cited Bangladeshi strategy in Box 3 for example). FAO (2000:5) note, for example, that in the fisheries context there is only some "anecdotal evidence" suggesting national economic growth trickles down to fishing communities. Indeed, it is quite possible that fisheries induced growth, as in the case of the factory/freezer vessel driven expansion of the Argentine hake fishery during the 1990s, delivers limited benefits to local (artisanal) fishing communities (Thorpe, Ibarra and Reid, 2000:1689). This form of exclusionary growth is not overly contentious in instances where excluded local fishing communities are relatively wealthy. It is, however, when such artisanal fishing communities are relatively impoverished - and can lead to demands for a more pro-poor fisheries growth. A case in point is Chile, where CONAPACH have argued that quota allocations in the country's main pelagic and demersal fisheries should primarily accommodate the social and cultural considerations of the artisanal fishing community, rather than be driven by an analysis of historic catch by sector (2002:16). The issue of poverty within fisheries communities can also provide an equally compelling reason as to why the sector should be accorded a higher profile in the national development process.
3.2 The "Equity Basis" for fisheries insertion into national development processes
Poverty, or rather, poverty reduction strategies, are increasingly being accorded a centrality in the development planning process as we have indicated above (Section 2). This growing preoccupation with poverty has also been matched by a greater diagnostic emphasis on the extent, nature and location of pockets of poverty. The Benin PRSP 2003-5, for example, uses a series of household surveys to show that while the extent of monetary poverty; (i) fell in urban areas from 28.5 percent to 23.3 percent between 1996 and 1999, it rose in rural areas from 25.2 percent to 33 percent (1994/5 to 1999/2000), (ii) is highest in the northern rural departments of Borgou, Alibori, Atacora and Donga, urban pockets of poverty are to be found in the departments of Couffo, Atacora, and Ouémé, and (iii) is more severe for those women who are poor, more males are poor in absolute terms (PRSP-Benin, 2002:12ff). The document, as do most PRSPs completed to date (FAO, 2002a:13), also recognizes the multidimensional nature of poverty, elaborating a non-monetary poverty index based on five social indicators[18]. The ensuing computations suggested that the incidence of non-monetary poverty climbed from 43.4 percent to 49 percent between 1996 and 2001, whilst corroborating that Atacora was indeed the poorest department in both monetary and non-monetary terms.
This expanded poverty definition has been paralleled by an appreciation that as poverty may have multiple causes and determinants (fourteen were identified in the Benin case, ranging from inadequate employment programmes for the handicapped to the unavailability of micro-finance), there is a consequent likelihood that the survival or livelihood[19] strategies adopted by the vulnerable are likely to be equally diverse and/or complex. Morris (2002), for example, found that the monetary income of the poorest tercile of farmers in the semi-arid region of Shinyanga in Tanzania was derived from a combination of subsistence cropping of low return, drought resistant crops such as sorghum and millet (44 per of income), off-farm activities ranging from cotton harvesting to migration (37 percent), and asset adjustment in the form of livestock sales (16 percent). These responses are however, in large part, conditioned by ownership of - or access - to underlying resources, whether they be in the form of natural (such as land), physical (such as livestock), financial, or human resources. As Radoki (1999:322) puts it;
"The crucial determinants of households" ability to achieve increased well-being are their access to capital assets and the effects of external conditioning variables which constrain or enhance the productive use and accumulation of such assets."
Recognition that households have a range of different capital assets which are deployed to maintain and/or improve livelihoods has prompted the emergence of new analytic frameworks designed to enhance policy formulation in the poverty field. The capital assets framework identified by the World Bank (2000:34ff) and the Sustainable Livelihoods Approach (SLA) pioneered by Dfid-UK represent two such attempts to better understand - and redress - the determinants of poverty in all its dimensions, viewing the livelihood strategies adopted by the poor as consequent upon their access to a series of underlying assets/capitals (Box 4). For example, if a household suffers a loss in the income or subsistence stream derived from natural capital (harvest loss occasioned by, say, drought), this can be offset by one, or a combination of, increased human capital utilization (migration to seek temporary work, say), the disposal of physical assets (sale of livestock or household durables), the increased use of financial assets (running-down savings and/or increased borrowing), and falling back on social capital options (increased remittances from extended family members, social support networks, religious and political organizations etc.).
|
Box 4 Natural capital/assets - These encompass land, water and other environmental resources such as forests, fish stocks, and mineral deposits. Access will be determined by existing property and inheritance rights (both formal and informal) and the market opportunities to acquire/dispose of such rights (leasing, rental, terms of sale and purchase etc.). Human capital/assets - This refers to the quantity and quality of labour resources available to the individual/household, the precise level of which is determined by factors such ass educational level, innate skills and health status. Physical capital/assets - This includes infrastructure (roads, access to electricity and other utilities) and productive equipment, as well as the individual's/household's housing stock. Financial capital/assets - Alludes to the financial resources (whether in the form of savings, credit, remittances and pensions for example) available to the individual/household. Social capital/assets - Can be interpreted in terms of; " the rules, norms, reciprocity and trust embedded in social relations, social structures, and society's institutional arrangements, which enable its members to achieve their individual and community objectives (Narayan, 1997:50)." Specifically it refers to contact networks that can be activated as needs dictate as well as "political influence over resources (World Bank, 2000:34)." Source: Adapted from Thorpe (2002). |
These frameworks have increasingly informed the development of PRSPs and national poverty reduction strategies as well as donor programmes, with governments and external donors now seeking to advance policies which either; (i) increase access to capital assets, and/or (ii) address external conditioning variables so as minimize those which constrain, and/or further enhance those which are conducive to, increased well-being. In the Benin PRSP, for example, not only was provision made to increase women's access to land through the preparation of a gender-sensitive rural land code, but proposed improvements in the legal and regulatory framework governing micro-credit institutions was likely to sweep away a number of constraints that inhibited female access to credit (PRSP-Benin, 2002:70-3).
Such a multidimensional approach sits well with the fisheries sector in the developing world. Research has shown that fishing is often only one - generally seasonal - aspect within a complex and flexible livelihoods strategy matrix. As Bailey (1994) put it;
"It is a mistake to view fishing communities as made up exclusively of fishers or to view fishers only as fishers. They are also farmers, craftsmen, charcoal makers, and occupy a host of other occupations. This occupational multiplicity reduces a fishing household's vulnerability to loss associated with any one activity, and it tends to keep fishers off waters for significant portions of the year".
Salagrama's work (2000) supports Bailey's assertion, highlighting that while fishing is the principal occupation in the northern and southern zones of Andhra Pradesh in India, the activity is supplemented by a series of other options (wage labour in agriculture, selling forest produce, extraction of salt etc.). Equally, Béné et al. (2000) found that, on average, households on the Yaéré floodplain in Cameroon were involved in between 2.9 and 3.4 activities depending on wealth-status[20], while Payne (2000:4) notes that only 20-30 percent of the total catch on the Bangladeshi floodplains is taken by full-time fishers.
Yet while complex livelihood strategies - by themselves - are not redolent of poverty, the vulnerability of the poor makes them more likely to develop and, under certain circumstances, exploit all possible livelihood options. This is certainly the case in fishing-centric communities given the potential links between poverty and the resource base (see Figure 3.1). Inclusive, the Code of Conduct of Responsible Fisheries (CCRF) implicitly recognizes the latent vulnerability of the sector in arguing that members of small-scale fishing communities and artisanal fishers should receive special assistance and protection in order to derive a "secure and just livelihood (Art 6.18)." It also connects strongly to the principles espoused in the World Bank's 2000/1 World Development Report, and operationalized in many national poverty reduction strategies, of attacking poverty by promoting opportunity, developing capability, enhancing security, and facilitating empowerment.
Dimensions of poverty and links to the fisheries
sector
(adapted from Shyamsundar et al., 2001)
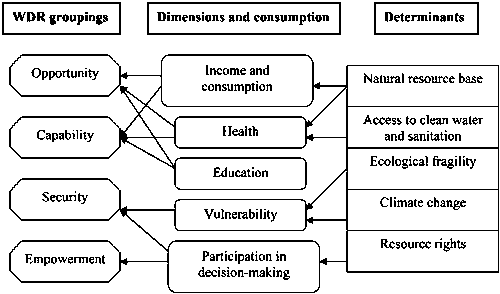
Figure 3.1
But in order for the sector to avail itself of the opportunities offered by the strengthened poverty focus encountered in contemporary NDPs and donor support programmes, concrete evidence substantiating the endemic nature of poverty within fishing communities must be provided. However, since Gordon (1954:132) noted a half-century ago, that;
"In point of fact, fishers typically earn less than most others, even in much less hazardous occupations or in those requiring less skill".
the poverty of fishers and fishing communities has been taken as given. Béné (2002) provides a useful synopsis of the literature linking poverty and fisheries, but the majority of the evidence - as Macfadyen and Corcoran (2002) have corroborated - is largely anecdotal. The few quantitative studies that do exist produce somewhat contradictory findings - while Mkenda's (2000) research, as we have noted earlier, suggests that artisanal fishers are better off than peasant farmers in rural Zanzibar, other studies such as STREAM (2000) and Béné et al. (2000:7) note that the poorest households in the chosen research regions are more likely to be dependent on fishery activity (even if the direction of causality is disputed)[21]. The literacy lacuna and the limited understanding of the underlying causal mechanisms linking poverty and fisheries has recently caused the FAO Advisory Committee on Fisheries Research (ACFR) to recommend further research into the area. Similarly, concern regarding such linkages has seen the application of poverty profiling techniques to fishing communities, thereby not only deriving powerful analytic tools for future sectoral poverty assessments, but also will help prioritize poverty reduction measures in such communities. In Sub-Saharan Africa the work of Pittaluga and the SFLP on the inland lakes of West Africa, is particularly notable in this regard - as is the work of Mori and Xuan in Viet Nam[22]. Such endeavours are complemented by a research project which seeks to over-sample fishing communities in the Living Standards Measurement Surveys (LSMS) currently being undertaken by the World Bank in Ghana and Sierra Leone so as to provide a comprehensive data set which aids in exposing such causal mechanisms. Unfortunately, the ongoing nature of such research dictates that we must look elsewhere in order to advance a present case for the sector's inclusion in national development programmes on the grounds that it harbours an above average relative quotient of the poor.
In consequence, this paper selects two criteria for proxying the significance of the sector in equity terms. First, given the absolute absence of fisheries-specific national poverty statistics, the following analysis uses levels of rural poverty as a second-best measure to reflect the likely magnitude of poverty in the fisheries sector. This analytic oversimplification can be exculpated perhaps on the grounds that the vast majority of fishers are to be encountered in rural, as opposed to urban, areas[23] and so aggregate rural poverty statistics are more likely to capture (albeit only partially) poverty within the sector[24]. The more profound the nature of rural poverty then, the more likely it is that poverty reduction strategies will be targeted upon the sector, thereby benefiting the fisheries sector either directly (specific interventions in the fisheries field) or indirectly (by, say, reducing the costs of accessing rural credit for productive purposes).
Second, if poverty is endemic within fisheries communities as anecdotal evidence has suggested, then the potential for poverty-reducing, fisheries-specific, policies grows in line with the numeric size of the sector. The more (poor) fishers there are, the greater the potential for mobilization - and the more difficult it is for policy-makers to ignore such voices in the participatory dialogues that are increasingly informing national development processes[25]. In fact, this measure may well understate the true importance of the sector, as there is evidence that for every person fishing there are a further three involved in processing, marketing or distribution activities. The greater the magnitude of rural poverty and the greater the number of fishers then, the greater the potential opportunities for inserting the fisheries sector into national development and poverty reduction strategies on equity grounds.
The relative importance of the fisheries sector in terms of either growth (as measured by its contribution to exports and/or the domestic consumption of animal protein) and/or equity (as measured by the level of rural poverty and/or the numeric size of the sector) considerations will vary from country to country. The following sub-section therefore uses such considerations to derive and apply a simplistic framework intended to identify those countries in which the prospects for fisheries insertion into national development programmes and poverty reduction strategies (on either growth or equity grounds) are greatest. The subsequent section (Section Four) then uses these findings to identify which countries are currently punching "above" or "below" their weight in this respect.
3.3 The importance of the fisheries sector in the developing world
This section examines the relative importance of growth and equity considerations vis-à-vis the fisheries sector from a regional perspective. Five regions are identified (Latin America, Africa - which is further sub-divided into countries with/without PRSPs, Asia, the transition economies, and small island developing states[26]). Growth considerations are examined using scatter-plots of the association between contributions to trade and consumption. The value of each country's fisheries exports as a proportion of the total value of agricultural exports (including fisheries commodities) during 2000 indicates the relative importance of the sector as a foreign exchange source (FAOSTAT). National reliance upon fisheries for domestic nutritional purposes is measured by taking average per capita fish protein consumption as a proportion of total daily animal protein, also at 2000 values (FAO: Food Balance Sheets).[27] To examine the equity issues, we plot the number of fishers as a proportion of the economically active population in 2000 against the rural poverty headcount index, which is unfortunately only available for about half the countries examined.[28] Annex 1 reports the data used for this exercise. The analysis begins by evaluating the full dataset.
All countries
Table 3.1 shows descriptive statistics for all countries included in the analysis
Table 3.1 Descriptive statistics: all countries
|
|
N |
Min |
Max |
Mean |
s.d. |
|
Fisheries exports as a percentage of agricultural exports |
127 |
0.0 |
99.8 |
18.5 |
24.9 |
|
Fish as a percentage of average daily protein consumption |
129 |
0.3 |
84.8 |
19.4 |
18.7 |
|
Fishers as a percentage of the economically active population |
129 |
0.0 |
22.0 |
1.3 |
2.6 |
|
Rural poverty headcount index |
63 |
4.6 |
86.5 |
44.3 |
19.8 |
These figures yield several stylized facts. Fisheries made an important contribution to trade, sometimes constituting almost the entire value of agricultural exports. However, forty-three countries ran trade deficits in fisheries commodities that year, including several countries in which fisheries were the principal component of exports. Fisheries commodities were the main source of protein in several countries and on average contributed about twenty percent of average daily animal protein consumed. Overall, fisheries employment constituted a small proportion of the total labour force throughout the sample, only exceeding ten percent in the case of two small states. In most instances, fisheries employ less than one percent of workers, although this may not necessarily reflect the sector's local or regional importance. Finally, it is evident that rural poverty was a major problem in those countries for which data is available: on average, nearly one in two persons subsisted below the poverty line.
All countries
Trade against consumption
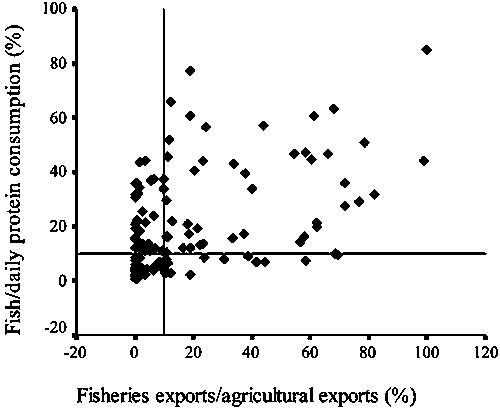
Figure 3.2
Figure 3.2 shows the relationship between the contribution of fisheries to trade and consumption in 127 countries. There is some evidence of a positive association between the two variables, but the diversity of fisheries production and distribution chains and the different cultural milieu in which fish is consumed suggest there is unlikely to be a simple relationship between trade and domestic consumption. Horizontal and vertical reference lines, set at ten percent of agricultural trade and ten percent of daily animal protein, divide the chart into four quadrants. We interpret Figure 1 and subsequent charts as follows. Countries in the Northeast quadrant (44 countries) saw the greatest contribution to export earnings and national diets. As a consequence, we would anticipate the fisheries sector being highly integrated into national development strategies in these countries. Conversely, fisheries were relatively unimportant to trade and diets for countries in the Southwest quadrant (41 cases). This does not necessarily mean that economic development and poverty reduction strategies in these countries should ignore the sector, as low domestic consumption levels, for example, could be a corollary of underdeveloped markets and infrastructure. Fisheries in countries in the Southeast (13 cases) and Northwest (29 cases) quadrants made a greater than (below) average contribution to export earnings, but contributed a lower (higher) share of consumption. Development strategies in these countries might contemplate the possibility of a trade-off between export earnings and domestic consumption.
All countries
Employment against rural poverty
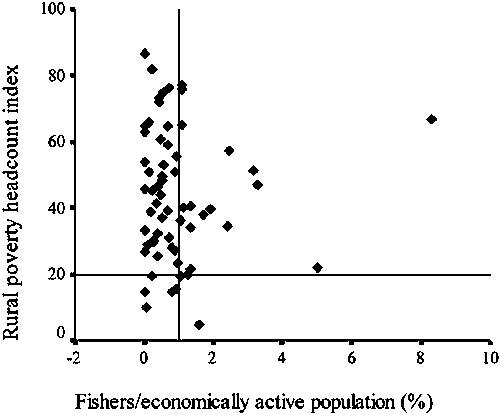
Figure 3.3
Figure 3.3 plots fisheries employment against the degree of rural poverty in sixty-three countries. Given the significant range of the figures for employment and rural poverty, reference lines are set at one percent and twenty percent respectively. It is evident that most countries were in the North West quadrant (39 cases), signifying high levels of rural poverty but a low sectoral employment rate. A minority were in the Southeast (2 cases) and Southwest (5 cases) quadrants, while some seventeen economies were located Northeast of the reference lines.
In light of the relationships between trade, consumption, employment, and rural poverty outlined above, we now turn to the analysis of individual country groups.
(i) Latin America
Table 3.2 summarizes the data on Latin American economies
Table 3. Descriptive Statistics: Latin America
|
|
N |
Min |
Max |
Mean |
s.d. |
|
Fisheries exports as a percentage of agricultural exports |
17 |
0.0 |
62.2 |
17.0 |
18.5 |
|
Fish as a percentage of average daily protein consumption |
17 |
1.7 |
20.0 |
6.6 |
4.8 |
|
Fishers as a percentage of the economically active population |
17 |
0.1 |
3.2 |
0.7 |
0.7 |
|
Rural poverty headcount index |
14 |
14.7 |
81.7 |
53.1 |
20.3 |
Latin America includes some of the world's most important fisheries producing nations, dominated by the Peruvian industrial fisheries. Marine capture fisheries predominate, although there were sizeable inland fisheries in Brazil and Mexico, and aquaculture production exceeded 50 000 tonnes in Brazil, Chile, Colombia, Ecuador, and Mexico. Although many of these fisheries are export-oriented, on average the sector's contribution to agricultural exports was lower than for all developing economies. It is also the region with the lowest per capita consumption (after the Transition Economies). The employment rate in the region was modest and substantially below the average for all countries. Rural poverty is a major development issue throughout the region.
Latin America
Trade against consumption
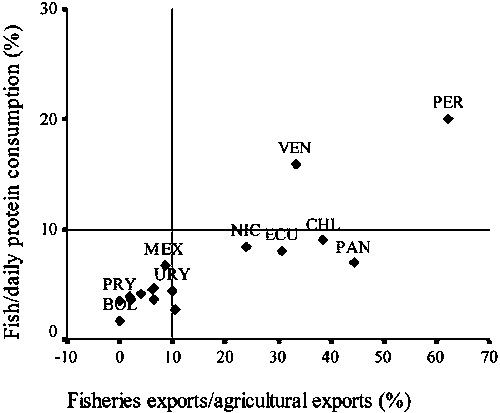
Figure 3.4
Figure 3.4 illustrates the above point about consumption, indicating that Peru and Venezuela alone were located in the Northeast quadrant, although the absolute volume of Peru's exports set it apart from the other countries in this region. Chile, Ecuador, Honduras, Nicaragua and Panama inhabited the Southeast quadrant, indicating their export-orientation, with Uruguay marginally outside this quadrant. Chile and Ecuador were the major producers within the Southeast quadrant. No country was located in the Northwest quadrant, revealing the relative unimportance of fish in Latin American diets. Of the ten Southwest quadrant countries Argentina, Brazil, and Mexico were major fisheries producers. The region, with the exception of the land-locked states of Bolivia and Paraguay, and Brazil, ran a substantial fisheries trade surplus during 2000.
Figure 3.5 shows the relationship between fisheries employment and rural poverty. The sector's contribution to regional employment is weak: only Ecuador and Panama lie in the Eastern quadrants. Countries to the left of the one percent level of employment reference line typically fall into one of three distinct categories. Several countries (Argentina, Chile, Peru, and Venezuela) have large capital-intensive fisheries. A second group (including Brazil, Ecuador and Mexico) have a mixed fishery including a large artisanal sector. Finally, there are those countries where artisanal fisheries predominated, typically Central American republics. With respect to rural poverty, only Chile fell below the twenty percent reference line.
Latin America
Employment against rural poverty
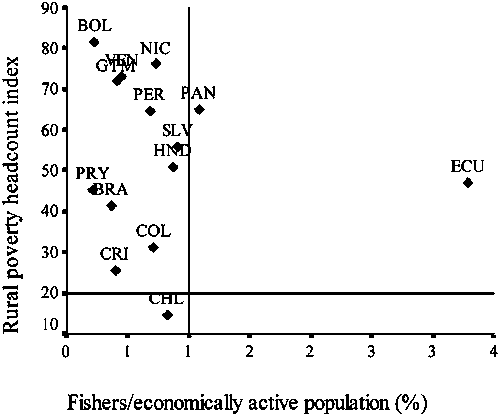
Figure 3.5
(ii) African countries with PRSPs
Table 3.3 summarizes the characteristics of African states for which PRSPs are available.
Table.3 Descriptive Statistics: Africa - PRSP States
|
|
N |
Min |
Max |
Mean |
s.d. |
|
|
Fisheries exports as a percentage of agricultural exports |
25 |
0.0 |
68.5 |
17.3 |
25.4 |
|
|
Fish as a percentage of average daily protein consumption |
26 |
1.4 |
65.8 |
25.0 |
19.5 |
|
|
Fishers as a percentage of the economically active population |
26 |
0.0 |
8.3 |
0.9 |
1.6 |
|
|
Rural poverty headcount index |
16 |
32.4 |
86.5 |
56.8 |
16.2 |
|
Compared to the data presented in Table 3.1, it is evident that fisheries play a less important role in these states, which on average experienced a higher incidence of rural poverty. None of these economies were a major global fishing nation during 2000, which may in part be attributable to the dependence upon inland fisheries by a large number of these countries.[29] With respect to consumption, the countries range from those where fish played a negligible role in domestic diets (e.g. Djibouti, Ethiopia), to those where it accounted for some two thirds of animal protein consumed (Ghana and Sierra Leone).
Africa: PRSP States
Trade against consumption
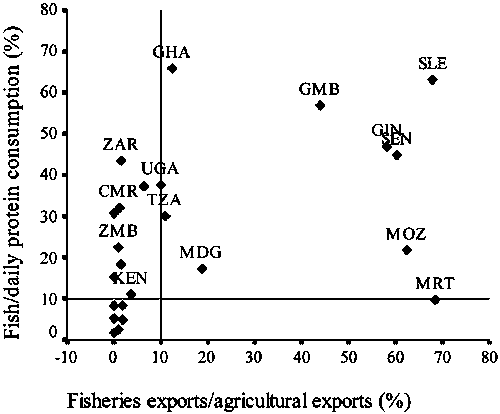
Figure 3.6
Figure 3.6 plots trade against consumption. Ten countries were located in the Northeast quadrant signifying a high contribution to agricultural exports and to domestic consumption. Of all the countries examined, Sierra Leone ranked tenth with respect to its fisheries trade contribution but fourth by consumption. Only Mauritania was positioned in the Southeast quadrant where we expect to find the more export-oriented countries. Ten countries were positioned in the Northwest quadrant, although Uganda was on the cusp of the Northeast quadrant. The remaining countries (Burkina Faso, Central African Republic, Djibouti, Ethiopia, Niger, and Rwanda) were located in the Southwest quadrant, although consumption in the Central African Republic and Rwanda was close to the ten percent threshold.
Data on rural poverty was available for sixteen African states completing PRSPs. Since rural poverty exceeded twenty percent in each case Figure 3.7 only shows the Northeast and Northwest quadrants, containing five and eleven countries respectively. Although the employment rate in relation to the economically active population averages just below one percent, this figure is somewhat distorted by Chad where the employment rate exceeds eight percent. Employment also exceeded the one percent level in Ghana, Madagascar, Senegal, and Sierra Leone, plus Benin and Mali (not shown in Figure 3.7). Of these countries, the level of rural poverty is greater than two-thirds in Chad, Madagascar, and Sierra Leone. A number of countries in the Northwest quadrant, such as Burkina Faso, Djibouti, Lesotho and Niger, are very small fisheries producers. Conversely, while Cameroon, Kenya, Tanzania and Uganda were all significant producers, the relative magnitude of employment in the sector was nonetheless low.
Africa: PRSP States
Employment against rural
poverty
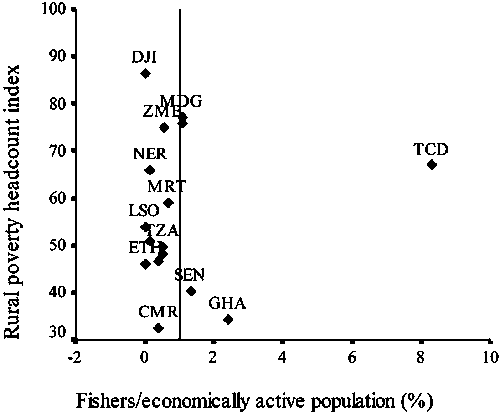
Figure 3.7
(iii) African countries without PRSPs
There is considerable diversity among these economies. Egypt, Morocco, and South Africa were the group's major producers, although production in Nigeria exceeded 500 000 tonnes in other years. Production was primarily from marine fisheries, although there were major inland fisheries in the Democratic Republic of Congo, Egypt, and Nigeria, with the most sizeable incidence of aquaculture found in Egypt. Employment and poverty rates in these countries were lower than in those African states completing PRSPs, this also being the case with respect to consumption.
Table 3.4 summarizes the characteristics of those African states for whom PRSPs are not available
Table 3. Descriptive Statistics: Africa - Non-PRSP States
|
|
N |
Min |
Max |
Mean |
s.d. |
|
|
Fisheries exports as a percentage of agricultural exports |
20 |
0.0 |
81.9 |
22.0 |
29.0 |
|
|
Fish as a percentage of average daily protein consumption |
20 |
1.9 |
45.6 |
17.7 |
14.5 |
|
|
Fishers as a percentage of the economically active population |
20 |
0.0 |
1.5 |
0.6 |
0.4 |
|
|
Rural poverty headcount index |
6 |
21.6 |
62.8 |
33.6 |
15.2 |
|
Figure 3.8 shows five countries were located in each of the quadrants. There is no clear factor underlying these groupings, with perhaps the exception of those countries in the Southwest quadrant, which were all small producers during 2000. Of those countries to the right of the ten percent contribution to agricultural exports, Algeria, Angola, and the Republic of Congo ran deficits on fisheries trade. All the countries to the left of this reference line (with the exception of Burundi, Somalia and Sudan), also ran trade deficits.
Africa: non-PRSP States
Trade against
consumption
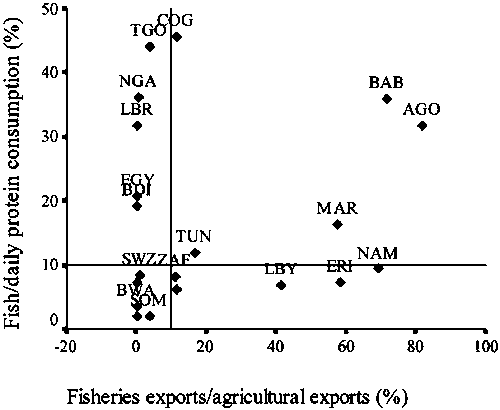
Figure 3.8
Figure 3.9 reveals the marked absence of comparable data on rural poverty for this group of economies (just six observations), with each of the six exhibiting rates that exceeded twenty percent. Nigeria and Tunisia alone appear in the Northeast quadrant, although Gabon (not on scatter diagram) witnessed the highest rate of sectoral employment among non-PRSP African states. Among countries in the Northwest quadrant, the sector in Egypt and Morocco was a large employer in absolute terms, employing approximately a quarter of a million persons in the Egyptian case during 2000. Fisheries employment in Algeria at about 26 000 persons was modest considering that countries" large coastal population, while the sector in Zimbabwe was extremely small, employing less than 2 000 persons.
Africa: non-PRSP States
Employment against rural
poverty
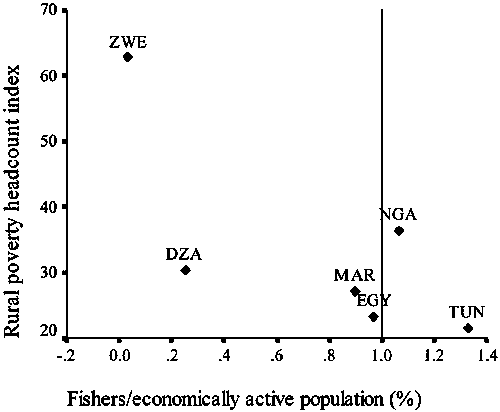
Figure 3.9
(iv) Asia
Table 3.5 summarizes the characteristics of Asian states.
Table 3. Descriptive statistics: Asia
|
|
N |
Min |
Max |
Mean |
s.d. |
|
|
Fisheries exports as a percentage of agricultural exports |
20 |
.00 |
78.45 |
23.68 |
24.037 |
|
|
Fish as a percentage of average daily protein consumption |
20 |
1.82 |
56.41 |
26.68 |
19.1 |
|
|
Fishers as a percentage of the economically active population |
20 |
.00 |
4.99 |
1.33 |
1.22 |
|
|
Rural poverty headcount index |
15 |
4.60 |
57.20 |
33.88 |
15.07 |
|
China was the largest producer from capture fisheries and aquaculture, harvesting over 41 million tonnes in 2000. This compared to the few hundred tonnes recorded in Mongolia. However, the region included the highest number of major fishing nations: Bangladesh, India, Indonesia, Malaysia, Myanmar, Pakistan, the Philippines, Thailand, and Viet Nam all recorded production exceeding 500 000 tonnes. The region's other unique feature was the contribution of aquaculture, accounting for over one-third of fisheries production in seven countries (Bangladesh, China, India, Jordan, Laos, Nepal, and Syria) and exceeding capture fisheries in four (China, Jordan, Laos, and Syria). Average consumption was the second highest of any region and poverty the second lowest.
Asia
Trade against consumption
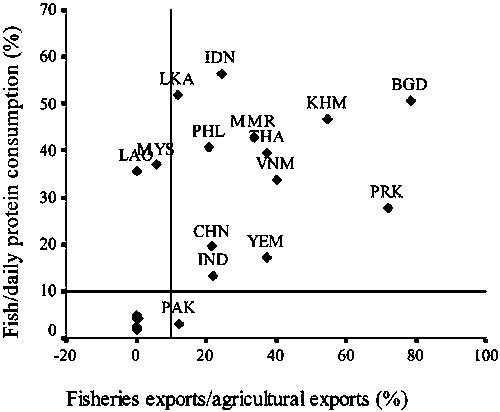
Figure 3.10
Figure 3.10 shows Bangladesh exhibited the highest fisheries contribution (vis-à-vis the value of agricultural exports) of the twelve countries situated in the Northeast quadrant - twice the level of Myanmar, Thailand, and Yemen. Fisheries accounted for a smaller proportion of the value of agricultural exports in Sri Lanka and India, the countries with the highest level of domestic consumption. Pakistan, one of the region's major producers, was the only country located in the Southeast quadrant: on average, Pakistanis only consumed some 0.7 grams of fish commodities per day - half the volume consumed in neighbouring India. Fisheries commodities demonstrated a strong contribution to domestic consumption in Laos and Malaysia, the two countries in the Northwest quadrant. Malaysia was a significant producer in 2000, while Laos ran a trade deficit in fisheries commodities that year, suggesting that imports underpinned the high daily per capita consumption in that country. Production in the five countries in the Southwest quadrant averaged just over 10 000 tonnes per country during 2000 and, with the exception of Mongolia, each ran a fisheries trade deficit in the same year.
Figure 3.11 indicates that, with the exception of Malaysia, countries in the Northeast (7 cases) and Southeast (2 cases) quadrants with higher employment rates were strongly export oriented. All but Cambodia and Sri Lanka were major fishing nations. The association between fisheries employment and rural poverty was strongest in the Philippines and Viet Nam. Thailand, another major fishing nation, was on the cusp of the Southeast quadrant, but was located with Yemen in the Southwest quadrant. Negligible employment rates in landlocked Laos, Mongolia, and Nepal ensured their location in the Northwest quadrant. Although there were a large number of fishers in Pakistan, their contribution to employment did not exceed one percent of the labour force.
Asia
Employment against rural poverty
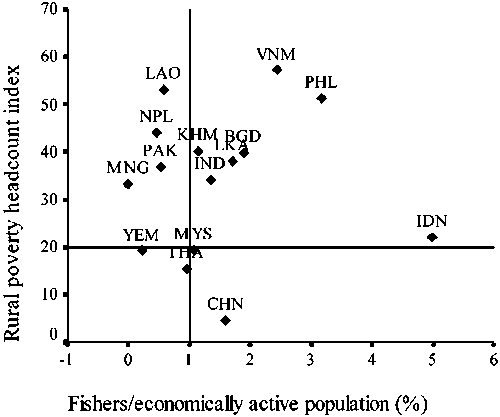
Figure 3.11
(v) Transition economies
Table 3.6 summarizes the data on the transition economies.
Table 3. Descriptive statistics: transition economies
|
|
N |
Min |
Max |
Mean |
s.d. |
|
|
Fisheries exports as a percentage of agricultural exports |
22 |
0.0 |
56.3 |
6.9 |
13.0 |
|
|
Fish as a percentage of average daily protein consumption |
23 |
0.3 |
14.3 |
5.1 |
4.7 |
|
|
Fishers as a percentage of the economically active population |
23 |
0.0 |
0.9 |
0.1 |
0.3 |
|
|
Rural poverty headcount index |
7 |
9.9 |
64.5 |
30.2 |
17.9 |
|
Fisheries were relative unimportant in transition economies during 2000. Average contributions to trade, consumption, and employment were lowest in this group. Only Russia was a major fishing nation during 2000. This reflects not only the relative levels of development and diversification of these countries (in part consequent upon post-transition decline), but also the land-locked nature of many of the states - particularly the ex-Soviet republics. For example, the combined capture fisheries and aquaculture production of countries within the Commonwealth of Independent States fell from 9.9 percent of the world total in 1988 to 3.5 percent in 2000 (FAO, 2002). The level of rural poverty was also lower than other country groups, albeit based upon limited observations. Given the rapid growth in income inequality within these states, it is probable that the full extent of rural poverty was somewhat higher than Table 3.6 suggests (IFAD, 2002).
Transition economies
Trade against consumption
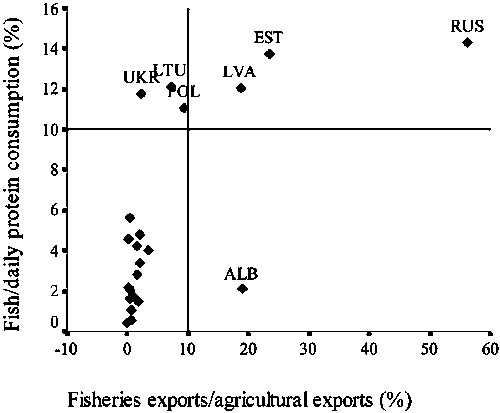
Figure 3.12
Figure 3.12 shows the association between the contribution to trade and consumption for all countries with the exception of Kyrgyzstan and Tajikistan. All countries were located in the Southeast or Southwest quadrants, since fish does not account for more than ten percent of the daily protein consumed in any country. Russia, Estonia, Albania, and Latvia were the most export-oriented countries, with the contribution to agricultural export earnings approaching the ten percent threshold in Poland and Lithuania. Six countries exceeded the ten percent threshold contribution to daily animal protein consumption (Estonia, Latvia, Lithuania, Poland, Russia, and Ukraine), each of which played an important part in the historic North European fish trade. Most Transition Economies (15 cases) were located in the Southwest quadrant, where there was considerable variation in the contribution of fish to animal protein consumption. While Annex 1 reveals national levels of consumption in these fifteen countries in detail, it is evident that fish makes the greatest dietary contribution in the western Transition Economies (e.g. Slovakia, the Czech Republic and Macedonia) compared to the eastern republics (e.g. Uzbekistan, Kyrgyzstan).
Figure 3.13 shows that employment did not exceed one percent of the labour force in any of the seven countries for which we have data (this was also the case for those transition economies not depicted in figure 3.13 due to the absence of rural poverty data). This is not surprising as many transition economies, as we have noted above, are land-locked, hence the opportunities for fisheries development and employment are clearly limited. In the Russian Federation, the group's major fishing nation, the magnitude of the national labour force ensured that the employment rate was less than half of one percent. With the exception of Estonia, where fisheries make a significant contribution to national income, the majority of the countries examined in Figure 3.13 are very small fisheries producers, producing on average less than 9 000 tonnes in 2000.
Transition economies
Employment against rural
poverty
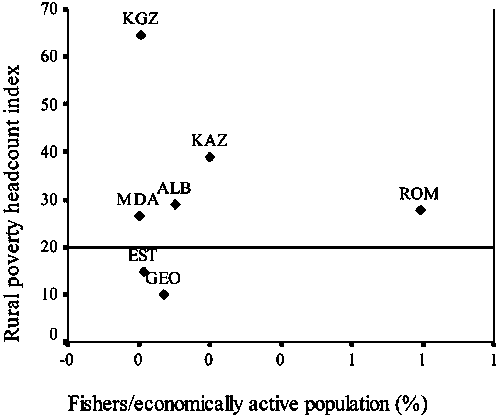
Figure 3.13
No economy in this category was a major fisheries producer during 2000: only Cuba and the Maldives produced more than 100,000 tonnes from all fisheries, with the average for the 30 countries being about 3,600 tonnes. With the exception of Cuba, Dominica, and Jamaica, aquaculture was of little importance, and freshwater capture fisheries were only important in Fiji, Haiti, and Papua New Guinea. As a group, these economies exhibit a high dependence upon fisheries, with fisheries commodities contributing more or less the entire value of agricultural exports for the Maldives during 2000. Although the contribution to trade was much smaller in other SIDS, the average was still considerably greater than for any other group. The contribution of fisheries commodities to diets and employment in SIDS was also greater than average, indicating the sector's absolute importance to these states. The rate of poverty averaged one in three of the rural population.
(vi) Small island developing states
Table 3.7 Summarizes the data on small island developing states
Table 3. Descriptive statistics: small island developing states
|
|
N |
Min |
Max |
Mean |
s.d. |
|
|
Fisheries exports as a percentage of agricultural exports |
23 |
0.0 |
99.8 |
24.5 |
31.8 |
|
|
Fish as a percentage of average daily protein consumption |
23 |
10.7 |
84.8 |
32.1 |
21.5 |
|
|
Fishers as a percentage of the economically active population |
23 |
0.1 |
22.0 |
4.1 |
4.8 |
|
|
Rural poverty headcount index |
5 |
20.0 |
66.0 |
43.2 |
19.8 |
|
Small Island Developing States
Trade against
consumption
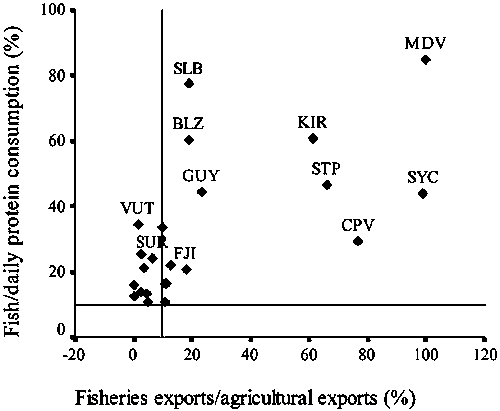
Figure 3.14
Figure 3.14 reveals the importance of fisheries trade to SIDS. However, we treat these figures with caution on grounds of the limited scale of fisheries production and economic activity in many of these countries. Fisheries contributed in excess of ten percent of the value of agricultural exports during 2000 for nearly two-thirds of the countries, with fourteen SIDS positioned in the Northeast quadrant - with the Seychelles, the Maldives, Cape Verde, Sao Tome and Principe, and Kiribati being the most strongly export oriented countries. Nine economies were located in the Northwest quadrant, including a cluster of Caribbean states (Dominican Republic, Jamaica, St Kitts and Nevis, St Lucia, St Vincent and Grenadines, and Trinidad and Tobago) where consumption was possibly exaggerated by tourism.
As Figure 3.15 shows, data on rural poverty in SIDS is limited, and it is likely that this does not present an accurate representation of the relationship between employment and poverty in this group of countries. As Annex 1 indicates, the level of fisheries sector employment in SIDS was extremely high in some cases. Fishing sector employment account for three-quarters of employment in Micronesia. Employment only fell below one percent in five cases, four of which are represented in Figure 3.15. Alternative summary measures of poverty, such as the Human Development Index, suggest that rural poverty in SIDS is likely to be significant. Consequently, we expect that most SIDS would be located in the Northeast quadrant were sufficient data available.
As is clear from the preceding analysis, there are substantive differences in the extent to which countries are reliant upon the fisheries sector in regard to trade (compare Peru to Paraguay), domestic protein consumption (compare Lesotho to Sierra Leone), employment (compare Mongolia to Indonesia) and rural poverty (compare Trinidad and Tobago to Haiti). Yet sectoral significance, in terms of either trade/consumption or poverty/employment, is no guarantor that the sector will be effectively incorporated into PRSPs or NDPs however, as the following section shows.
Small Island Developing States
Employment against rural
poverty
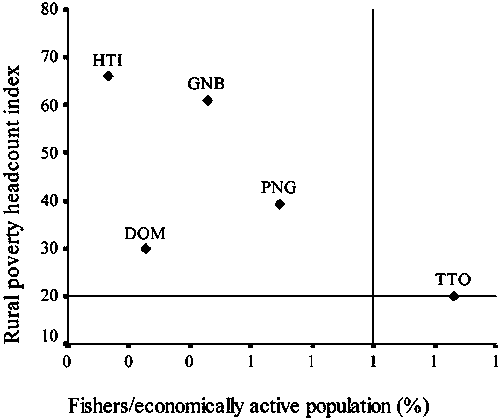
Figure 3.15
|
[13] The other three USAID
pillars are: Global Health (GH), Democracy, Conflict and Humanitarian Assistance
(DCHA), and the Global Development Alliance (GDA). [14] FAO (2003b) have, in fact, highlighted that "net export revenues from fish exports earned by developing countries reached US$ 17.7 billion in 2001, an amount larger than for any other traded food commodity such as rice, cocoa, tea or coffee." [15] Indeed, as FAO (2003a:13) clearly caution; "The big problem in fishing is that wealth and revenue tend to sow the seeds of their own destruction through over-exploitation". [16] In Viet Nam, for example, where fish provides 37 percent of daily animal protein intake, the government announced a Sustainable Aquaculture for Poverty Alleviation (SAPA) Strategy and Implementation Programme as a part of a wider Hunger Eradication and Poverty Reduction (HEPR) Programme (Govt Viet Nam, 2001). [17] This protein source could have internal or external origins. In the case of the former (fish protein extracted from internal - inland and marine - water-bodies), safeguards could be introduced to regulate domestic catch rates so as to avoid the over-exploitation of the resource base. In the case of the latter (fish proteins imported to satiate internal demand), access to such proteins could be assured through the signing of fisheries agreements, as in the case of the EU, for example. Providing alternative sourcing options exist, such agreements may well have a deleterious impact upon fish stocks in the supplying country's waters however (ADE, 2002:61). [18] These being; the probability of death between ages 1-4, the illiteracy rate (6 years and above), lack of access to health services (5+ kilometres away) and safe drinking water, and percentage of children under 3 who were underweight (PRSP-Benin, 2002:13). [19] By livelihood we are referring to 'the activities, the assets, and the access that jointly determine the living gained by an individual or household' (Ellis, 1999:2). [20] In fact these figures probably understate the complexity of local livelihood strategies as only four activities (agriculture, fishing, cattle-holding, and trade) were considered. Decomposing these four activities (agriculture could be split into the production of permanent or annual crops, or equally differentiating between a livelihood that results from the sale of agrarian labour and the production of own crops for example), would almost certainly provide evidence of more complex livelihood strategies. [21] The STREAM paper, for example, takes the line that households are poor because they are fishers - and argues that in wild capture fisheries there is "considerable potential for addressing poor people through interventions directed at those fisheries (2000:31)". Conversely, Béné et al. (2000:14/5) argue that households fish because they are poor - and attribute the root cause of poverty to the predominance of private property relations in the area, relations which force those households with inadequate access to land to resort to fishing in order to meet their income and consumption requirements. Identification of the correct causal relationship is therefore imperative if optimal amelioratory policies are to be introduced. [22] Comparable work on the agricultural sector under the Livelihoods and Diversification Directions Explored by Research (LADDER) programme sponsored by Dfid-UK produced micro-evidence which suggested the creation of "... a facilitating environment that encourages the flourishing of diverse monetised rural activities in Tanzania/Malawi should be the centrepiece of rural poverty reduction thinking" (Ellis and Mdoe, 2003:1381; Ellis et al. 2003:1508). [23] Moreover, as fishers are often involved in multiple activities in order to sustain their livelihoods, as we have noted above, rural poverty statistics are also likely to incorporate rural households whose main or secondary incomes are derived from fishing. [24] The exceptions are those involved in fish distribution or marketing, occupations which are more urban-based. However, given the immense data shortcomings in the field and the small proportion of the urban economically active population employed in fish distribution and marketing, this paper will continue to view poverty in the fisheries sector as an essentially rural-based phenomenon. [25] Size (in employment terms) does not necessarily equate with size (in production output terms). Iceland, for example, is highly dependent on its fisheries sector in terms of GDP and exports, as we have noted earlier - but much less so in employment terms (6,100 fishers out of an economically active population of 161 000 = 3.8 percent) due to the industrial nature of its fisheries. Countries with large numbers of fishers, particularly in terms of the economically active population, are placed more towards the small-scale (marine coastal and inland as opposed to marine deep sea) end of the fisheries continuum - the end where poverty is more likely to be concentrated (FAO, 1999; Macfadyen and Corcoran, 2002). [26] We use the UN recognised definition of Small Island Developing States (see http://www.un.org/special-rep/ohrlls/ohrlls/allcountries.pdf although this, paradoxically, encompasses states which are neither particularly small - either geographically or in population terms (Cuba, Jamaica), nor islands (Guyana, Guinea-Bissau). [27] Data from a limited number of countries (Fiji, Kenya, Malaysia, Papua New Guinea, the Philippines, Sierra Leone, the Solomon Islands, Sri Lanka and Zimbabwe) was not available in the Food Balance Sheets. In these instances, figures were taken from the World Resources Institute's Earth Trends Environmental Information Portal. [28] The number of fishers is derived from FAO Fishery Country Profiles, and data for the total economically active population from FAOSTAT. We have used the most recent estimates of the rural poverty headcount index from the following sources: World Bank (2001), the World Bank Poverty Monitoring Database, and IFAD (2001). [29] Of the 26 African PRSP states, twelve depended upon inland fisheries for more than 90 percent of fisheries production in 2000 (Burkina Faso, Central African Republic, Chad, Democratic Republic of Congo, Ethiopia, Kenya, Malawi, Mali, Niger, Rwanda, Uganda, Zambia). |