![]()
![]()
![]()
This annex provides:
additional information on the structure of the discard database;
support for assumptions regarding certain discard rates used in the database; and
discussion on the problems of determining accurate estimates of discards, with particular reference to discard sampling and raising or extrapolating the sample estimate to the population (i.e. the fleet, species or fishery).
An accurate determination of bycatch and discard rates is important for fisheries management. If the rates assumed for a fishery are too low, then TACs are likely to be exceeded (Pacific Fishery Management Council, 2001). The long-term biological stability and yield of the fishery may be affected and rebuilding strategies for depleted stocks may not be successful. Chronic underestimation of fishing mortality places the future economic benefits to the industry at risk through further depletion of resources. If the bycatch and discard rates assumed for the fishery are too high, then total mortality is overestimated and TACs may be set too low, which unduly restricts fishing, resulting in less economic benefit to the industry.
C.1 DIAGRAMMATIC REPRESENTATION OF CATCH CONCEPTS
Figure 3 provides a diagrammatic representation of the catch concepts upon which the FAO Fishstat statistical system is based.
C.2 DISCARD SAMPLING
Accurate estimates of discards depend on discard sampling and the subsequent raising or extrapolation of the sample estimates to the entire population. Sampling discards and raising of sample values to the species, fleet or fishery level pose numerous technical difficulties that are briefly discussed below.
The complex nature of many discard investigations can make them costly in terms of financial and human resources. Costs can prove prohibitive to many fisheries administrations. A recent investigation into the discard and escape mortality of Nephrops and roundfish from demersal trawls required the concerted efforts of six different institutes and other parties from five different countries (Denmark, Norway, Sweden, the United Kingdom and the United States), at a cost of 1.9 million euros (Fisheries Technology Committee, 2000). Multivariate analysis of discard sampling data may also provide insights into the design of management measures (Murawski, 1996).
Clarity regarding the purpose of sampling[136] is essential for design of an effective sampling protocol. If the discard estimates are to be used as an input to stock assessments, then detailed information on parameters such as sex, weight, age, length, maturity and fecundity may be required.
There are several approaches to estimating discarding in a commercial fishery:
observers
retention of discards by fishers
questionnaires
simulated commercial fishing
modelling
Delphi.
FIGURE 4: Diagrammatic representation of catch concepts (FAO)
C.2.1 Use of trained observers
Sampling of discards by observers is generally regarded as the most effective and accurate method (Punt, 1999), but not if discarding is illegal.[137] Many national authorities and regional fisheries bodies (e.g. NAFO, ICES/EC, NEAFC, CCAMLR) make use of observers for sampling of discards.
Observer programmes encounter a range of difficulties. Discards cannot be assessed accurately where catches are slipped. Safety of observers at sea is a concern, particularly if the vessel crew are “hostile”. In situations where there are a limited numbers of observers and several fleets (vessel strata), there are problems in selecting the vessels on which to place observers, as there is a need to cover all strata and in particular the strata with the greatest inherent discard variability (Cotter et al., 2002). Vessels also change gear on trips. Discard variability tends to be higher between trips than between hauls or sets, requiring more trips rather than more fishing operations to be sampled. Vessels are the primary sampling units and days and trips may prove difficult to use for random sampling. In addition to the difficulties in designing discard sampling programmes to reflect the variability in fleet characteristics, fisher behaviour and the spatial and seasonal variation in fish distribution, some sampling may require consideration of the diurnal variation in fish behaviour, placing additional burdens on observers (van Beek, 1998).
Observer schemes are only useful for estimating total bycatch where there is also an adequate measure of total fleet activity. Furthermore, observer schemes can only provide a minimum estimate of bycatch (European Commission, 2002b). Even the most vigilant observer will miss some events. Animals that are trapped in fishing gear underwater, but then fall from the gear before it is hauled back to the boat, for example, will almost never be counted. Observers must also be able to see the net or other gear as it reaches the boat and access the catch as it is sorted. During the hours of darkness this ability may be compromised, depending on lighting conditions, and this can also lead to underestimation. If automatic sorters are used, the observer may never get a full view of either the catch or the discards. Moreover, the presence of the observer may alter the discard behaviour of the fishers.
|
BOX 10 “Two fishing boats, even if similar outwardly, seldom process their catches in exactly the same way. Fish pounds are of various shapes and sizes; fish may be picked out by hand or with a conveyor belt; the whole catch may or may not be containerized initially; discards may be selected by eye or by measurement; they may be tossed overboard immediately or accumulated and shovelled over in one or more large lots; and the fish for landing may or may not be gutted and sorted. Discarded fish can be mixed with varying quantities of marine weed, rubbish, etc. (’trash’) depending on grounds and gear type, making sampling difficult. Sampling can also be constrained by the space and shelter available for working, the weather, and by time. It is important that observers conduct their work without unduly holding up the normal processing of fish for landing and marketing. A further time constraint arises because, for safety, the observer should not usually remain on deck alone when the crew have finished their work. For these reasons, samples often represent only a small proportion of the catch, leading to sampling variance.” From BIOECO 93/003 (Cotter, 1995), cited in ICES CM 2000/ACFM:11 (ICES, 2002b). |
|
BOX 11 “The established observer procedures, as outlined in the observer manual, for estimating regular discard (broken shrimp) will be continued. However, these procedures will not be applied for instances of significant highgrading of shrimp.
|
A general impression obtained from the literature on discards is that insufficient attention is devoted to discards of non-commercial invertebrate species, such as echinoderms, tunicates, sponges and crabs. This may be because the primary focus of observer reports is on commercial species or because of the notion that such invertebrates are “rubbish”, “debris”, or of no interest. Even in regimes that prohibit discards, allowance is made for discarding of non-commercial species (such as in Iceland).
Real discards are always higher than visual estimates made by experienced observers, at times more than ten times higher (NAFO, 2000). However, observer reports are still the most reliable[138] means of determining levels of discards and bycatch, even though the reports may reflect a minimum, rather than total level of discards. Where bycatch quotas are managed at the vessel level, managers and owners quickly recognize the potential consequences of biased sampling, and the sampling and estimation process may receive greater scrutiny.[139]
The reply of NOAA/NMFS to Oceana
The reply of NOAA/NMFS to Oceana provides a valuable and comprehensive summary of the issues relating to the sampling of bycatch and, by extension, the sampling of discards (NOAA [Department of Commerce], 2003). The reply provides a balanced discussion on the objectives, needs, priorities, coverage and costs of bycatch sampling, with particular regard to the use of observers and the legal obligations on the administration to provide accurate estimates of bycatch.
C.2.2 Logbooks and retention by fishers
Requiring or requesting fishers to record discards in logbooks can provide a valuable source of discard information. For example, NAFO (NAFO, 2002) and NEAFC have rules on logbook discard data.
Comparison[140] of discard information recorded by observers and in vessel logbooks may enable the correction of vessel logbooks to provide improved estimates of discards. While individual trip logbooks may not provide a high level of accuracy, discard rates based on logbook data averaged across trips, tows or fleet may be closely correlated with observer-based discard rates. If such a correlation can be shown, a correction factor may be applied to the logbook data, which are generally shown to underestimate discards.
Fishers may be asked (or paid) to collect, preserve and hold samples of discards from their own catches. Scientific staff then process the samples when the vessel returns to port. This approach may place a heavy reliance on the fisher to do the sampling or respect the sampling protocol but may be more cost effective than observer programmes (Lart, 2002).
C.2.3 Questionnaires and interviews
Responses to questionnaires may be inaccurate, or those fishers willing to complete the questionnaires may bias the results. Interviews must be confidential, they require a knowledgeable interviewer and a relaxed atmosphere, and they can be expensive. The Delphi method is a subjective method using the accumulated experience of recognized experts in the field. All approaches have mixed results.
C.2.4 Simulating commercial fishing
A research vessel or a chartered commercial fishing vessel is chartered and deployed with gear similar to that used commercially. The level of discarding can be estimated from the length distributions found in the catches by comparison with the length distributions in landed commercial catches (Medley, 2001). It is necessary to assume that fishing techniques successfully simulate those of commercial vessels and that fishing is geographically and temporally representative of how the fleet fishes. Similar inferences can be made from the composition of landings or even the size grades of exports of different fleets fishing the same fishery (The Irish Skipper, 2003).
C.2.5 Modelling
Discards may be estimated using data for total landings by the fleet, knowledge of the size selectivity of commercial fishing gear, and knowledge of the length distributions of the fish population (Casey, 1996). The latter may come from a research vessel survey using a small mesh trawl. This method may be helpful when no direct measures of discarding can be obtained. Although many assumptions are inherent in the method, no raising problems arise because modelling is applied to the total landings data. The approach may not be suitable for the estimate of total discards, i.e. fish that are not commercial and not length sampled, or for factory vessels. Models can also be of considerable assistance in designing a more effective sampling protocol; in testing discard reduction measures; and in replacing average discard rates with a more robust interpretation of the variability (Helser, Methot and Hastie, 2002).
C.2.6 Sampling design, sampling strata and data storage
If the primary objective of discard sampling is to improve the catch estimates used for stock assessments, it is advantageous to use the same sampling strata and to ensure compatibility between landings and discard databases. Raised discards can then simply be added to landings to give the total catch[141] for that stratum.
However, in practice, use of these strata for sampling discards is not necessarily efficient. First, quantities of fish discarded are not necessarily proportional to quantities landed, depending also, for example, on the size selectivity of the fishing gear and the availability of quota to land a species. Second, it is possible to sample the landings of several vessels during one visit to a port, but one discard sampling trip may take two to three weeks. Third, the variability in discards is unlikely to be similar to the variability in landings. Therefore, a statistically valid sampling scheme (Tamsett et al., 1999; Allen et al., 2001) is likely to require different sampling strata and, to obtain accurate estimates of discards, sampling effort must be designed to concentrate on the levels of largest variability (Rochet et al., 2000; Allen et al., 2002). Furthermore, large numbers of sampling strata are not practical for discard sampling with small numbers[142] of observers, as in most European countries. In many sampling periods it simply will not be possible for observers to sample trips from each of many strata. The result is that unbiased estimation is made very difficult. Several other factors constrain establishing standardized, at-sea sampling schemes for discards:
high diversity of fleets in different countries;
different levels of information available about these fleets (e.g. vessel lists, total effort);
different trip lengths (e.g. one day or 30 days);
different observer resources (from two covering a long coastline, to all trips observed, as in Canada); and
to some extent, differences of opinion regarding the statistical framework and theory suitable for discard surveys.
While many countries are embarking on new discard programmes there may not be an effective system for the storage, retrieval and analysis of discard data. Logbook information on discards often remains unanalysed. Considerable additional efforts are required to establish statistically sound, cost-effective discard sampling protocols.
C.2.7 Transboundary stocks and fisheries
Transboundary stocks may require different approaches to sampling, particularly if international quota stocks are involved. Among ICES[143] members, the country of origin generally makes arrangements to sample discards and associated landings. Observer programmes in international fisheries pose particular problems regarding responsibility for observers.
The country of landing
Observers in the country of landing often have difficulty in finding out when and where a foreign vessel will be landing. This makes scheduling of the trips with their main sampling programme for national vessels very difficult. Having successfully boarded a vessel in the observer’s own home country, the observer may be disembarked in another distant country and be faced with an expensive return journey. The observer may have language difficulties on board. There may subsequently be difficulties obtaining data from the foreign country to permit raising of results from the sampled trip to the appropriate fleet. Alternatively, results may be sent to the foreign country for their own use. Teams of observers tend to be so busy with sampling their own national vessels that they are reluctant to sample for other countries. This could be altered by making contractual arrangements, but the scheduling problem remains.
The country of ownership
Observers are likely to have to travel both to and from the country of ownership. The country of ownership may not have comprehensive lists of all the vessels owned (but only those registered with them). Inclusion of all vessels in a sampling scheme may therefore be difficult. The country of ownership is unlikely to have the information necessary to raise trip results to the appropriate fleet level. Observers from the country of ownership are likely to speak the same language as the crew.
The country of registration (flag country)
The flag country will have all available information about the vessel and will therefore be in a good position to schedule sampling and raise trip results to the appropriate fleet. Transportation and language problems are likely to arise for observers. However, contracting the country of landing to undertake the sampling and to send back the data for the trip may be practical, provided that sufficient notice is given.
International discard database
Baltic countries have established a common database (BALTCOM) which demonstrates (ICES, 2002) the opportunities for holding discard data regionally. However, it is necessary to assess carefully how such a database could be applied to regions other than the Baltic. Possible problems are:
difficulties in drawing boundaries between seas;
fishers may disapprove of the level of disaggregation of the data, which may reveal the identity of a vessel to fishing competitors or to enforcement agencies, even though the name of the vessel itself is not stored. Fishers might withdraw their cooperation with sampling activities as a result;
national legislation on data privacy may constrain sharing of “raw” data;
national sampling authorities may claim intellectual property rights over some data or fail to contribute required information for other reasons, e.g. concern that national quotas may be reduced;
different types of fishing vessels, discard sample surveys and data raising methods in each region may cause significant computational problems; and
linking of discards and landings data in one database, if thought desirable, could cause various technical difficulties in each region.
C.3 RAISING OF DISCARD ESTIMATES
Raising factors are required to convert sample results for individual catches, trips or vessels to estimates of discarding by the total fleet or fishery over a given sampling period, e.g. one year. The design of sampling protocol is highly relevant to the raising of discard data. Raising of results for a trip to an estimate for a fleet may utilize the number of vessels in the fleet, the total effort or the total landings. Whichever factor is selected, reliable data must be available to fit the chosen sampling strata. For example, a fishery with a defined gear type (or mesh size) as a sampling stratum should have matching landings (catch) declarations.
One common way to establish the fleet estimate is to raise the quantity of discards in a sample of a catch to an estimate of the discards in the total catch, then to extrapolate from the individual catch to the trip, from the trip to the vessel, and finally from the vessel to the fleet. Quantities may be recorded as weights or numbers of fish. Estimates of discards based on the mean of individual tows appear to overestimate discards. Using the sum of the discard weights and landing weights from all sampled hauls has been shown to give a more accurate estimate of discard rates (Allain, Biseau and Kergoat, 2003). Common raising methods[144] include those:
by landings (or catch)
by number of vessels
by number of trips
by trips per vessel and number of vessels (two step)
by other measures of effort, e.g. hauls, 1 000 hooks
by probability of sampling;
by strata
in accordance with a model.
Each approach has its advantages and disadvantages and each is based on assumptions regarding the relationship between discards and parameters recorded during sampling. In most cases the assumption is that this relationship is linear. This is the assumption that has been used in raising discards to fishery level in the discard database. However, in some fisheries it is suggested (Rochet, Péronnet and Trenkel, 2002) that there is no auxiliary variable upon which discards can be accurately projected, i.e. sampling is essential to determine discards. The absence of a coherent theory upon which discards can be forecast suggests that no one method can currently be judged as the superior for all fisheries (Trenkel and Rochet, 2001).
Problems with estimates
A comparison between raised retained quantities and officially reported landings may reveal substantial anomalies, which may have consequences at a political level. Autoconsumption and illegal landings may account for substantial unreported catches. The use of unreliable landings records to raise discard estimates may render these estimates inaccurate. As many national fisheries statistics are not readily available by fleet, by gear or by fishery, discard information may be difficult to raise to the fleet or fishery level. There may be significant differences between effort-based and landings- based discard estimates, particularly with regard to the incidence and quantity of discards of shoaling species in trawl fisheries (Walmsley, Leslie and Sauer, 2003; Trenkel and Rochet, 2001).
C.4 DISCARD DATABASE FILE STRUCTURE
The database file structure is given in Table 33. Access to and use of the discard database will be determined by FAO.
C.5 ASSUMPTIONS REGARDING DISCARD RATES
Most small-scale and artisanal fisheries in developing countries have been allocated a discard rate of either 0.5 or 1 percent, as a zero discard rate was considered to be unrealistic for some artisanal fisheries. The rate assigned to a particular fishery is based on additional information from the country, the region or fisheries assumed to be similar.
Certain highly selective fisheries have been assigned a zero discard rate based on the available literature, contacts with experts and the author’s own experience. These fisheries include diver fisheries for abalone, sea urchins, lobster; squid jig fisheries and artisanal troll fisheries. Some of the supporting evidence is presented in Table 35.
TABLE 33
Description of the discard database
fields
|
Code |
Description of field |
Notes/comments |
|
FAOA |
FAO area code |
Sometimes difficult to assign the fishery to an FAO area, e.g. South China Sea |
|
LMESP |
Large marine ecosystem code |
Not inserted as yet (several uses foreseen) |
|
SA1 |
Type of sub-area |
For example, ICES will also insert other FAO sub-area codes |
|
SA1C |
Sub-area code |
For example, IV for Irish Sea, CECAF 34.3.2. for Cape Verde insular |
|
SA2 |
Second sub-area |
For example, name of RFMO - ICCAT |
|
SA2C |
Second sub-area code |
For example, RFMO code, e.g. ICCAT 22 = Brazil, etc. |
|
Country |
Name of country |
Standard UN/FAO name (check); can be a group of countries (e.g. “all ICCAT members”) |
|
F |
Fishery, usually a function of the available information |
Text description of fishery. Not all entries are “fisheries” as, for example, total catch is sometimes given for a small country in absence of other information (or as check) |
|
Main species |
Target species |
Species names as in bibliog. ref., e.g. “bonga”, “peixe pedra”; at times “multispecies” |
|
G |
Gear name from the bibliographic reference |
For example, trawl, gillnet, matanza, basnigan, “multigear” sometimes used |
|
L/C |
Flag indicating landing (L) or catches (C). Coded “N” when referring to numbers in incidental catches (marine mammals, seabirds, etc.) |
Major problems in determining exact nature of quantities, nominal landings
or catch. |
|
Yr |
Year to which the L/C refers |
Sometimes average used if time series available |
|
LCTonnes |
Landings in tonnes; incidental catches in numbers |
See L/C above; numbers used with regard to seabirds, etc. |
|
RefT |
Bibliographic reference/source of tonnage information |
|
|
Main discards |
Species or species groups as described in source material |
Substitute with FAO codes/insert extra code field; some species names in local language |
|
Discard rate |
Discards as % of total catch (landings + discards) |
Direct from source material or calculated from information in reference; at times assumed |
|
Dtonnes |
Tonnes of discards |
Direct from reference material or calculated from information in reference, e.g. shrimp: bycatch ratio and % of bycatch discarded |
|
Basis |
Note on basis for discard calculation |
For example, observers, survey, applied discard rate from adjacent country, assumed/similar fishery |
|
RefD |
Bibliographic reference for discard information |
|
|
RefYr |
Reference year for discard information |
Important because of changing regulations, e.g. obligation to use square mesh from 1999 |
|
Reason |
Reason for discards |
Field often not completed, D = discretionary, R = regulatory, H = highgrading, etc. |
|
Measures |
Notes on measures applied |
For example, TEDs obligatory, BRDs used, obligation to land...% of bycatch, no-discard policy |
|
Exp |
Status of the fishery |
Fully exploited, overexploited, etc.; check conforms to FAO/ national classification |
|
Other comment |
Any other comments |
|
|
LIFDC |
Low income food deficit country |
Flag - may be used in later analysis; data available partly inserted |
|
PerCap |
Per capita fish consumption |
To obtain from FAO Fishstat, may be used in later analysis |
|
ProSpec |
Protected species |
Flag - separate lines inserted and flagged with P |
|
XtraWkSheet |
Reference to additional worksheet (country.xls) |
Flag - refers to subsidiary sheets for certain countries/fisheries where discard data in the source material were transformed to discard database format |
|
DT |
Discard total |
Flag - records selected for calculation of total discards |
|
D |
Double counting |
Flag - indicates possible/probable source of double counting |
|
SS |
Small-scale fishery |
Flag - indicates small-scale fisheries |
|
Country code |
Field not in spreadsheet as yet |
Standard UN/FAO code to be inserted |
|
Species code |
Field not in spreadsheet as yet |
Use standard FAO code - species/species group/family, etc. |
|
ISSCFG |
Field not in spreadsheet as yet |
International fishing gear classification code ISSCFG - to be inserted (note other class, e.g. United States) |
TABLE 34
Number of records by country or
area
|
Albania |
1 |
Germany |
10 |
Pakistan |
11 |
|
Algeria |
4 |
Ghana |
5 |
Palau |
1 |
|
American Samoa |
1 |
Greece |
7 |
Panama |
3 |
|
Angola |
12 |
Grenada |
1 |
Papua New Guinea |
2 |
|
Anguilla |
1 |
Guadeloupe |
1 |
Peru |
31 |
|
Antigua and Barbuda |
1 |
Guam |
1 |
Philippines |
34 |
|
Argentina |
48 |
Guatemala |
4 |
Pitcairn Islands |
1 |
|
Aruba |
1 |
Guinea |
6 |
Poland |
5 |
|
Australia |
39 |
Guinea-Bissau |
7 |
Portugal |
20 |
|
Bahamas |
2 |
Guyana |
6 |
Puerto Rico |
1 |
|
Bahrain |
5 |
Haiti |
2 |
Qatar |
1 |
|
Bangladesh |
9 |
Honduras |
1 |
Romania |
1 |
|
Barbados |
8 |
Iceland |
20 |
Russian Federation |
61 |
|
Belgium |
4 |
India |
18 |
Saint Helena |
1 |
|
Belize |
1 |
Indonesia |
13 |
Saint Kitts and Nevis |
1 |
|
Benin |
2 |
Iran, Islamic Rep. |
4 |
Saint Lucia |
1 |
|
Bermuda |
1 |
Ireland |
24 |
Samoa |
1 |
|
Brazil |
62 |
Israel |
5 |
Sao Tome |
2 |
|
British Virgin Islands |
1 |
Italy |
5 |
Saudi Arabia |
9 |
|
Brunei Darussalam |
4 |
Jamaica |
2 |
Senegal |
13 |
|
Bulgaria |
1 |
Japan |
53 |
Seychelles |
2 |
|
Cambodia |
12 |
Jordan |
1 |
Sierra Leone |
4 |
|
Cameroon |
6 |
Kenya |
2 |
Slovenia |
1 |
|
Canada |
50 |
Kiribati |
1 |
Solomon Islands |
1 |
|
Cape Verde |
5 |
Korea, Dem. Rep. |
4 |
Somalia |
3 |
|
Cayman Islands |
1 |
Korea, Rep. |
32 |
South Africa |
31 |
|
Chile |
61 |
Kuwait |
3 |
Spain |
18 |
|
China |
36 |
Latvia |
4 |
Sri Lanka |
12 |
|
Colombia |
3 |
Lebanon |
1 |
Sudan |
4 |
|
Comoros |
1 |
Liberia |
4 |
Suriname |
7 |
|
Congo |
1 |
Libyan Arab |
|
Sweden |
9 |
|
Cook Islands |
1 |
Jamahiriya |
5 |
Syrian Arab Republic |
2 |
|
Costa Rica |
5 |
Lithuania |
1 |
Taiwan Province China |
18 |
|
Côte d’Ivoire |
3 |
Madagascar |
5 |
Tanzania, United Rep. |
2 |
|
Croatia |
1 |
Malaysia |
60 |
Thailand |
24 |
|
Cuba |
2 |
Maldives |
9 |
Timor-Leste |
1 |
|
Cyprus |
3 |
Malta |
4 |
Togo |
1 |
|
Denmark |
25 |
Marshall Islands |
1 |
Tokelau |
1 |
|
Djibouti |
1 |
Martinique |
1 |
Tonga |
1 |
|
Dominica |
1 |
Mauritania |
8 |
Trinidad and Tobago |
12 |
|
Dominican Republic |
2 |
Mauritius |
3 |
Tunisia |
8 |
|
Ecuador |
1 |
Mexico |
44 |
Turkey |
18 |
|
Egypt |
9 |
Micronesia, Fed. |
|
Turks and Caicos |
|
|
El Salvador |
5 |
States |
1 |
Islands |
1 |
|
Equatorial Guinea |
1 |
Montserrat |
1 |
Tuvalu |
1 |
|
Eritrea |
5 |
Morocco |
27 |
Ukraine |
1 |
|
Estonia |
4 |
Mozambique |
7 |
United Arab Emirates |
1 |
|
European Union |
7 |
Multiple countries |
99 |
United Kingdom |
36 |
|
Faeroes |
8 |
Myanmar |
9 |
United Kingdom |
|
|
Falklands/Malvinas |
12 |
Namibia |
17 |
(British Indian Ocean |
|
|
Fiji Islands |
1 |
Nauru |
1 |
Territory) |
1 |
|
Finland |
7 |
Netherlands |
6 |
United States |
136 |
|
France |
34 |
New Caledonia |
1 |
Uruguay |
15 |
|
France (Mayotte) |
1 |
New Zealand |
7 |
Vanuatu |
1 |
|
France (Réunion) |
4 |
Nicaragua |
7 |
Venezuela |
17 |
|
French Guiana |
4 |
Nigeria |
3 |
Viet Nam |
15 |
|
French Polynesia |
1 |
Niue |
1 |
Wallis and Futuna Is. |
1 |
|
Gabon |
2 |
Norfolk Island |
1 |
Yemen |
7 |
|
Gambia |
2 |
Northern Mariana |
|
Yugoslavia/Serbia and |
|
|
Gaza strip/Palestine |
1 |
Islands |
1 |
Montenegro |
1 |
|
Georgia |
1 |
Norway |
57 |
|
|
| |
|
Oman |
6 |
Total |
1 791 |
Note: not all records contain discard information. The number of records is an indication of the number of fisheries recorded.
TABLE 35
Supporting evidence for low or negligible
discard rates in certain fisheries
|
Area |
Comment/fishery |
Source |
|
Small-scale and artisanal fisheries |
||
|
Morocco |
“... considered non-existent, since local fishers sold or consumed the total catch” |
Baddyr, 1989 |
|
Cameroon |
“... there are no discards in artisanal fisheries. In Cameroon, even the immature fish is used so there is nothing to be discarded at all” |
O. Njifonjou, pers. comm. |
|
Senegal |
“... no discards in artisanal fisheries” |
CRODT, pers. comm. |
|
Mozambique |
“... insignificant in artisanal fisheries” |
IDPPE, Maputo |
|
Pacific Islands |
“... statistically not distinguishable from zero” |
T. Adams (SPC), pers. comm. |
|
Samoa |
“... very rare” |
A. Wright (SPREP), pers. comm. |
|
Caribbean Islands |
“Negligible” |
Chief Fisheries Officer, Saint Lucia; FAO Regional Fisheries Officer |
|
Myanmar |
“... discards are negligible in artisanal fisheries” |
Myanmar Fisheries Federation, 2003, pers. comm. |
|
Other fisheries and countries |
||
|
Eastern Central Atlantic |
“... discards have never been assessed but are supposedly negligible” |
Balguerías, 1997 |
|
Sri Lanka |
“... no discards in Sri Lanka fisheries as all fish landings are utilized for human consumption” |
A. Hettiarachchi, Director-General, pers. comm. |
|
Thailand |
“... we make use of everything” |
SEAFDEC |
|
Cambodia |
“... there are no discards” |
Delegate to COFI, 2003 |
|
Viet Nam |
“... we do not collect information on discards as discarding is not of concern. Discards are low or negligible” |
Delegate to COFI, 2003 |
|
Malaysia |
“... not common in Malaysian capture fisheries” ... “trash fish ... is being used as fishmeal by the aquaculture industry” |
bin Nuruddin, (2003), Samut Prakan workshop |
|
Malaysia and Thailand |
“RSW [refrigerated seawater] systems ... allowed nearly all the bycatch to be kept on board” ... “... quantum of discards expected to decrease” |
Chee, 1997 |
|
Indonesia |
“Very low in all fisheries except the Arafura Sea trawl fishery.” ... “Negligible in most artisanal fisheries” |
P. Martsubroto (FAO), pers. comm. L. Engvall, pers. comm. |
|
China |
“Although much of this catch is low market, none is discarded.”
... “Discarding is not believed to exist any more” |
Zhou and Ye, 1997 |
| |
“All species are targets” |
China delegate to COFI, 2003 |
|
India |
“very very low” |
Ministry, Delhi, pers. comm. |
|
South Africa, Japan, other |
Zero discards in squid jig fisheries |
Japp, 1997 |
|
South Africa |
Zero discard rate in abalone diver fisheries |
Japp, 1997 |
|
Cape Verde |
Lobster diver fishery |
Ministerio do Mar |
|
Mauritania |
Octopus pot fishery |
DSPCM |
|
Senegal |
Kayar linefish |
Fisheries inspector |
|
Celtic Sea/Biscay |
Tuna pole and line |
Melnychuk et al., 2001 |
|
Norway |
Mackerel troll |
Valdemarsson and Nakken, 2002 |
|
Fishmeal fisheries |
||
|
Peru |
“... discards estimated to represent <5% of total landings” |
IMARPE (R.G. Carrasco), pers. comm. |
|
Denmark (Baltic) |
“... no, or minor discards ... impossible to sort ... discards in these fisheries are negligible” |
ICES, 2000a |
|
Morocco |
>5% caused by net damage (coastal sardine used for food and fishmeal) |
Haddad, 1994 |
|
Iceland CECAF region |
“... insignificant” (industrial pelagic vessels) Blue whiting caught for fishmeal Russian pelagic midwater trawlers for small pelagics (targeted as food fish, not for fishmeal). “... bycatch entirely processed to fishmeal... insignificant discards of invertebrates only” |
Fishing News International, 2003 N.M. Timoshenko, pers. comm. |
|
South Africa |
Purse seine and midwater - minor regulatory discards only |
Japp, 1997 |
|
Black Sea |
Fishmeal plant capacity is greater than supply of anchovy |
Fisher cooperative, Trabazon, pers. comm. |
|
Scotland |
Argentine and blue whiting fishery |
Pierce et al., 2002 |
|
Norway |
Industrial fishing 1-2.4% discard |
Valdemarsson and Nakken, 2002 |
|
Baltic |
Swedish herring and sprat trawl |
ICES, 2000a |
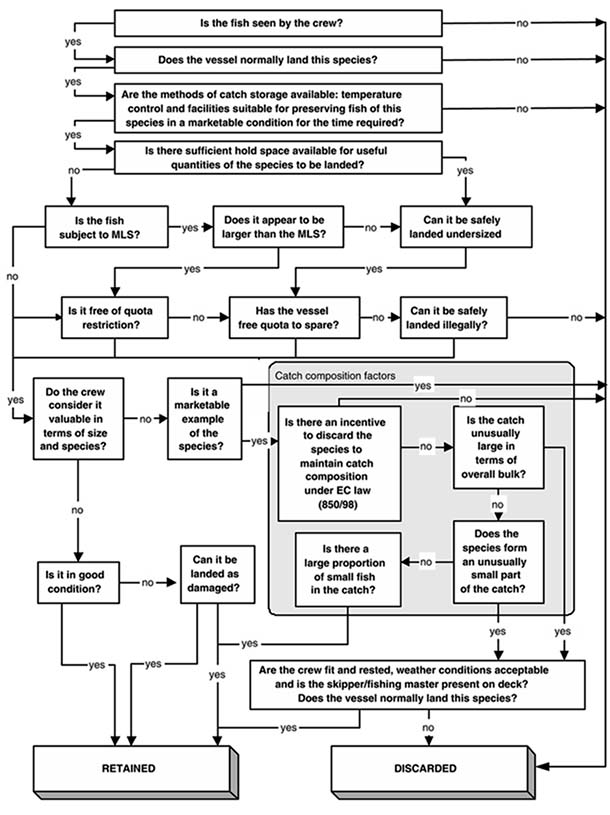
D.1 CAUSES OF DISCARDS
A clear understanding of the reasons for discarding is necessary in order to change discarding practices and help design sampling and raising protocols. A basic classification of the catch may be made into: (i) fish (species/sizes/sex) always retained; (ii) fish always discarded; and (iii) fish partially/occasionally discarded. The reasons for the discards are likely to vary by type of fish and discard reduction efforts may be most effectively focused on fish that are partially discarded.
D.2 CAUSAL DIAGRAM AND DECISION FRAMEWORK
D.2.1
Evaluation of bycatch
FIGURE 5: Evaluation of bycatch
Adapted from Horsten and Kirkegaard, 2002.
Figure 5 presents the causes and consequences of discarding.
TABLE 36
A classification of causes of
discards
|
Cause/parameter |
Comment/examples/trends |
|
Biological |
|
|
Species composition |
High species diversity is likely to increase untargeted species harvested. Changes in the species composition in fisheries may increase or decrease discards and may be directly linked to overfishing. Changes in discarding practices are likely to be related to change in the proportion of target species |
|
Year class |
Large juvenile year class may increase discards |
|
Exploitation status (overfishing) |
Overfishing may result in a larger proportion of smaller fish in the catch and large discards of juveniles or fish under the MLS; low stock density of target species may lead to increased fishing effort and unwanted bycatch |
|
Sex |
Target is roe fish only, immature/male fish may be discarded |
|
Poisonous/dangerous |
For example, landings of Lujanus bohar are prohibited in Réunion; stingrays |
|
Vessel characteristics |
|
|
Size of fish hold |
Bycatch may occupy space designated for target species |
|
Freezing capacity |
Quality of more valuable target species may suffer; insufficient freezing capacity; different freezing duration for shrimp and bycatch, for example |
|
Limited ice on board |
Quality of target species may suffer if ice is used for bycatch |
|
Catch quantity |
If catches are large, then discards may be higher |
|
Processing plant |
Catches exceed capacity of plant (e.g. surimi plant, fishmeal plant). Small/very large sizes cannot be handled by filleting machines |
|
Catch composition |
Small sizes, damaged fish, impossible to sort (small pelagics) |
|
Fishing operations |
|
|
Skipper |
Payment mechanism, personal preferences, skills |
|
Selectivity |
Wide range of effects on target species and bycatch |
|
Crew remuneration |
Payments linked to bycatch recovery, or not |
|
Trip length |
Discards higher at start of long trip |
|
Haul length |
Discards may be higher if trawl haul time is long, because of damage to fish |
|
Soak time |
Discards higher with long soak time because of damage to fish, e.g. Celtic Sea French gillnets |
|
Time of trip |
Differences in fish behaviour day/night/tides, e.g. Nephrops North Sea; discards may be higher at the start of a trip |
|
Fishing area |
Some areas known to have high concentrations of juveniles/unmarketable fish/predators (line fisheries)/jellyfish |
|
Fishing season |
Restrictions often applied to avoid large unwanted catches of juveniles |
|
At-sea transfer |
Payment, theft of target catch |
|
Gear |
|
|
Rigging of gear |
May have a major influence in trawl and longline fisheries, e.g. chafers |
|
BRDs |
Major effect in some fisheries, e.g. in Norway, in NAFO, square mesh panels in Nephrops trawls, numerous Australian trawl fisheries |
|
Hook/line type/bait |
Related to mouth, feeding behaviour and fishing depth, e.g. tuna/shark |
|
Mitigation measures |
Assessment of effectiveness difficult because of low incidental catch rates |
|
Selectivity |
Gear characteristics may not be in harmony with regulations, e.g. MLS |
|
Market |
|
|
No/poor market for bycatch |
Common in many fisheries, e.g. Guianas shrimp, Mozambique shrimp. Uneconomical to freeze low-value bycatch |
|
Damaged fish |
For example, crushed in the codend, decomposed, shark damaged |
|
Taboos, customs |
Low or non-consumption of shark in Jamaica |
|
Bycatch retention reduces value of target species |
Use of crew time for sorting, reduced efficiency of freezers, cold store efficiency compromised |
|
Highgrading |
Common in many quota fisheries (e.g. EU, United States) |
|
Poor economic performance |
May result in retention of more bycatch to cover costs (marginal profitability). May also result in reduced fishing effort and reduced discards |
|
Regulatory |
|
|
Licensing |
Fishing licence may restrict catch/landings to certain species |
|
Observer effect |
Presence of observer may result in greater retention of bycatch, increased discards (e.g. if the observer is monitoring quotas), or increased reporting of discards |
|
Highgrading/quotas |
Common where quotas are strictly enforced |
|
Target species as % of landings |
May result in “discards” or disposal of non-target species after landing, i.e. bycatch retention only until landing and subsequent dumping, e.g. France |
|
MLS |
The less selective the gear the higher the discards |
|
Bycatch quota |
Requires effective enforcement, probably by observers and possibly retention of bycatch |
|
Time/season |
Effective in reducing bycatch and discard of juveniles |
|
Level of enforcement |
All regulatory discards are closely related to the level of enforcement or fishing community peer pressure |
FIGURE 6: Causal diagram of discards
|
FIGURE 7
Adapted from Lart, 2002. |
|
[136] See ICES, 2000b (CM
2000/ACFM:11) for a comprehensive discussion; Hall, 1999. [137] The observer effect refers to a situation in which the fishing practices of a vessel differ in some significant way when an observer is aboard. When this occurs, the observer-collected data are not representative of the fishery as a whole. [138] A close correspondence (r2 = 0.8) between observer and logbook reports of discards was recorded in the Hawaii longline fishery (Walsh, Kleiber and McCracken, 2002). [139] “Sample sizes are often small relative to catch sizes ... and the random sampling requirement may be compromised by vessel operations such that observers only have access to, for example, the first fish to be spilled from the codend after the catch has been dumped.” From Karp et al, 2000. [140] Sampson (2002) shows that logbooks underestimated discards by approximately 20 percent, but that the boat-to-boat variability can be high. [141] See tables prepared by ICES (2002). [142] A 100 percent observer coverage is mandatory in several United States fisheries and in many industrial fisheries in West and southern Africa, in Canada and in New Zealand. [143] Several paragraphs in this section of Annex C are quoted or adapted from ICES reports, e.g. ICES, 2002. [144] For further discussion see ICES, 2000b. |
![]()
![]()
![]()
)
)
)