![]()
![]()
![]()
The year 2001 has been a period of stagnation, if not outright recession, for most economies in the Latin America and Caribbean region. The difficult external environment, characterized by slow economic growth and unstable financial markets, has combined with internal problems linked to weak domestic demand, macroeconomic disequilibria and political instability in several countries. These factors have translated into a marked reduction in the pace of economic activity in the region, with GDP growth estimated at around 1 percent in 2001, about half the growth rate achieved in 2000.73 Through its depressing effects on wages, employment and, ultimately, effective demand for food, the reduction in economic activity constitutes a major setback from the perspective of food security.
| 2001 was a year of economic stagnation for Latin America and the Caribbean. |
Unlike in 2000 when the strong United States economy had a more robust positive impact on the northern part of the region (particularly Mexico) than on the south, poor performances were more evenly distributed throughout the region in 2001. Of major consequence for the whole region were the depressed performances of its three largest economies. In Mexico, GDP was expected to record zero growth after the very high rate (6.9 percent) achieved in 2000. After showing promising signs of recovery in 2000 and early 2001, Brazil's economy was hard hit by a serious electricity crisis and the deteriorating economic environment. Entering its fourth year of recession, Argentina's economy was severely affected by the virtual disappearance of external financing and difficulties in reducing the fiscal deficit and servicing public debt. These events cloud with uncertainty Argentina's prospects for an early recovery, and raise concern over their financial and trade implications within the Southern Common Market (MERCOSUR) and the rest of the region. Peru and Uruguay also faced very difficult situations, expected to translate into growth rates below 1 percent in 2001, while Chile and Venezuela, in spite of some slowdown, were expected to maintain growth rates of around 3 percent.
The slackening in economic growth has been transmitted across countries through a sharp reduction in trade. With weaker demand and lower prices for its export products, the region experienced a marked slowdown of its export earnings. With imports also slackening, although at a slower pace than exports, the region's trade deficit was expected to widen in 2001. As a result, its current account deficit was expected to increase from $47 billion in 2000 to $58 billion in 2001 - the latter figure representing 3 percent of the region's GDP. At the projected levels of current and capital accounts, the net transfers of resources to the region in 2001 would be almost nil. Indeed, for the third year running, gross capital inflows will have to be allocated entirely to debt amortization and factor services.
| Below-average agricultural output growth in 2000. |
With the exception of 1994-95 and 1999, which were unusually favourable years for agriculture, the performance of the region's agriculture sector in recent years has tended to lag behind that of its economy as a whole. This held true also for 2000. Agricultural production growth in 2000, at 2.1 percent, was markedly below that of overall economic activity and only slightly exceeded population growth. Low growth in crop production (0.6 percent) was partly compensated for by continued strong output growth (4.4 percent) in the livestock sector. The low crop growth was recorded in all three major producing countries: Argentina (with the exception of cereals), Brazil (with a reduced cereal crop) and Mexico. Among the subregions, only the Caribbean recorded an above-average output performance, with an increase in crop and livestock production of 3.1 percent. In Central America and South America, output growth was close to the regional average at 1.7 percent and 2.2 percent, respectively.
|
Table 17 |
||||||
1997 |
1998 |
1999 |
2000 |
20011 |
20021 |
|
|
(Percentage) |
||||||
|
Argentina |
8.1 | 3.8 | -3.4 | -0.5 | -2.7 | -1.1 |
|
Brazil |
3.3 | 0.2 | 0.5 | 4.4 | 1.8 | 2.0 |
|
Chile |
7.4 | 3.9 | -1.1 | 5.4 | 3.3 | 3.0 |
|
Colombia |
3.4 | 0.6 | -4.1 | 2.8 | 1.4 | 2.4 |
|
Mexico |
6.8 | 5.0 | 3.7 | 6.9 | 0 | 1.2 |
|
Peru |
6.7 | -0.5 | 0.9 | 3.1 | 0.2 | 3.7 |
|
Venezuela |
6.4 | 0.2 | -6.1 | 3.2 | 2.7 | 1.8 |
|
Latin America and the Caribbean |
5.3 | 2.3 | 0.1 | 4.1 | 1.0 | 1.7 |
|
1 Projections. Source: IMF. 2001. World Economic Outlook, December. Washington, DC. |
||||||
Some improvement is expected for the year 2001. Agricultural output is estimated to grow at 2.7 percent, although this is still below trend (the average yearly growth for 1991-2001 was around 2.9 percent). Weather and market conditions affected countries and products in very different ways in 2001. In particular:
| Some improvement in overall agricultural output performance is expected in 2001. |
|
Table
18 |
||||
Year |
Agriculture |
Crops |
Cereals |
Livestock |
(Percentage) |
||||
|
1992-96 |
2.9 |
2.5 |
4.5 |
3.6 |
1997 |
3.3 |
3.7 |
3.3 |
1.9 |
|
1998 |
1.7 |
2.6 |
-2.4 |
1.1 |
1999 |
5.4 |
4.5 |
4.8 |
6.3 |
|
2000 |
2.1 |
0.6 |
2.6 |
4.4 |
20011 |
2.7 |
4.6 |
7.8 |
1.8 |
|
1 Preliminary. Source: FAO. |
||||
The importance of agricultural trade for the Latin America and Caribbean region hardly needs emphasizing. The region is, in per capita terms, by far the most agricultural trade-oriented of all developing country regions. Its agricultural exports (at around $100 per capita/year) are five times greater than those of sub-Saharan Africa or Asia and the Pacific, and over three times larger than those of the Near East. The value of per capita agricultural imports in Latin America and the Caribbean also largely exceeds the average of all developing country regions except the Near East. Despite rapid industrialization, agricultural trade and related economic activities still constitute key sources of growth, employment and foreign exchange for the region.
| The region's agricultural trading patterns have undergone major changes over recent decades. |
However, the region's agricultural trade patterns and characteristics have undergone significant changes over recent decades, which have been a period of major transformations in the overall economic, political and institutional scene. The region's agriculture, especially its more modern and trade-oriented sectors, has shown considerable capacity to grasp the new opportunities arising from greater liberalization and integration of world markets. Nevertheless, the sector has faced difficulties in improving productivity and competitiveness, diversifying its product base and maintaining a strong presence in world trade. These difficulties have been linked to internal constraints and also to intensifying international competition, unstable and often depressed markets and persistent institutional barriers to agricultural trade.
This section presents statistical evidence underlying those issues. It provides, in particular, indicators of the economic importance of agricultural trade for Latin America and the Caribbean - both currently and in earlier periods - and explores the main characteristics, trends and pace of change of agricultural trade in the region.
| Agricultural exports have increased faster than production over the 1990s. |
Recent decades have seen an expansion in the volume of agricultural trade at rates that have significantly exceeded those of agricultural production. This tendency, which underlines the growing interdependence and integration of the region's agriculture with world markets, has been particularly marked since the mid-1990s, a period of trade liberalization and revival of international trading arrangements (Figure 25). Indeed, while the volume of production rose by around 56 percent from 1980 to the late 1990s, that of exports almost doubled during the same period.
The growing importance of trade relative to output can also be observed with regard to imports. The case of cereals, the main group of imported commodities, is especially significant. Figure 26 shows a sizeable increase in per capita cereal supply - from about 220 kg to 290 kg yearly - between the early 1960s and 1999.
The expansion in cereal supply, which has contributed strongly to the considerable nutritional gains of the region over the past decades, has been achieved largely through an increasing recourse to imports. Indeed, while per capita production of cereals has declined from the levels achieved in the mid-1980s, imports have risen to represent about 12 percent of the total cereal supply in 1996-99.
Figure 27 summarizes the general trends of imports and exports of agricultural, fishery and forestry products and the shares of these exports and imports in relation to total merchandise trade.
In general, agricultural trade showed considerable dynamism during the 1970s, reflecting steep price increases for traditional commodity exports in the early and latter parts of the decade. This was followed by a virtual standstill during the 1980s, a period of deeply depressed markets in the region with dramatic price declines particularly during 1982-83, and a subsequent resumption of growth in the 1990s, especially strong during the "commodity boom" years of 1997-98.
| But the share of agriculture in total exports has declined. |
Despite its vigorous expansion during most of the period, however, agricultural trade has steadily lost its share in total trade, as the process of industrialization advanced and other traded products - especially manufactures - gained relative importance. While agricultural exports accounted for 43 percent of total exports during the early 1970s, they now account for just over 20 percent. The reduction in the share of agriculture in total imports has been much less marked, reflecting the growing recourse to external markets for meeting domestic food needs. Indeed, the agricultural import share has fluctuated around 12-13 percent during the past three decades and currently stands at around 10 percent.74
| The region has maintained a stable share of world agricultural exports. |
In a context of growing competition from traditional and emerging agricultural markets worldwide, the region has maintained a relatively stable position in world commodity trade. The region's share of total world agricultural exports has moved around the 15-17 percent level during the past three decades, with a slight declining trend until the late 1980s but subsequently increasing to represent almost 20 percent in recent years (Figure 28). These trends contrast favourably with the situation in most developing countries in other regions, in particular in Africa and the Near East, which have lost market share during the same period.75
A widely different pattern emerges with regard to Latin America and the Caribbean's position in world agricultural imports. The region's share in the total has shown a pronounced upward trend since the 1980s, when foreign exchange shortages had imposed severe restrictions on imports, including food imports. The region currently accounts for about 8 percent of the world's population and almost 10 percent of total world agricultural imports, up from 6 percent in the late 1980s (Figure 29).
| The product composition of agricultural exports has become more diversified. |
Latin American and Caribbean countries have traditionally derived the bulk of their agricultural export earnings from a limited range of food and raw material products. In recent decades, however, there has been a sharp deterioration in the international market conditions of several key commodities exported by the region (see The price factor on page 117). This situation has prompted renewed efforts in many countries towards export diversification, through both a widening of the commodity product base and an increase in the value added of exports. Efforts to move away from overspecialization have achieved varying degrees of success in the different countries, but have contributed overall to considerable changes in the relative importance of the various export products. These changes are summarized in Table 19, which shows the 15 main agricultural products exported by the region, ranked by their importance in 1970-72, and the evolution of their respective shares in total agricultural exports.
|
Table
19 |
||||
Export product |
1970-72 |
1980-82 |
1990-92 |
1997-99 |
|
(Percentage) |
||||
|
Coffee, green |
24.0 | 19.8 | 12.2 | 13.8 |
|
Sugar (centrifugal, raw) |
17.5 | 19.4 | 11.3 | 5.3 |
|
Cotton lint |
6.2 | 3.0 | 2.3 | 0.8 |
|
Bananas |
5.2 | 3.7 | 7.4 | 5.5 |
|
Beef and veal |
4.7 | 1.1 | 0.6 | 0.3 |
|
Maize |
4.2 | 2.7 | 1.5 | 2.5 |
|
Beef and veal, boneless |
3.6 | 2.3 | 2.5 | 2.3 |
|
Beef preparations |
2.1 | 1.7 | 1.6 | 1.0 |
|
Cattle |
2.0 | 0.8 | 1.2 | 0.6 |
|
Cocoa beans |
1.6 | 1.3 | 0.7 | 0.3 |
|
Tobacco leaves |
1.4 | 2.0 | 2.9 | 2.5 |
|
Wheat |
1.3 | 2.5 | 2.1 | 2.5 |
|
Tomatoes |
1.3 | 0.7 | 0.9 | 1.1 |
|
Soybean cake |
1.2 | 6.2 | 7.9 | 7.6 |
|
Sugar, refined |
1.2 | 2.5 | 1.4 | 2.0 |
|
Total |
77.5 | 69.6 | 56.6 | 48.0 |
|
Source: FAO. |
||||
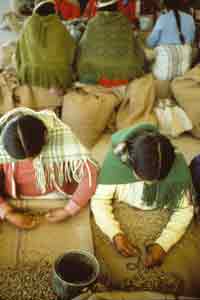
Women in a cooperative sorting coffee grains
In Latin America and the Caribbean the importance of some traditional export products such as coffee has declined steadily in recent years. Nevertheless, coffee is still the most important agricultural export commodity of the region.
- FAO/10089/J. VAN ACKER
Noteworthy features are:
|
Box 7 SOYBEANS IN ARGENTINA AND BRAZIL One remarkable feature of the recent agricultural development in Latin America is the emergence of Argentina and Brazil as two of the world's largest producers and exporters of soybeans. In the early 1960s, soybean production in Brazil represented only 1 percent of global production, with virtually no production taking place in Argentina. At the turn of the decade, their combined share in global production still did not exceed 4 percent, the bulk of it still accounted for by Brazil. The 1970s saw the beginning of a phenomenal expansion in soybean production in Brazil, followed by Argentina with some years' lag. Their continued expansion over the 1980s and 1990s has led them to become the second and third largest producers, accounting for one-third of total world production in recent years. The share of Argentina and Brazil in the global export market of soybeans and soybean products has also shot up quickly. Their combined share now represents around 40 percent of total world exports. Many factors have contributed to this remarkable growth. In Brazil, the development of "tropical" soybean varieties by the national agricultural research and extension network EMBRAPA (Empresa Brasileira de Pesquisa Agropecuaria) enabled soybean production to expand from the temperate southwest of the country to areas in the centre west. Policy assistance by the government and recent macroeconomic stability also contributed to the rapid expansion. The rapid expansion of soybean production in Argentina was induced by the high international prices in the early 1970s. Favourable agroclimatic conditions and improved cropping systems also contributed. Soybean yields rose quickly, especially in the 1970s, while planted areas expanded, reflecting a shift from coarse grains and pasture as well as new planting. Double cropping with wheat made soybean production more profitable. Policy reform in the 1990s, including the introduction of an export tax rebate and currency stability, further encouraged soybean production. If market prices remain favourable, soybean production in Brazil and Argentina may continue to grow for the time being because both countries have still many potential areas to plant. However, some constraints are emerging as production expands. One such constraint is the increasing cost of transportation. Producers also face increasingly high marketing costs as production areas move into areas further inland. The continuation of large-scale mechanized farming is causing soil erosion in some areas, and increased cropping intensity is undermining natural soil fertility. Researchers and farmers are searching for more sustainable technologies and farming systems, including non-tillage cultivation and improved crop rotation. |
| ARGENTINA AND BRAZIL: SHARE IN GLOBAL PRODUCTION OF SOYBEANS |
||||
1969-71 |
1979-81 |
1989-91 |
1999-2001 |
|
| (Percentage) |
||||
| Argentina |
0.1 | 4.2 |
8.8 | 13.4 |
| Brazil |
3.5 | 15.7 |
18.4 | 20.4 |
| Both countries |
3.6 | 19.9 |
27.2 | 33.8 |
| Source: FAO. |
||||
|
ARGENTINA AND BRAZIL: SHARE IN VALUE OF GLOBAL EXPORTS OF SOYBEANS AND DERIVED PRODUCTS1 |
||||
1969-71 |
1979-81 |
1989-91 |
1997-99 |
|
|
(Percentage) |
||||
|
Argentina |
0.0 | 5.7 | 15.0 | 16.8 |
|
Brazil |
3.8 | 17.5 | 21.2 | 22.3 |
|
Both countries |
3.8 | 23.2 | 36.2 | 39.1 |
|
1 Soybeans, soybean cake, soybean oil. |
||||
The changes in composition and increasing diversification of agricultural exports are further highlighted in Table 20, which shows the relative share of the 15 most important agricultural exports in 1997-99. These products account for only about 60 percent of total agricultural exports, rather than almost 80 percent of the total accounted for by the 15 most important agricultural exports in 1970-72 .
|
Table
20 |
|
Export product |
(Percentage) |
|
Coffee, green |
13.8 |
Soybean cake |
7.6 |
|
Soybeans |
5.6 |
Bananas |
5.5 |
|
Sugar (centrifugal, raw) |
5.3 |
Soybean oil |
3.9 |
|
Crude organic materials (29) |
3.0 |
Tobacco leaves |
2.5 |
|
Maize |
2.5 |
Wheat |
2.5 |
|
Orange juice, concentrated |
2.3 |
Beef and veal, boneless |
2.3 |
|
Sugar, refined |
2.0 |
Oil of sunflower seed |
1.9 |
|
Food, prepared |
1.4 |
Total |
62.0 |
|
Source: FAO. |
|
| The developed market economies remain the major outlet for the region's agricultural exports. |
Most of the region's agricultural trade has traditionally been oriented towards industrialized country markets, which account for around 60 percent of agricultural shipments from, and over half of agricultural imports to, the region (Table 21).77
|
Table
21 |
||||
Destination |
1980 |
1990 |
1995 |
1997 |
(Percentage) |
||||
|
Developed countries |
60 |
66 |
64 |
63 |
|
European Union |
30 |
34 |
32 |
32 |
|
United States and Canada |
24 |
25 |
24 |
24 |
Developing countries |
20 |
27 |
33 |
33 |
Developing America |
10 |
12 |
17 |
18 |
Developing Africa |
3 |
4 |
3 |
3 |
Near East |
3 |
5 |
4 |
4 |
Asia and the Pacific |
4 |
6 |
9 |
9 |
|
Eastern European countries |
18 |
7 |
3 |
3 |
|
Source: UNCTAD. 2000. Handbook of Statistics 2000. Geneva. |
||||
In recent decades, however, the geographic distribution of trade has changed significantly. While the European Union (EU) and the United States have maintained their position as the main outlets for exports from Latin America and the Caribbean, the relative position of the developing countries has risen. On the other hand, following the process of economic transformation in the formerly centrally planned economies in the 1990s, Eastern European countries lost their status as major trading partners.
Similar patterns can be observed on the side of imports, with a more marked reduction in the relative share of developed countries, to the advantage of developing countries, as suppliers of agricultural products to the region (Table 22).
|
Table
22 |
||||
Origin |
1980 |
1990 |
1995 |
1997 |
|
(Percentage) |
||||
|
Developed countries |
70 | 61 | 57 | 56 |
|
European Union |
14 | 17 | 16 | 12 |
|
United States and Canada |
52 | 40 | 39 | 41 |
|
Developing countries |
26 | 34 | 41 | 42 |
|
Developing America |
22 | 28 | 37 | 38 |
|
Developing Africa |
1 | 1 | 1 | 1 |
|
Near East |
0 | 0 | 0 | 0 |
|
Asia and the Pacific |
4 | 6 | 9 | 9 |
|
Eastern European countries |
5 | 5 | 1 | 1 |
|
Source: UNCTAD. 2000. Handbook of Statistics 2000. Geneva. |
||||
The process of market diversification towards developing country markets has reflected to a certain extent the emergence of Asia and the Pacific as increasingly significant markets for the region. However, the driving force in this process was the considerable increase in intraregional agricultural trade that took place, especially during the 1990s, as a result of intensifying efforts towards regional integration. The share of intraregional trade in total agricultural trade rose between 1990 and 1997, from 12 to 18 percent in the case of exports and from 28 to 38 percent in the case of imports.
| Increasing importance of intraregional agricultural trade and of exports to Asia and the Pacific. |
The role of MERCOSUR was particularly important, given the size of the countries concerned and the degree of complementarity in several items of their product base. Tables 23 and 24 show that for Argentina, Brazil, Paraguay and Uruguay, the period between the mid-1980s and late 1990s was one of major geographic shifts in agricultural trade, in favour of other countries in the group. Argentina, for example, saw its share of agricultural exports destined for MERCOSUR partners rise from only 10-15 percent of the total in the 1980s to almost one-quarter in recent years. Similarly, the share of agricultural exports from Brazil to other MERCOSUR countries rose from negligible levels to almost 10 percent. The tendency towards intra-area trade concentration can also be observed in the case of agricultural imports, as shown in Table 24. Most remarkable was the increase in Brazil's share of imports from the area, from around 27 to 45 percent. In the cases of Paraguay and Uruguay, where agricultural trade was already heavily directed towards MERCOSUR country markets, this orientation was accentuated further during the period.
With agricultural exports exceeding agricultural imports by a considerable margin, the region has maintained a strong agricultural surplus position, even in periods of depressed markets for its main commodity exports (see Figure 27).
| Positive agricultural trade balances are largely accounted for by Argentina and Brazil, but most subregions have an agricultural surplus. |
Indeed, periods of depressed exports have closely coincided with contractions in agricultural imports, reflecting the region's strong reliance on export earnings from agriculture to finance imports, including of food.
The region's overall agricultural trade balance has largely reflected that of its major net exporters, Argentina and Brazil, where large surpluses have tended to widen further during the past decade. Argentina and Brazil together account for about half of the region's total agricultural exports, but less than one-quarter of its total imports. Nevertheless, surplus situations are typically found in most years throughout the region, notable exceptions being the Caribbean subregion, which has been a net agricultural importer since the early 1990s, and Mexico (see Figure 30).
|
Table 23 | |||||
Exporting country |
Destination | ||||
Argentina |
Brazil |
Paraguay |
Uruguay |
Total | |
|
(Percentage) | |||||
|
Argentina |
13.1 | ||||
|
1986 |
|
12.1 |
0.2 |
0.8 |
11.8 |
|
1990 |
|
11.0 |
0.3 |
0.5 |
21.3 |
|
1994 |
|
18.1 |
1.9 |
1.3 |
23.1 |
|
1998 |
|
19.9 |
1.6 |
1.6 |
|
|
Brazil |
|||||
|
1986 |
0.0 |
|
0.0 |
0.0 |
2.8 |
|
1990 |
0.5 |
|
0.4 |
1.0 |
1.9 |
|
1994 |
3.6 |
|
2.2 |
0.9 |
6.6 |
|
1998 |
4.8 |
|
3.1 |
1.6 |
9.5 |
|
Paraguay |
|||||
|
1986 |
13.5 |
42.3 |
|
2.3 |
58.2 |
|
1990 |
5.6 |
33.3 |
|
1.0 |
39.9 |
|
1994 |
4.1 |
47.4 |
|
0.8 |
52.3 |
|
1998 |
12.8 |
35.8 |
|
2.0 |
50.6 |
|
Uruguay |
|||||
|
1986 |
2.5 |
37.1 |
0.3 |
|
39.9 |
|
1990 |
2.0 |
30.3 |
0.2 |
|
32.5 |
|
1994 |
4.6 |
29.1 |
1.0 |
|
34.6 |
|
1998 |
8.2 |
44.9 |
6.3 |
|
59.4 |
|
Source: FAO. | |||||
The significance of the agricultural trade balances should be assessed with regard to, on the one hand, the economic importance of agricultural exports and, on the other hand, the financial cost involved in agricultural imports.
|
Table
24 |
|||||
Importing country |
Origin |
||||
Argentina |
Brazil |
Paraguay |
Uruguay |
Total |
|
|
(Percentage of total) |
|||||
|
Argentina |
31.8 | ||||
|
1986 |
21.7 | 6.7 | 3.4 | 34.9 | |
|
1990 |
23.6 | 8.0 | 3.4 | 37.0 | |
|
1994 |
31.8 | 1.4 | 3.9 | 34.8 | |
|
1998 |
27.3 | 3.2 | 4.3 | ||
|
Brazil |
|||||
|
1986 |
15.7 | 4.1 | 7.6 | 27.4 | |
|
1990 |
29.0 | 9.1 | 10.1 | 48.2 | |
|
1994 |
32.4 | 5.7 | 8.2 | 46.3 | |
|
1998 |
33.4 | 3.7 | 8.1 | 45.3 | |
|
Paraguay |
|||||
|
1986 |
12.9 | 20.2 | 2.3 | 35.4 | |
|
1990 |
13.2 | 19.9 | 1.7 | 34.8 | |
|
1994 |
31.0 | 14.5 | 3.5 | 49.1 | |
|
1998 |
19.5 | 49.3 | 7.7 | 76.5 | |
|
Uruguay |
|||||
|
1986 |
16.6 | 25.1 | 6.3 | 47.9 | |
|
1990 |
19.2 | 27.6 | 3.6 | 50.5 | |
|
1994 |
28.8 | 29.6 | 1.1 | 59.6 | |
|
1998 |
36.3 | 24.1 | 0.4 | 60.7 | |
|
Source: FAO. |
|||||
Table 25 presents a number of indicators illustrating these crucial aspects of agricultural trade. For the region as a whole, agricultural exports account for about 23 percent of total merchandise exports, down from 29 percent in the early 1980s, while agricultural imports have represented around 10-12 percent of total imports during the past three decades. Behind these averages, however, very different situations are found at the subregional and individual country levels.
| Agricultural trade is an important component of total trade. |
Although the region has considerably broadened its export base, particularly through the expansion of the volume of manufactured products, the share of agricultural exports in total merchandise exports has remained high - about 47 percent in recent years for the region as a whole, down from 70 percent in the early 1980s. Except for a few economies primarily based on oil and minerals, remittances or tourism, agricultural exports remain a major, if not the main, source of foreign exchange. This is true even for the more industrialized economies: agricultural exports represent around half of total exports in Argentina, 30 percent in Brazil, 32 percent in Colombia and 17 percent in Chile. The ratio exceeds 60 percent in several countries in Central America (Belize, Costa Rica, Guatemala, Nicaragua) and in Paraguay.
|
Table 25 |
||||
1979-81 |
1981-83 |
1989-91 |
1997-99 |
|
|
(Percentage) |
||||
|
Argentina |
||||
|
Agricultural exports/total exports |
69.9 | 69.6 | 56.7 | 46.7 |
|
Agricultural imports/total imports |
6.6 | 5.6 | 5.4 | 5.4 |
|
Agricultural imports/total exports |
7.0 | 4.4 | 2.7 | 6.2 |
|
Brazil |
||||
|
Agricultural exports/total exports |
44.3 | 40.8 | 26.9 | 29.6 |
|
Agricultural imports/total imports |
10.2 | 8.8 | 11.1 | 9.1 |
|
Agricultural imports/total exports |
12.0 | 8.3 | 7.5 | 10.9 |
|
Mexico |
||||
|
Agricultural exports/total exports |
12.8 | 6.9 | 11.3 | 10.0 |
|
Agricultural imports/total imports |
14.0 | 15.0 | 14.1 | 10.1 |
|
Agricultural imports/total exports |
18.4 | 11.7 | 17.9 | 12.4 |
|
Caribbean |
||||
|
Agricultural exports/total exports |
23.6 | 28.4 | 37.9 | 17.8 |
|
Agricultural imports/total imports |
9.7 | 10.8 | 15.3 | 13.0 |
|
Agricultural imports/total exports |
11.3 | 13.6 | 24.7 | 26.8 |
|
Central America, excluding Mexico |
||||
|
Agricultural exports/total exports |
71.9 | 69.6 | 64.4 | 49.1 |
|
Agricultural imports/total imports |
12.1 | 11.8 | 12.3 | 13.0 |
|
Agricultural imports/total exports |
17.3 | 17.9 | 20.4 | 23.9 |
|
South America, excluding |
||||
|
Argentina and Brazil |
||||
|
Agricultural exports/total exports |
14.8 | 13.9 | 16.8 | 19.7 |
|
Agricultural imports/total imports |
14.2 | 14.8 | 9.8 | 11.5 |
|
Agricultural imports/total exports |
12.1 | 13.0 | 7.4 | 12.7 |
|
Latin America and the Caribbean |
||||
|
Agricultural exports/total exports |
29.1 | 27.2 | 25.9 | 23.3 |
|
Agricultural imports/total imports |
11.5 | 11.9 | 12.2 | 10.2 |
|
Agricultural imports/total exports |
12.6 | 11.5 | 11.4 | 12.7 |
|
Source: FAO. |
||||
Many of these economies combine the seemingly paradoxical situation of being both agriculture-based and strongly dependent on agricultural imports. This is generally explained by the region's different structure of exports (chiefly non-food primary products, as seen above) and imports (primarily cereals). This form of agricultural specialization, which often accorded lower priority to producing food for domestic consumption, was expected to maximize the comparative advantages and competitiveness of the region and therefore contribute positively to current accounts. However, these expectations have not materialized in many periods and circumstances. Agricultural exports have been losing significance in national accounts, while the opposite has occurred for agricultural imports. Agricultural - basically food - imports have become increasingly important components of national diets, but the increases in food import bills have not always been matched by commensurate increases in foreign exchange.
Because of their immediate effect on export earnings and import bills, fluctuations in commodity prices have often been the determining factor in cycles of prosperity and depression in many economies in the region. For the region as a whole, the general tendency of agricultural export unit values (in current dollar terms) has been that of stagnation or decline since the early 1980s, punctuated by temporary upsurges such as those in the "commodity boom" periods of 1979-81 and 1995-97 (Figure 31).
| The region has compensated for declining prices of their agricultural exports by increasing export volumes. |
Despite such generally unfavourable price trends, the region has nevertheless been able to increase its export earnings from agriculture, more noticeably during the past decade, through a strong expansion in the volume of shipments. While the agricultural export unit value fell by about 10 percent between 1989-91 and 1999, the value of these exports increased by 50 percent during the same period.
These trends can also be observed at the individual commodity level. The comparatively steady growth in the volumes of exports, even during price crisis periods, confirms the premise that international market prices were determinant in agricultural export performances.
As noted earlier, the past two decades saw generally unfavourable price trends for the major tropical export products; relatively better price trends for cereals (bearing in mind that, with the notable exception of Argentina and Uruguay, most countries in the region are net cereal importers); and varying degrees of success in compensating for unfavourable price trends through gains in export volumes.
The economic importance of agricultural price movements is better assessed in relation to the prices of products imported by the region. Figure 32 shows two indices: barter terms of trade of agricultural exports (the ratio of the region's agricultural export unit value to manufactured good prices); and income terms of trade (the ratio of agricultural export value to manufactured good prices, or the purchasing capacity of agricultural exports).
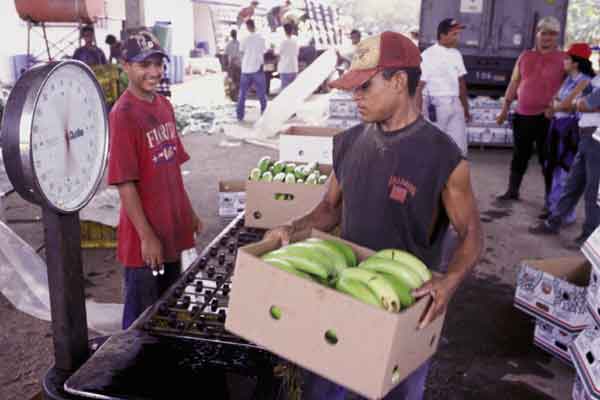
Packaging for export in Venezuela
Various aspects of preparing and packing plantains for export: weighing boxes of the fruits.
- FAO/20420/G. BIZZARRI
The general picture is one of stable barter terms of trade during the 1960s and early 1970s; a marked improvement during the food crisis periods of the mid-1970s; a long and deep deterioration from the mid-1970s through 1993, with some temporary rebounds, such as during the 1984 food crisis; and recovery in recent years. A more encouraging picture emerges regarding income terms of trade: although these followed a similar downward trend during the period 1985-92, they showed considerable improvement in other periods. Once again, this demonstrates the region's capacity to counter adverse price trends through expanded volumes of agricultural exports. Taking 1989-91 and 1999 as reference periods, agricultural prices were estimated to fall 6 percent below those of manufactured products; however, the volume of these exports rose almost 70 percent during this period. The resulting increase in export earnings from agriculture would have allowed the purchase of 56 percent more manufactured products.78
The various aspects of agricultural trade examined in this section have taken place against a policy environment characterized, especially since the mid-1980s, by increasing liberalization of trade and foreign exchanges. The new policy orientation has involved reduced public intervention and increased efforts to improve international competitiveness through a greater role of the private sector. Many countries replaced preferential or fixed exchange rates by managed crawling pegs or floating exchange rates. Average tariffs, and the degree of dispersion around them, were greatly reduced. Administrative and non-tariff barriers to trade were dismantled.
| The policy background to changes in agricultural trading patterns has been one of economic liberalization. |
This process was carried out despite the slow progress in the liberalization of agricultural trade and support policies on the part of many of the region's trading partners. Industrialized countries have maintained high levels of protection, particularly in agriculture.79 In addition to traditional tariff barriers, various non-tariff barriers to trade, such as sanitary and phytosanitary regulations, are increasingly important obstacles to the region's agricultural exports. High agricultural subsidies in the industrialized countries are also perceived as serving to erode the region's competitiveness in world markets.80
It was therefore in spite of significant constraints that the Latin America and Caribbean region has managed to expand the value and purchasing capacity of agricultural exports from the mid-1980s to the late 1990s. The revival can be credited to the region's new policy emphasis on free markets and its strenuous efforts to improve the countries' linkages with the world economies after the disappointing experience of previous inward-looking strategies. Much of the revival can also be attributed to the general strengthening of import demand from the region's main trading partners, fuelled in particular by an unusually long period of strong economic growth in the United States. Vice versa, the deteriorating trade performances of the region in recent years reflect to a major extent the economic slowdown in the industrialized countries, illustrating once again the dependence of the region's agricultural trade on external events beyond its control.
| Regional trading arrangements have played an important role but are facing major challenges. |
The renewed momentum of the region's agricultural trade between the mid-1980s and late 1990s also reflected the emergence or revitalization of regional trading agreements, following the example set by the European Community and the North American Free Trade Agreement (NAFTA) in the early 1990s. The phenomenon was rendered possible by the greater convergence of economic policies and political regimes within the countries of the region. Such convergence also produced, along with formal trading and cooperation agreements, a de facto integration that fostered intraregional trade and investment. The beneficial effects of this process also extended to agricultural trade, as seen in the case of MERCOSUR.
The region may have to face a number of major challenges in the years to come. It has been observed above that agricultural imports have tended to increase faster than agricultural exports, and the food import bill has become a major burden for many countries. This raises some fundamental issues: how to maintain a free-market, export-oriented agriculture without unduly penalizing domestic food production; how to assist the process of adjustment to import competition and improve domestic productivity and competitiveness without creating permanent mechanisms of protection. Whatever the courses countries choose, any trade-related policy should take into consideration the dangers of polarization or inequity. Sectors that are less able to take advantage of the broadened markets should be enabled to make the necessary adjustment through slower, but clearly established, mechanisms.
| There are still challenges ahead for regional agriculture and governments. |
Despite the progress achieved, the way towards fuller integration remains problematic. Past experience has shown (more recently in the case of MERCOSUR) the difficulties that may arise, in periods of economic stress, in reconciling regional objectives and national interests. The challenge for future years will be to maintain the momentum of integration and extend its benefits in a trade-creating and non-discriminatory manner across and within countries. Social equity is also a major consideration in this context. As suggested by the Economic Commission for Latin America and the Caribbean (ECLAC), social integration within countries should be sought as a complement to regional integration, through policies that reduce marginalization and ensure a more participatory pattern of international competitiveness.81
Finally, it has been seen that the product composition of trade is changing rapidly over time, with processed, differentiated and niche products growing in importance. This phenomenon, which is especially pronounced in the Latin America and Caribbean region, implies that the relevance of natural endowments in determining the export comparative advantage is progressively declining. It will be increasingly important, therefore, to direct policy action towards technology, management and marketing skills applied to a diversified range of products with greater value added. The public sector also has a significant role to play in creating a macroeconomic and regulatory environment that favours agro-industrial development while also streamlining credit markets and investing in marketing infrastructures, information and applied research.82
73Unless otherwise specified, macroeconomic estimates and projections in this section are drawn from IMF. 2001. World Economic Outlook, December. Washington, DC.
74 Latin American and Caribbean countries remain nevertheless significantly less dependent on food imports than most other developing countries; the agricultural/total imports share is currently around 25 percent in sub-Saharan Africa, 18 percent in the Near East and North Africa and 8 percent in Asia and the Pacific.
75 The share of developing countries as a whole in world agricultural exports has plunged from around 35 percent during the 1970s to 25 percent in recent years. Only Asia and the Pacific and Latin America and the Caribbean regions have been able to maintain or consolidate their position in world markets. The counterpart of the developing countries' reduction in market share has been a strong gain on the part of industrial countries, in particular the EU. Indeed, while in the early 1970s the EU(15) accounted for around 30 percent of world commodity exports, this share is now about 40-45 percent. Most of this increase reflects intensified trade among EU member countries. Excluding intratrade, however, EU(15) exports still represent 18 percent of the world total.
76 Although the focus of this review is on primary commodities, the diversification of the product base was more significant for products with greater value added (see FAO. 1997. The State of Food and Agriculture 1997. Rome, Special chapter). The chapter indicates that Latin America and the Caribbean's ratio of agro-industrial production to agricultural GDP was around 40 percent by the mid-1990s, compared with around 20 percent for the other developing country regions. A significant part of this production is for external markets. The region accounted for around 12 percent of the world's exports, and around 4 percent of imports, of industrially processed food products in 1994. The region has seen spectacular examples of agro-industrial development and trade expansion. For instance, the production of juices from tropical products in Brazil rose more than twentyfold between the mid-1980s and the mid-1990s. Chile's "case study" success as an export-oriented agricultural industry was based not only on fresh fruit but also on the development of processed products such as wine and food preserves. Argentina's food-processing industry has a long-established tradition; the Bunge y Born cereal transformation multinational is one of the largest in the world.
77 The dependence on industrialized country markets, especially the United States, is even more marked for non-agricultural products. About 70 percent of all merchandise exports from Latin America and the Caribbean are destined for industrialized countries; nearly half of the region's total exports go to the United States.
78 A more thorough analysis of long-term trends in agricultural terms of trade will be found in a forthcoming publication prepared for FAO by Prof. George P. Zanias: The evolution of primary commodity terms of trade and the implications for developing countries. This study confirms the tendency for net barter agricultural terms of trade to deteriorate in all developing country regions since the early 1980s, but also confirms the gains in purchasing capacity achieved by agricultural exports, especially since the late 1980s - a feature attributed mainly to export diversification.
79 Average tariff protection in agriculture in the industrialized countries is about nine times higher than in manufacturing.
80 See, for example, OECD. 2001. Agricultural policies in OECD countries. monitoring and evaluation. Paris. The report states: "Despite some shift away from market price support and output payments, these continue to be the dominant forms of support in most countries, insulating farmers from world market signals and distorting global production and trade."
81 ECLAC. 1994. Latin America and the Caribbean: Policies to improve linkages with the global economy. Santiago, Chile.
82 These issues have been discussed in detail in various sections and special chapters of The State of Food and Agriculture. See in particular: 1995, Agricultural trade: entering a new era?; 1997, The agroprocessing industry and economic development; 2001, The future of the agricultural trading environment: issues in the current round of negotiations on agriculture.
![]()
![]()
![]()