![]()
![]()
![]()
U. Tietze and R. Lasch
The studies carried out in 2002 and 2003 show that all 94 types of fishing vessels covered had a positive gross cash flow and fully recovered their operating costs, with no losses. When also considering capital costs, i.e. the costs of depreciation and interest, 88 of the 94 types of vessels or 94 percent showed a net profit after deducting the costs of depreciation and interest.
To assess the economic and financial performance of fishing vessels, two indicators were used. The economic performance was measured by the net cash flow (NCF), which is equal to the net profit. This was calculated as the value of landings minus all costs including the costs of depreciation and imputed interest. The NCF or net profit can be seen as the reward for entrepreneurship and expresses the absolute income of the entrepreneur or owner of the vessel. Another closely related indicator of economic performance is the NCF/total earnings (TE) ratio, which expresses the NCF or net profit as a percentage of TE. A ratio of more than 10 percent can be considered as good.
The financial performance was measured by the NCF/investment ratio, also referred to as rate of return on investment (ROI). A level of 10 percent is generally considered to be a good result. The NCF or net profit expressed as a percentage of the invested capital indicates the profitability of the investment in relation to other alternative investments. The book value of the fishing vessel based on the replacement value of the vessel has been used as a measure for the invested capital. In a number of cases, the insured value of a vessel has been taken as an indicator for the invested capital. The value of fishing rights linked to a particular vessel has not been included.
Between 2002 and 2003, 66 and 64 percent respectively of the 94 types of fishing vessels covered by the study had good financial and economic results; 41 and 38 percent respectively of all types of vessels even managed to attain very good financial and economic results, having achieved ROIs and NCF/TE ratios of more than 20 percent. The best results were those of South Africa and the Republic of Korea, largely because of abundant and nearby resources in the first case and the positive effects of fisheries management and limitation of fishing fleet capacity in the latter case. Good and very good results were achieved by both inshore and offshore vessels and by small-scale, medium-scale and large-scale vessels.
Figure 1 shows the financial and economic performance of the various types of fishing vessels studied.
When comparing the fishing fleets of countries studied in both 1999 to 2000 and 2002 to 2003, significant improvements in financial and economic performance can be seen in the Republic of Korea, Germany and Argentina, partially because of reduction and limitation of fleet capacity. In the other countries covered by the study, the overall picture remained similar with some fleets improving their performance and others achieving less favourable results.
TABLE 1
Indicators regarding financial and economic
performance
| |
NCF |
ROI |
|
Europe (coastal fisheries) |
|
|
|
Germany, coastal cutter 10-15 m |
25 900 |
9 |
|
Germany, shrimper 15-20 m |
126 400 |
14 |
|
France, handliner 8-10 m |
15 600 |
26 |
|
France, gillnetter 10-12 m |
8 600 |
8 |
|
France, coastal trawler 15-18 m |
9 200 |
2 |
|
Norway, gillnet handline 10 m |
7 800 |
31 |
|
Norway, Gillnet handline 15 m |
14 300 |
12 |
|
Norway, line north Norway 10 m |
5 400 |
18 |
|
Norway, line north-Norway 15 m |
22 500 |
38 |
|
Norway, coastal south Norway 10 m |
2 400 |
6 |
|
Norway, coastal south Norway 15 m |
15 300 |
8 |
|
Norway, coastal purse seiner 25 m |
120 200 |
10 |
|
Norway, shrimp trawler 10 m |
2 600 |
5 |
|
Norway, shrimp trawler 15 m |
-9 300 |
Negative |
|
Europe (offshore fisheries) |
|
|
|
Norway, factory trawler 65 m |
121 200 |
3 |
|
Norway, fresh fish trawler 47 m |
250 000 |
13 |
|
Norway, pout trawler 35 m |
-11 200 |
Negative |
|
Norway, Danish seiner 18 m |
34 300 |
32 |
|
France, deep-sea trawler 17-19 m |
-20 900 |
Negative |
|
France, deep-sea trawler 20.5 - 24 m |
22 400 |
3 |
|
France, deep-sea trawler 28-33 m |
59 200 |
5 |
|
France, deep-sea trawler 50-54 m |
399 500 |
20 |
|
Germany, trawling cutter 15-22 m |
10 600 |
1 |
|
Germany, trawling cutter 22-30 m |
60 100 |
3 |
|
Germany, pelagic trawler 90-120m |
5 662 700 |
25 |
|
Germany, groundfish trawler 60-90 m |
-109 200 |
Negative |
|
Africa (small-scale fisheries) |
|
|
|
Senegal, gillnetter 15 m |
-800 |
Negative |
|
Senegal, handline 18 m |
600 |
9 |
|
Senegal, canoe 8 m |
1 500 |
21 |
|
South Africa, rock lobster |
18 700 |
17 |
|
Africa (medium-/large-scale fisheries) |
|
|
|
Senegal, purse seiner 18 m |
9 100 |
31 |
|
Senegal, trawler 22 m |
-92 000 |
Negative |
|
South Africa, squid 60 foot (18.29 m) |
184 700 |
39 |
|
South Africa, squid 45 foot (13.7 m) |
127 200 |
40 |
|
South Africa, hake longline |
99 000 |
58 |
|
South Africa, pelagic 200-300 t |
622 800 |
24 |
|
South Africa, pelagic 100-200 t |
242 300 |
17 |
|
South Africa, pelagic 50-100 t |
133 500 |
23 |
|
South Africa, large hake freezer |
1 747 700 |
31 |
|
South Africa, small hake freezer |
680 900 |
29 |
|
South Africa, large hake trawler |
659 300 |
27 |
|
South Africa, small hake trawler |
481 900 |
28 |
|
Caribbean (small-scale fisheries) |
|
|
|
Barbados, day boats 8 m |
12 600 |
56 |
|
Barbados, ice boats 13 m |
7 300 |
8 |
|
Barbados, open boat 7 m |
31 200 |
21 |
|
Antigua, cabin boat 7 m |
5 800 |
29 |
|
Antigua, sloop 10 m |
-5 200 |
Negative |
|
Antigua, launch 11m |
22 800 |
38 |
|
Antigua, launch 12 m |
30 150 |
41 |
|
South America (medium-/large-scale fisheries) |
|
|
|
Argentina, Trawler 25 m |
141 200 |
18 |
|
Argentina, Trawler 30 m |
294 500 |
25 |
|
Argentina, Trawler 35 m |
564 400 |
28 |
|
Peru, purse seiner 26 m |
95 800 |
7 |
|
Peru, purse seiner 25 m |
120 600 |
6 |
|
Peru, purse seiner 38 m |
362 300 |
16 |
|
Peru, trawler 17 m |
8 700 |
1 |
|
Trinidad, longliner 14-24 m |
15 100 |
10 |
|
Asia (small-scale fisheries) |
|
|
|
India, non-motorized 5.5 m |
1 000 |
163 |
|
India, motorized 8.5 m |
1 600 |
61 |
|
India, dolnetter 9-12 m |
3 700 |
61 |
|
India, stern trawler18 m |
5 100 |
17 |
|
Asia (medium-/large-scale fisheries) |
|
|
|
India, outrigger 13 m |
-2 100 |
Negative |
|
India, purse seiner 18 m |
1 900 |
3 |
|
India, tuna longliner 36 m |
1 007 400 |
27 |
|
Rep. Korea, stow netter |
54 000 |
18 |
|
Rep. Korea, jigging |
11 100 |
3 |
|
Rep. Korea, Eastern Sea trawler |
139 100 |
60 |
|
Rep. Korea, purse seiner |
1 895 600 |
37 |
|
Rep. Korea, anchovy drag net |
296 600 |
26 |
|
Rep. Korea, otter trawler |
572 700 |
32 |
|
Rep. Korea, pair trawler |
447 400 |
59 |
|
Rep. Korea, Danish seiner |
118 700 |
61 |
|
Rep. Korea, west southern Danish seiner |
107 400 |
34 |
|
Rep. Korea, eastern Danish seiner |
62 100 |
29 |
|
Thailand, otterboard <14 m |
1 400 |
17 |
|
Thailand, otterboard 14-18 m |
5 100 |
18 |
|
Thailand, otterboard 18 - 25 m |
12 600 |
19 |
|
Thailand, pair trawl 14-18 m |
2 700 |
7 |
|
Thailand, pair trawl 18-25 m |
34 300 |
33 |
|
Thailand, push net <14 m |
100 |
2 |
|
Thailand, push net 14-18 m |
200 |
1 |
|
Thailand, push net 18-25 m |
6 100 |
7 |
|
Thailand, purse seine 14-18 m |
6 900 |
8 |
|
Thailand, purse seine 18-25 m |
37 800 |
29 |
|
Thailand, Anchovy <14 m |
7 400 |
82 |
NCF: Net Cash Flow; ROI: Return of Investment.
The overall sustained positive earnings situation in 2002 and 2003, as compared with 1999 and 2000, is to be seen against the background of an increase in fuel prices, an important cost component of capture fisheries, of about 9 percent[7] between the two reporting periods, and of a decline in fish prices of up to 5 percent globally.
As far as catch levels are concerned, since 1999-2000 catches increased in six of the 13 countries studied in 2002, in South Africa, Argentina, Trinidad and Tobago, Antigua and Barbuda, Norway and India. In four countries, Peru, Senegal, Barbados and the Republic of Korea, catches declined between 1999-2000 and 2002. Catch levels remained similar in Thailand, Germany and France.
When comparing performance in different regions of the various types of fishing vessels using disparate fishing methods, the trends described in the following paragraphs can be observed (see Table 1).
Coastal European fishing vessels achieved better financial and economic results than offshore vessels. The following all had good or very good results: coastal Norwegian purse seiners catching herring, cod, mackerel, saithe and other species; Norwegian gillnetters and boats using handlines and longlines for catching cod, saithe, haddock, redfish, monkfish and other species; and small north Norwegian coastal vessels using lines to catch cod, haddock, Greenland halibut, crab, ling and other species. The same good results were noted for French handline vessels catching sea bass, pollack, whiting, mackerel, conger eel and other species; and for German coastal cutters and shrimp vessels using beam trawls and targeting flatfish species such as plaice, flounders, sole, shrimps and other species.
The smallest type of coastal Norwegian shrimp trawlers, fishing boats operating along the southern coast of Norway landing cod, monkfish, herring, saithe, mackerel and other species, and coastal trawlers landing Norway lobster, monkfish, hake, megrim, skate and other species continued to achieve moderately good economic and financial results. Similar results were seen by coastal French gillnetters catching monkfish, pollack, hake, spider crab, conger eel and other species. The only group of fishing vessels that showed negative results was the 15-metre long coastal Norwegian shrimp trawlers.
As mentioned above, the financial and economic situation of the European offshore fishing vessels studied was less favourable than that of coastal vessels. Three types of vessels had negative results: the smallest French deep-sea trawlers landing Norway lobster, monkfish, hake, megrim, skate and other species; Norwegian pout trawlers landing herring, sand eel, blue whiting, saithe and other species; and large German bottom trawlers catching cod, redfish, Greenland halibut and others, including some pelagic species.
Four types of European offshore fishing vessels had moderately good results: Norwegian factory trawlers landing cod, saithe, redfish and other species; mediumsize French deep-sea trawlers catching monkfish, cod, haddock, whiting, skate, saithe, roundnose grenadier and other species; and smaller and medium-size German trawling cutters landing saithe, cod, haddock, herring and other species.
Only four types of European offshore fishing vessels achieved very good and good financial and economic results: large German pelagic trawlers landing herring, mackerel, horse mackerel, blue whiting and other species; large French deep-sea trawlers catching saithe, roundnose grenadier, plaice, black cutlass fish, cod and other species; Norwegian Danish seiners landing cod, haddock, saithe, herring and other species; and Norwegian fresh fish trawlers catching cod, saithe, haddock, shrimps and other species.
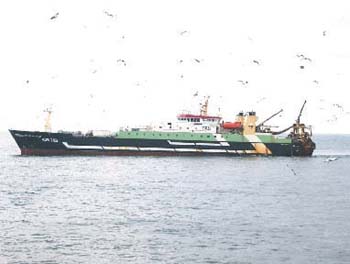
Pelagic trawler, Germany
U. RICHTER
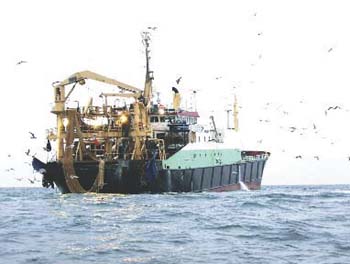
Pelagic trawler, Germany
U. RICHTER
Offshore fishing fleets had overall better financial and economic results than the smallscale fishing boats studied in Senegal and South Africa. In general, the South African fishing vessels had markedly better results than the Senegalese ones, partly because of the richer fishing grounds exploited in South Africa in terms of availability of commercially important and valuable species.
Four types of small-scale fishing vessels were studied in Senegal and South Africa. The South African small-scale rock lobster fishing boats and the Senegalese multipurpose canoes fishing for cutlass fish, small tuna, grunt and other species performed very well while the Senegalese handline vessels catching snappers, sea bass, jacks and horse mackerel had only moderate results. The Senegalese surrounding gillnet boats landing sardinella, bonga and other species even had negative results, probably because of overexploited resources and competition from purse seiners.
As far as offshore fishing vessels are concerned, Senegalese purse seiners catching sardinella, mullets, small tuna and other species had very good financial and economic results. So did all South African offshore fleets studied, including various types of squid jigging vessels; longliners catching hake, squid, kingklip and other species; bottom trawlers catching mainly hake; and purse seiners and pelagic trawlers landing mainly pilchard, anchovy and round herring. The only negative results were those of Senegalese trawlers landing croakers, breams, horse mackerel, shrimps and other species. These trawlers already had negative results at the time of the previous study.
With the exception of the 10-metre Antigua and Barbuda sloop, all other Caribbean small-scale fishing vessels achieved very good or good financial and economic results. Very good results were achieved by the Barbadian day boats using gillnets, handlines and trolling lines to catch flying fish and dolphin fish as well as large pelagics such as wahoo, billfishes, tunas and sharks. The larger Barbadian ice boats using the same fishing methods to catch the same species only achieved moderately good results because of the greater costs of operation. The cabin boats and launches of Antigua and Barbuda using traps to catch spiny lobster, queen conch, snappers, groupers, parrotfish and other reef fish all had very good results.
The longliners of Trinidad and Tobago, which range from 14 to 24 metres and catch mainly tuna and swordfish - and occasionally also dolphinfish, marlin, shark and wahoo - performed well.
The three size classes of Argentine bottom trawlers fishing for hake similarly had very good financial and economic results.
The three size classes of Peruvian purse seiners also fishing for hake achieved generally good and moderately good results while Peruvian trawlers achieved only very modest ones.
The four types of Indian small-scale and coastal fishing boats all achieved very good financial and economic results. By far the best results were those of the non-motorized and motorized log rafts (locally called kattumarams), because of their low investment and operating costs. These craft use gillnets and lines and catch a great variety of pelagic and demersal fish. Dolnetters using bag nets for catching ribbon fish, catfish, shrimps, Bombay duck and other species also achieved very good results. Small stern trawlers catching squid, prawns, ribbonfish, catfish, pomfret, lobsters, ghols, eels, crabs and other species also achieved ROIs and NCF/TE ratios of more than 10 percent.
Eight of the nine fishing fleets studied in the Republic of Korea had very good financial and economic results. These fleets include Eastern Sea trawlers, targeting mainly squid and flounders; purse seiners, targeting mainly mackerel and squid; anchovy dragnetters, targeting mainly anchovy; otter trawlers, targeting mainly squid and hairtail; pair trawlers, targeting mainly hairtail and Spanish mackerel; Danish seiners, targeting mainly croakers and flounders; west Southern Sea Danish seiners, targeting mainly flounders and shrimps; and Eastern Danish seiners, targeting mainly flounders and sand fish.
Jigging vessels targeting squid had ROIs and NCF/TE ratios of less than 10 percent.
Of the Thai fishing vessels included in the study, three achieved very good results. These were the smaller boats using falling nets to catch anchovy, and larger pair trawlers catching a wide variety of species such as threadfin bream, lizard fish, big-eye tuna, snapper, sand whiting, catfish, flatfish, groupers, shrimps, squid, sharks, croakers, barracuda, pomfret and other species. Otterboard trawlers of various sizes targeting the same species still had ROIs between 17 and 19 percent.
However, small pair trawlers and all three size classes of pushnetters included in the study catching shrimps, squid, anchovy and a variety of smaller species and juveniles had ROIs and NCF/TE ratios of much less than 10 percent.
W. Thiele
Norway
Fishing areas
Norwegian fisheries work mainly in the Norwegian exclusive economic zone (EEZ) and in the Svalbard zone (FAO major fishing area 27). Most of the fleets have a catch composition consisting of several species. The smaller coastal vessels such as shrimp trawlers and smaller netters and liners generally operate close to their home ports.
Barents Sea. The Barents Sea is a shelf sea, mostly less than 300 metres deep. The area is highly productive and maintains large pelagic fish stocks, which support large stocks such as cod on higher trophic levels. Factory and fresh fish trawlers operate mainly in the Barents and Norwegian Sea, targeting cod and haddock.
Norwegian Sea and coastal areas. These areas are also part of the continental shelf around Norway, and are generally less than 500 metres deep. Variations in currents can have substantial impact on the growth and recruitment of fish stocks. However, there is great potential for the production of plankton, supporting large pelagic stocks such as the spring-spawning Norwegian herring.
North Sea and Skagerrak. These areas consist mainly of shallow waters - two-thirds are less than 100 metres deep. The shallow depth and mixing of water make the area highly productive, supporting pelagic stocks such as herring, mackerel, pout, sprat and sand eel. Pout trawlers generally operate in the North Sea, catching sand eel and blue whiting, but also catch herring along the coast and capelin in the Barents Sea.
Fishing fleet
In Norwegian vessel statistics and in the relative survey only vessels operating "all-year" are considered. Generally this means that vessels are actively involved in fishing for more than 30 weeks per year. The total fleet consists of 5 423 vessels (vessels with fishing licences), but only 2 199 operate all year. The age structure of the fishing fleet has increased, compared with the situation in 1990. Only large coastal vessels between 21 and 28 metres in length (mostly purse seiners and fresh fish trawlers) have a healthy reinvestment rate.
Recognizing the existing overcapacity in the fishing fleet, the Norwegian Government took action to establish a balance between available resources and fishing capacity. The measures include trial fisheries and market tests from non- or underutilized resources such as roughhead grenadier (Macrourus berglax) in the Barents Sea and for deep-sea fisheries west of the United Kingdom catching Greenland halibut (Reinhardtius hippoglossoides), common mora (Mora moro), other white fish and various shark species.
In an effort to utilize resources lower in the food chain, scientists are working on a project to develop and evaluate methods to capture large quantities of zooplankton (especially Calanus finnmarchicus) by trawl. This could yield resources for fish-feed production and other industry raw materials. Other measures to reduce capacity are a decommission programme supported by grants and time-limited transferable quotas.
Germany
Generally speaking, the German fishing fleet is made up of:
coastal fisheries (open or partially covered boats);
cutter fisheries (covered vessels fishing in the Baltic and North Sea);
trawler deep-sea fisheries (factory ships fishing in distant waters); and
other specialized fisheries (e.g. for mussels) fishing in coastal waters.
In accordance with the objectives of the multiannual guidance programme (MAGP) of the European Union (EU), the number of fishing vessels has been reduced. In 2002 the fleet consisted of 2 250 vessels, ranking from open boats under 12 metres in length (1 695 boats) to large factory trawlers operating on the high seas. By number and by capacity indicators, summarized engine power, expressed in kW and summarized tonnage (GT), the German fleet is one of the smallest in the EU.
Table 2 shows that the majority of vessels in the most important fleet segments (coastal boats, cutter trawlers and shrimpers) are more than 20 years old.
The most important operational areas for the German fleet are the North Sea and the Baltic Sea. Nearly 50 percent of the quotas allocated for Germany come from these areas. The major part of the catches of the deep-sea trawlers comes from EU waters, but there are also fishing activities in Norwegian waters, off the coasts of Greenland and Mauritania and outside economic zones (Northwest Atlantic Fisheries Organization [NAFO] and North East Atlantic Fisheries Commission [NEAFC] areas). Most of the fish stocks exploited by the German fleet are managed within the framework of the Common Fisheries Policy (CFP) of the EU.
TABLE 2
Age structure of the German fishing fleet,
2002
|
Years |
0-5% |
6-10% |
11-15% |
16-20% |
21-25% |
>25% |
Average age |
|
Coastal fisheries |
|
|
|
|
|
|
|
|
Vessels <12 m |
7.7 |
7.1 |
12.4 |
19.0 |
16.7 |
37.1 |
23.0 |
|
Vessels >12 m |
- |
4.0 |
- |
- |
- |
96.0 |
43.0 |
|
Cutter fisheries |
|
|
|
|
|
|
|
|
Trawlers |
3.8 |
3.1 |
6.9 |
20.0 |
4.6 |
61.5 |
34.2 |
|
Beamers |
- |
14.3 |
14.3 |
28.6 |
14.3 |
28.6 |
19.3 |
|
Shrimpers |
1.0 |
4.9 |
9.4 |
12.2 |
16.8 |
55.6 |
26.6 |
|
Deep-sea fisheries |
|
|
|
|
|
|
|
|
Pelagic trawlers |
- |
33.3 |
33.3 |
33.3 |
- |
- |
12.0 |
|
Groundfish trawlers |
- |
10.0 |
50.0 |
10.0 |
10.0 |
20.0 |
14.9 |
Source: BLE, Hamburg, Germany.
France
Despite the fact that the size of the fishing fleet is not directly regulated by the French Government, in accordance with the rules of the CFP, France has had to adapt its fishing effort in line with the objectives of MAGP. This has led to a drastic reduction in the number of fishing vessels over the last 12 years. There were 8 658 vessels in 1990, 6 829 in 1996, 5 974 in 1997 and 3 396 in 2002, constituting a reduction of more than 50 percent in 12 years.
As regards the age structure of the French fishing fleet, it can be seen that the average age of fishing vessels has increased over the years. Over 50 percent of all vessels are more than 20 years old. The only exceptions are the 20-24 and 28-33 metre deep-sea trawlers where more than 30 percent of the vessels are ten to 15 years old.
The French fleet (mainland and overseas departments) operates worldwide, but the main part of the catch is from European waters. Nearly 30 percent of fish landed are caught in the French EEZ, whereas 50 percent are caught in European waters and the remaining percentage comes from international waters or is caught under bilateral agreements with other coastal states.
Within the framework of the CFP the French Government is implementing new management and regulation measures in the following fields.
Resource management. The target total allowable catch (TAC) will be fixed on a multiannual basis, in order not to destabilize socio-economic balances in the fishing industry. However, emergency measures (closure of areas and time limitation) may be introduced where, for example, species are considered to be endangered. Technical measures (gear regulations, effort control) are at an experimental stage and will be considered in the near future.
Renewal of the fishing fleet. In order to replace an old vessel by a new one the engine power must be 35 percent lower. Additional scrapping of vessels will be subsidized until 2006.
Improvement in scientific advice. Regional advisory councils (RACs) will be established for the different fishing zones. These RACs will bring together scientists in the fishing industry and will cooperate closely with the Advisory Committee for Fisheries Management of the European Commission.
Senegal
In 2002 the Senegalese fleet consisted of about 9 000 units. These were mostly non-decked, outboard-engine powered wooden canoes of 16 to 18 metres in length. Approximately 80 percent of the canoes are multipurpose, which means that different gears such as gillnets, handlines, traps/pots and purse seines are used, according to fishing grounds and season. Compared with the previous study carried out in Senegal, the number of canoes has further increased, whereas the number of industrial trawlers has decreased. Where in 1997 the fleet consisted of 281 trawlers, in 2002 only 142 were operating. These trawlers target mainly demersal species, shrimps and cephalopods.
The trawlers are all fairly old in that 40 percent are more than 20 years old, 30 percent between 15 and 20 years old and 25 percent between 10 and 15 years old. Since 1987 some restrictions on vessel sizes and fishing gears have been in force. Vessels of >1 500 GT are not allowed, the mesh size of trawls has been defined and a minimum landing size of fish has also been introduced. Industrial vessels are not permitted to fish within a zone of 6 nm from the shore. They have to have a fishing licence and pay a licence fee.
TABLE 3
Characteristics of the South African fishing
fleet
|
Fleet |
Type of vessel |
Size of vessel |
No. of vessels |
Fishing gear |
Target species |
Important by-catch |
|
Deep-sea trawl |
Wet fish or freezer trawlers |
29- 90 m |
64 |
Demersal trawl nets |
Hake |
Kingklip, monkfish |
|
Pelagic |
Ice or non-ice trawlers |
15-36 m |
68 |
Purse-seine nets |
Pilchard, anchovy |
Red-eye round herring |
|
Demersal longline |
Wooden or GRP trawlers |
15-30 m |
45 |
Demersal longlines |
Hake |
Kingklip, monkfish |
|
Squid |
Ski boats and deck boats |
6-22 m |
140 |
Landline jig |
Chokka squid |
- |
|
West coast rock lobster |
Dinghies, ski boats, deck boats and trap boats |
3.5-21 m |
292 |
Hoop nets, lobster traps |
West coast rock lobster |
- |
In order to reduce the growing fishing effort, the Government foresees the introduction of a licence system for small-scale fishers as well as effort restrictions for industrial vessels (closure of areas, time restrictions).
South Africa
South African fisheries range from large-scale industrial trawl and purse-seine operations to smaller-scale commercial and recreational fisheries. Artisanal activities are also practised (e.g. beach seining, white mussel harvesting). In this report, five commercial fisheries were selected to represent the fishing industry sector. These fisheries comprise the deep-sea trawl, pelagic, demersal longline, squid and West coast rock lobster sectors.
The deep-sea trawl industry is still the most economically important fishery in the South African fishing industry. It primarily targets deepwater hake (90 percent) but also comprises a by-catch of lucrative species such as kingklip and monkfish.
The pelagic fishing industry targets anchovy and pilchard with occasional catches of red-eye round herring. The fishery is the largest in South Africa, based on volume, and most of the catch is processed for fishmeal. The fleet comprises relatively small (15-30 metres, 50-400 GT) wooden or steel-hulled purse-seine vessels.
The demersal longline vessels can be divided into two groups on the basis of size; generally, vessels smaller than 20 metres are traditional wooden-hulled trawler-type fishing boats, while larger vessels (20-30 metres) are made of fibreglass or steel. The larger vessels are equipped with line haulers and about 50 percent have freezers.
Squid were first targeted commercially in 1984, and were originally caught by handlines from ski boats (3-5 metres). The larger decked boats are equipped with strong lights to attract the squid and they use jigger machines.
The rock lobster fleet comprises a wide variety of boats but they all use traps to catch the lobsters.
The operational area for the South African fleets is their own EEZ. The fleets are ageing - over 60 percent of vessels are more than 20 years old.
Argentina
Fishing fleet
The fleet can be grouped into three broad categories according to size, range and operational mode: coastal or inshore vessels, ice trawlers and processing vessels. This last group consists of freezer trawlers, shrimp trawlers, surimi boats, longliners, scallop boats, jiggers and factory vessels. The main characteristics of each fleet are the following.
Inshore fleet. The artisanal fleet is made up of boats ranging from 10 to 17 metres in length. They have limited holding capacity (4-14 tonnes) and do not possess any cooling equipment. The bulk of artisanal landings, mostly fresh, is targeted for the local market and for canneries and salting plants. Fishing trips usually last for one day and are family operated.
The coastal inshore fleet is technologically more advanced than the artisanal fleet. It consists of boats ranging from 17 to 25 metres in length and they possess larger (18-40 tonnes) refrigerated holds. Fishing trips last from one to 12 days.
Ice trawler fleet. This fleet is composed of trawlers ranging from 25 to 63 metres in length. They possess refrigerated holds and the fish are preserved in ice. The fleet provides chilled products to processing plants onshore. Ice trawlers are mainly dedicated to catching Argentine hake.
Processing fleet. The processing fleet consists of freezer and factory (with fishmeal plants); surimi, scallop and shrimp trawlers; jiggers and longliners. Trawler size varies depending on the resource exploited. There are small trawlers of 30-42 metres in length up to larger ones of 70 metres.
In total the fleet consists of 766 units. The main group by numbers is that of artisanal vessels (200), followed by ice trawlers (141) and jiggers (112). The latter specialize in squid and belong to the group of processing vessels. Most of the vessels are trawlers, followed by gillnetters and squid jiggers.
Nearly all the fishing areas are in Argentina's own EEZ because of the extremely productive wide Patagonian shelf. The main species caught are Argentine hake (about 350 000 tonnes), squid (175 000 tonnes), Patagonian grenadier (98 000 tonnes) and southern blue whiting (42 500 tonnes). Also of importance are the shrimp landings (Argentine red shrimp) (49 000 tonnes).
The fisheries are managed by an individual transferable quota (ITQ) system and the positions of vessels are controlled by a vessel monitoring system (VMS). Each vessel must have a licence.
To protect juvenile fish and reduce by-catch, the use of by-catch reduction devices is mandatory in the hake trawl fishery as well as in the shrimp fisheries.
Peru
In terms of volume of catch, Peru is one of the leading countries in the world and one of the largest producers of fishmeal.
The fishing fleet consists of both wooden and steel vessels and is specialized to catch small pelagics (anchoveta, sardines) with purse seines. In 2003, 782 steel vessels were registered, of which 686 fulfilled the requirement for a fishing licence. In the same year, 527 wooden vessels were operational.
Permission to fish is species related; 553 of the steel vessels and nearly all the wooden vessels target small pelagics for fishmeal production.
The Peruvian fleet is fairly old - over 50 percent of the steel vessels are more than 30 years old. Fisheries regulations and legislation rule that industrial and semi-industrial vessels must operate beyond the 5 nm limit from the shore. Mesh size regulations for purse seines as well as for hake trawls exist and minimum landing sizes for the main species have been introduced.
Trinidad and Tobago
There are about 1 570 fishing vessels in the national fleet. Of these, 1 491 are artisanal vessels operating in inshore coastal waters, 35 are semi-industrial multigear vessels operating in inshore and offshore areas and 25 are industrial vessels operating off the west and south coasts of Trinidad. Total annual landings for the fisheries of Trinidad and Tobago for the period 1999/2000 are estimated at 14 000 tonnes with an ex-vessel value of US$21 million.
The present study of techno-economic performance of the fishing fleet is focused on the semi-industrial longline fishery. The longline fleet is characterized by a single category of semi-industrial vessels ranging from 14 to 24 metres in length with diesel engines of 160-400 HP. These vessels are equipped with fish finders, global positioning system (GPS), communication equipment and hydraulic equipment for setting and retrieval of gear. The fleet operates in the EEZ of Trinidad and Tobago and in the Western Central Atlantic, area 31 of the FAO major fishing area coding system.
The longline fishery targets tunas and swordfish. Dolphin fish, marlins, sharks and wahoo are considered by-catch.
The age structure of the longline fleet is "healthy" in that 40 percent of the vessels are under ten years old and 40 percent are between ten and 15 years old. There is no legislation specific to the operations of this open access fishery and there are no regulations specific to the gear, fishing areas or seasons in which the fishing takes place. In keeping with national responsibilities as a member of the International Commission for the Conservation of Atlantic Tunas (ICCAT), management of the fishery is based on informal implementation of ICCAT conservation and management measures for the target species.
As far as development of these fisheries is concerned, there are some alternative opportunities for the longline fleet, but only if vessels are re-equipped for other forms of fishing. The Government is attempting to negotiate a bilateral agreement with Guyana for access to the snapper fishery off the Guyana shelf. A number of vessels that originally formed part of the trawl fleet have been retooled for the trap fishery, which is geared to supply an export market for red snapper. The status of stock data for the deepwater demersal species is limited, but the biology of the species and the results of studies of similar fisheries in the region[8], [9] suggest that the potential for development of these fisheries is limited and should be carefully monitored.
Barbados
Flying fish (mainly Hirundichthys affinis) and dolphin fish (Coryphaena hippurus) account for the two largest portions of the annual fish catches of Barbados and are approximately 59 and 25 percent, respectively. The main part of the island's annual catches of flying fish and dolphin fish are landed by the ice boat (80 and 85 percent, respectively) and day boat fleets (17 and 9.5 percent, respectively).
The traditional day boat has a wooden hull made of planks (usually pine) mounted on a frame (keel and ribs) traditionally made of greenheart or mahogany and driven by an inboard diesel engine. Over the last decade, a number of fibreglass-hulled vessels (often slightly smaller than the typical day boats) powered by outboard engines have entered the fleet.
Longline vessel, Trinidad
FISHERIES DIVISION,
TRINIDAD AND TOBAGO
Longline vessel, Trinidad
FISHERIES DIVISION,
TRINIDAD AND TOBAGO
The original ice boats that entered the fleet during the late 1970s to early 1980s were fibreglass-hulled vessels that were large (40 ft [12.19 metres] overall length) compared with the other typical fishing vessels of the time. However, given the perceived economic advantages of ice boat fishing, many people started equipping their day boats with ice holds, which often required extension of the existing hulls. As a result, the modern ice boat fleet is composed of a wide size range of hulls constructed of wood in the traditional way or custom-built with fibreglass. The converted day boats tend to have smaller hulls than the first ice boats introduced and as such the mean hull size of this type of vessel has been reduced over the years.
The fishing fleet consists of 230 day boats (average length 8.2 metres) and 85 ice boats (average length 12.8 metres) and lands its catches in around 30 landing places or small ports located around the island. The small day boats operate at a distance of 18 nm from the shore, while the larger ice boats fish at a distance up to 190 nm from the island. The most common gear are gillnets. Large pelagic species are caught by handlines or trolling lines.
The age structure of the fishing boats shows that most of the boats are relatively new (60 percent are under ten years old).
Antigua and Barbuda
The fishing fleets of Antigua and Barbuda are small-scale in nature. Table 4 summarizes their operational characteristics based on the primary method of fishing. In terms of quantity and value of total landings and generation of employment and income, the vessels involved in trap fishing are by far the most important economically, particularly the open boats, open boats with cabin, wooden sloops and fibreglass and wood launches. Based on the 2001 vessel census conducted by the Fisheries Division, trap fishing vessels make up 52 percent of the active fishing fleet of 289 vessels and supply at least 56 percent of the total landings of 1 824 tonnes.
Dealing specifically with Barbuda, open boats are economically the most important. They make up 98 percent of the fleet and are mainly fibreglass pirogues or skiffs, powered by 30 kW outboard engines. Lobster export is the main commercial outlet for fishers because of the absence of onshore infrastructure for wholesaling and retailing fish. The economic significance of open boats in the island's economy is best highlighted by the percentage of the population directly dependent on commercial fishing. In Barbuda, there are 71 registered commercial fishers with 43 vessels and a total of 235 dependents; this accounts for 25.5 percent of the total population of 1 200.[10] The lobster export sector is valued at US$0.45 million based on ex-vessel prices. Similar to Antigua, traps are the most commonly used fishing gear and are used by 87.8 percent of full-time fishers and 60 percent of part-time fishers.
The fishing grounds around Antigua and Barbuda are located on the western portion of the insular shelf where the shelf is widest. The shelf is narrowest on the eastern side and falls away rapidly to great depths (>200 metres). Small vessels (open boats and open boats with cabins) mainly fish within 18 km of the coast, at a depth of 30-40 metres. The larger vessels, sloops and launches, fish at depths of 30-170 metres on the central portion of the insular shelf, west and southwest of Antigua. These vessels mainly fish within 75 km of the coast. Large vessels may also set traps in shallow waters (<40 metres), to catch proportionally more lobster.
As a result of the open access regime of the fisheries, the inshore demersals (reef fish and lobster) may be fast approaching their maximum level of sustainable yield. The general consensus is that the country is fully utilizing the inshore demersal resources of the EEZ and that the offshore pelagics (and, to a lesser extent, the deep slope fish) are the only possibility left for further expansion of the fishery. According to the Plan for Managing the Marine Fisheries of Antigua and Barbuda, "consideration is being given to developing a small fleet of industrial vessels with capability to exploit large pelagic species within the EEZ and beyond".
TABLE 4
Operational characteristics of fishing
vessels
|
Vessel type |
Primary method of fishing and number of vessels |
||||||
|
Trap |
Handline |
Troll |
Longline |
Gillnet |
Dive |
Total |
|
|
Open (w/f) |
83 |
30 |
5 |
1 |
35 |
17 |
171 |
|
Cabin (w/f) |
34 |
16 |
1 |
0 |
1 |
0 |
52 |
|
Sloop (w) |
3 |
0 |
0 |
0 |
0 |
0 |
3 |
|
Launch (w) |
10 |
0 |
1 |
0 |
0 |
0 |
11 |
|
Launch (f) |
21 |
4 |
21 |
3 |
0 |
0 |
49 |
|
Other |
0 |
1 |
2 |
0 |
0 |
0 |
3 |
|
Total |
151 |
51 |
30 |
4 |
36 |
17 |
289 |
Trap theft and ghost fishing are two of the main problems affecting the trap fishery. The former is of such a serious nature that an increasing number of vessels are using "pop-ups" to conceal the buoys marking the trap position. Trap theft has also caused an increasing number of fishers to set traps "blindly" (i.e. without buoys), possibly accentuating the problem of ghost fishing. The Government, supported by FAO, needs to take action to mitigate the problem of ghost fishing.
Republic of Korea
When compared with previous studies the number of fishing vessels in the country has once again declined. At the end of 2001 approximately 2 500 vessels were operating.
The main reason for the decline is the overexploitation of a number of fish stocks, which has resulted in a lower profitability of the fleet. The fleet consists of stownetters, trawlers (both pair and single trawl), jigging vessels, purse seiners, Danish seiners and dragnetters. Jigging vessels targeting squid are the largest group, followed by stownetters and dragnetters that operate near the shore.
The main fishing areas of the Korean fleet are the Yellow Sea and East China Sea, all coastal waters of the country and, especially for jigging vessels, international waters.
The most important species caught are squid, followed by small pelagics and hairtail.
Concerning future development of the fleet, there is no room for new fishing areas, either in coastal areas or offshore. Existing resources are considered to be fully exploited. Some research with regard to by-catch and discard reduction is ongoing in the country.
The Government actively controls the fishing effort and the issuing of new fishing licences has stopped in order not to increase capacity.
Thailand
In 2000 the total number of fishing boats was 58 119 of which 87.9 percent were small-scale. The average age of the boats was 7.6 years. The non-powered boats and the outboard-powered boats were about 6.7 years old whereas the inboard-powered boats were 9-14 years old.
The marine fisheries are characterized by multispecies and multigear fisheries and a number of various fishing gears are used. Of the total of 58 119 fishing vessels, gillnets are the most popular gear and constitute 52.2 percent, followed by traps and trawl nets at 14.2 and 9.6 percent, respectively.
By size of management, the fishing fleet is composed of powered boats and non-powered boats at 95.4 and 4.5 percent, respectively. About 76 percent of the powered boats are outboard powered and the rest are inboard powered with different classes of gross tonnage. Of the inboard-powered boats, those with less than 10 GT, 10-50 GT and over 50 GT account for 47.3, 37.9 and 14.8 percent, respectively.
Anchovy dragnetters, Republic of Korea
CHO SAM
KWANG
Anchovy dragnetters, Republic of Korea
CHO SAM
KWANG
It was found that most of the non-powered boats use lift nets and traps, especially crab portable lift nets and crab traps. The majority of the outboard-powered boats use shrimp gillnets, followed by crab gillnets and traps. The inboard-powered boats of less than 10 GT mostly use otterboard trawls, crab and shrimp gillnets; those of 10-49 GT use otterboard trawls, squid cast nets and pair trawls; and those of 50 GT and over mostly use otterboard trawls, pair trawls and Thai purse seines.
However, the number of fishing vessels registered with the Division of Fisheries by gear types in 2001 was only 15 945. This number was broken down into gear types as follows: trawlers 42 percent, gillnetters 25 percent, purse seiners 9 percent, and others 24 percent. It was observed that the registered vessels were about 13 percent and have decreased from those registered in 1998 mainly as a result of the reduction in the registered vessels that operate trawl and push net. The fishing fleet was classified in four vessel sizes: under 14 metres, 14-18 metres, 18-25 metres and over 25 metres. The smallest size accounted for 50 percent of the total fleet. Vessels over 25 metres fished outside Thai waters. Of the total fishing fleet, otterboard trawlers and pair trawlers were important components and contributed to total landings of over 60 percent.
The level of exploitation of most species in the Gulf of Thailand ranged from fully exploited to depleted, particularly the demersal species. For pelagic fishes, many species such as mackerel and sardine were fully exploited; small tuna and anchovy also tend to be overexploited. However, some species such as trevallies, hardtail and king mackerel were moderately exploited. Cephalopods and shrimps were all overexploited.
Fishing in Thai waters faces an overfishing problem that has resulted in the deterioration of fisheries resources, followed by conflict among the beneficiary groups that exploit the resources. The problem is amplified by the high cost of production, particularly fuel costs, and the low prices of some species. The shortage of labour in commercial fisheries is still an ongoing problem.
India
The Indian fishing fleet accounts for 280 491 craft in total. The majority are traditional boats such as catamarans and canoes, which form the backbone of the small-scale fleet.
Catamarans range from 5 to 10 metres in length and consist of three to four solid logs of various kinds of wood. The simple design means that they are easy to assemble and operate, and require few accessories. There is a small capital investment and practically no maintenance cost. Catamarans have a significant role in various inshore fishing activities. Depending on the size and type of fishing, these craft work in fishing grounds of up to 50 metres in depth. They are operated by three to five people and use various gears such as gillnetters, hook and line, shore seine and bag net. Depending on climatic conditions, they work from 180 to 213 days a year with an average daily catch of 20 kg. Considering their excellent surf-riding capabilities and unsinkable nature, these craft are without doubt the best to operate from surf beaches.
About 20 600 mechanized boats use trawls. These boats are generally made from wood, sometimes covered with fibreglass, while others have steel hulls. Larger trawlers designed as outrigger trawlers target shrimps. The size of these trawlers varies between 10 and 27 metres in length. Purse seiners and tuna longliners are the most modern vessels in India. The tuna vessels operate in the whole of the Indian Ocean, while purse seiners, except for those targeting tuna, fish in the Indian EEZ.
U. Tietze and R. Lasch
Here we compare the cost structures of European, Asian, African, Caribbean and South American fishing vessels, both small-scale and coastal, and medium-size and large offshore ones. In general, the group of small-scale and coastal vessels includes those with a length of up to 25 metres; however, those operating various types of fishing gears in coastal waters are mostly less than 15 metres in length. The group of offshore and deep-sea vessels includes a wide variety of vessels, ranging from smaller fresh fish cutters with a length of 18-20 metres to factory vessels of up to 120 metres, using trawling and other active commercial fishing gear.
For each category of vessel, the operating costs - divided into running, vessel and labour costs - and the total costs, which include depreciation and interest, also referred to as capital cost, are analysed. With regard to the definition of the various cost components, the recent studies followed the same methodology as the previous two surveys carried out in 1995/1997 and 1999/2000. Labour costs consist of wages and other labour charges such as insurance and employers' contributions to pension funds. Running costs include the costs of fuel, lubricants, selling fish via auction, preservation and storage of fish, packing materials, harbour dues, bait, salt, ice and food and supplies for the crew. Vessel costs are those of vessel insurance, vessel and gear repair, and maintenance expenses. In some cases, these costs may be inflated if costs of upgrading and modernizing equipment have been included; these should not really be classified as genuine annual repair and maintenance costs. In general, operating costs vary widely depending on fishing method and gears used, the distance to the fishing grounds, the general cost structure of a particular country or region and many other factors.
When calculating and evaluating capital costs, it should be noted that many different depreciation systems are being used in the countries included in this report. Consequently, a common method of depreciation has been used, where the replacement value of the vessel is taken as the basis of depreciation. This replacement value is equal to the current building costs of a similar new vessel. The hull of a fishing vessel was depreciated over 25 years and 4 percent depreciation annually, according to the straight line method. In the case of vessels older than 25 years, 2 percent of the replacement value was depreciated for every year exceeding 25 years to account for improvements and modernization of these older vessels. Engines with heavy use were depreciated in ten years, at 10 percent depreciation per year and at 4 percent depreciation annually after this period. In the case of lighter engine use, the depreciation period was 15 years at 6.7 percent depreciation per year and at 2.5 percent depreciation per year after this period. All percentages are applied on the replacement cost. When the cost of the engine alone was not known, a cost ratio between hull and engine of 2:1 was assumed.
The real interest cost per vessel differed widely because of differences in the level of loans and the interest charged on loans in different countries. With a view to eliminating these differences, an imputed interest was calculated, reflecting the opportunity cost of the capital invested in the vessel. Hence, this interest cost is independent of the way in which the vessel was financed. The basis for the calculation was the book value of the vessel, which was derived from the replacement value and depreciation. The real interest rate, i.e. the difference between the rate for govern ment bonds and the inflation rate, was applied on the book value and the result is the imputed interest amount.
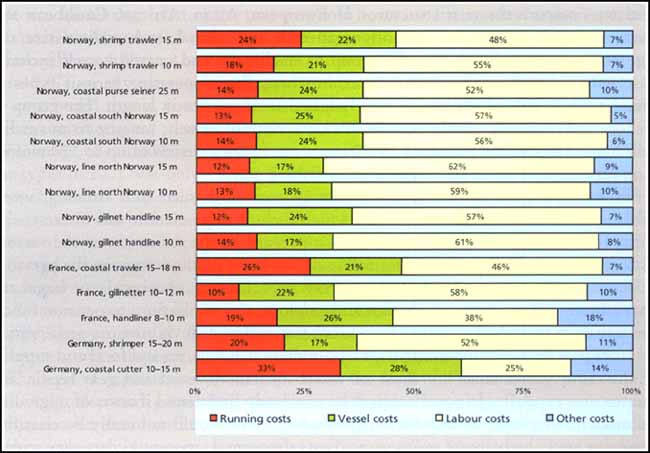
In small-scale fisheries in France, Germany and Nor way, labour costs accounted for the major part of operating costs (see Figure 1). With the exception of the smaller French and German fishing boats, i.e. French handliners and German coastal cutters using beam trawls, labour costs accounted for 50 percent or more of operating costs.
|
FIGURE 1
|
Vessel costs were the second highest component of operating costs of coastal vessels using fishing methods other than otterboard or beam trawling, followed by running costs. Vessels with running costs comprising the least important cost component use fishing gear such as gillnets, lines and purse seines.
For German cutters using beam trawls, German shrimp beam trawlers, 15-metre Norwegian shrimp trawlers and French trawlers, running costs ranked second, followed by vessel costs, and resulted from high fuel expenses associated with these particular fishing methods, i.e. beam and otterboard trawling.
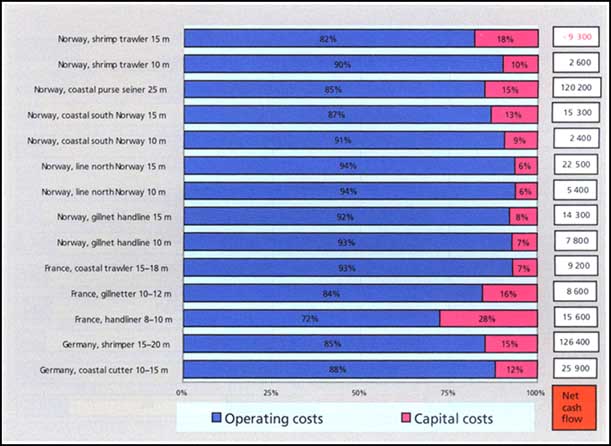
In the European coastal fisheries studied, capital costs accounted for only a minor part of total fishing costs. As shown in Figure 2, capital costs ranged from 6 to 28 percent of total costs. The share of capital costs in total fishing costs does not seem to be directly associated with a particular type of fishing vessel or fishing method but more with specific operational conditions, such as the distance to the fishing grounds, regulations and the average age of vessels in a particular category. It should also be remembered that larger fishing vessels, which incur higher capital costs, usually have higher operating costs that are sometimes disproportionately higher or lower than capital costs, depending on the conditions under which a particular type of vessel operates.
In this context, it is interesting to note that both the largest types of coastal fishing vessel covered by the study, the French 15-18 metre coastal trawlers, and one of the smallest fishing units, the 10-metre Norwegian gillnetters-cum-handliners had capital costs of 7 percent in total costs. The highest share of capital costs, 28 percent, was that of the smallest type of fishing unit studied, the 8-10 metre French handliners, followed by one of the larger types of coastal fishing units, the 15-metre Norwegian shrimp trawlers.
As regards the net cash flow, the highest results, as might be expected, were achieved by some of the larger vessel types, the German shrimp trawlers and the Norwegian purse seiners. The only type of vessel with a negative net cash flow was the 15-metres Norwegian shrimp trawler.
|
FIGURE 2
|
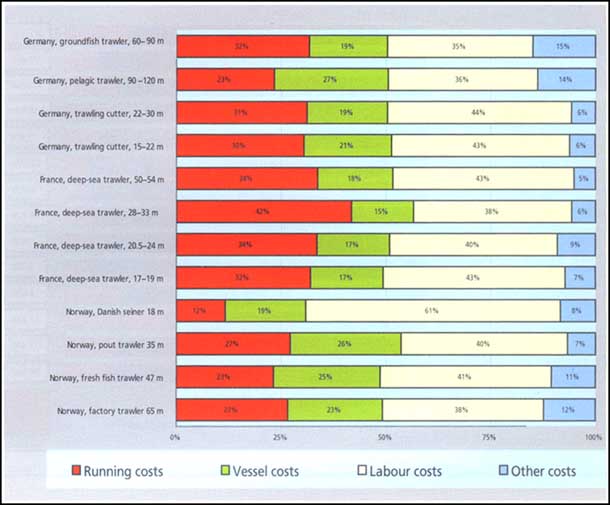
As was already the case in European coastal fisheries and also shown in Figure 3, labour costs again constituted the most significant part of operating costs in the French, German and Norwegian offshore and deep-sea fisheries. Compared with coastal fisheries, however, labour costs were less pronounced and running costs were more significant, ranking second, generally, before vessel costs. In the case of 28-33 metre French deep-sea trawlers, running costs even became the most important component of operating costs because of the high fuel costs and harbour charges incurred by these types of trawlers.
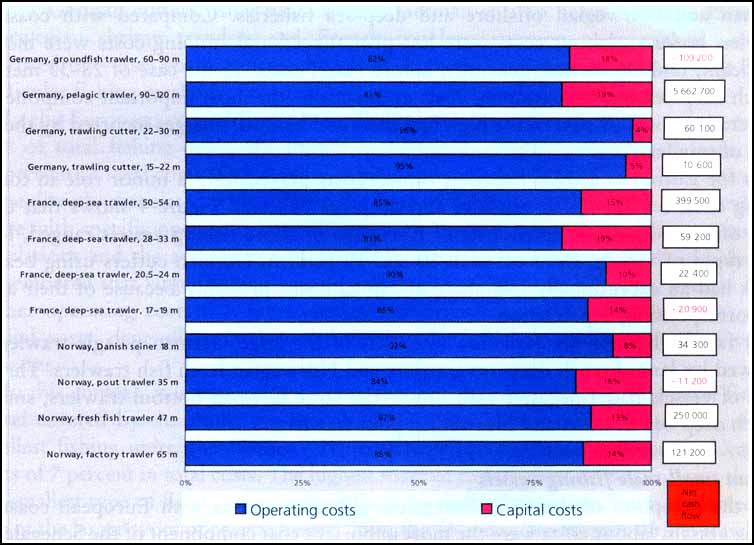
As for European coastal fisheries, capital costs played only a minor role in total fishing costs for European offshore and deep-sea fisheries. Figure 4 shows that the share of capital costs in total costs of European offshore fishing vessels ranged, for most types of vessels, from between 10 and 19 percent. German cutters using beam trawls had an exceptionally low share of capital costs, probably because of their age and corresponding depreciation.
By far the highest net cash flow was that of the large German pelagic trawlers, followed by large French deep-sea trawlers and Norwegian fresh fish trawlers. Three types of vessels had a negative cash flow - the large German bottom trawlers, small French deep-sea trawlers and Norwegian pout trawlers.
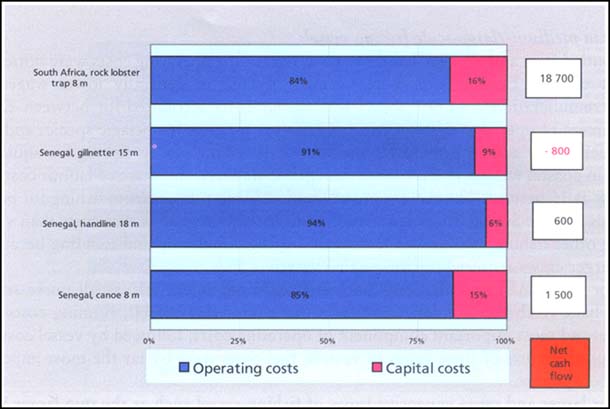
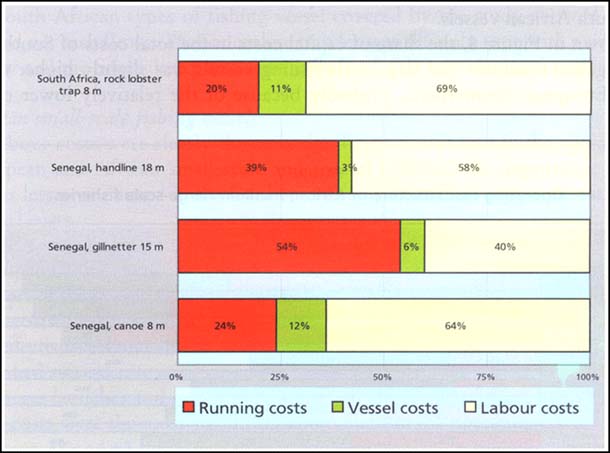
With the exception of the 15-m Senegalese gillnetter and as with European coastal fishing vessels, labour costs were the most important cost component of the Senegalese and South African small-scale fishing boats included in the study, as shown in Figure 5. However, unlike the European vessels, running costs ranked second, followed by vessel costs. This was because the African small-scale vessels spent less on maintenance and repair than their European counterparts. Of the running costs, fuel costs were by far the greatest expense.
|
FIGURE 3
|
|
FIGURE 4
|
|
FIGURE 5
|
|
FIGURE 6
|
Capital costs in total costs of small-scale fishing vessels in South Africa and Senegal ranged from 6 to 16 percent as shown in Figure 6. The two larger types of vessels, the Senegalese gillnetter and handliner, had a lower share of capital costs in total costs because of their high operating costs.
The net cash flows show that only the South African rock lobster boat performed well, while the Senegalese handline vessel and multipurpose canoe achieved modest results and the Senegalese gillnetter had a negative net cash flow.
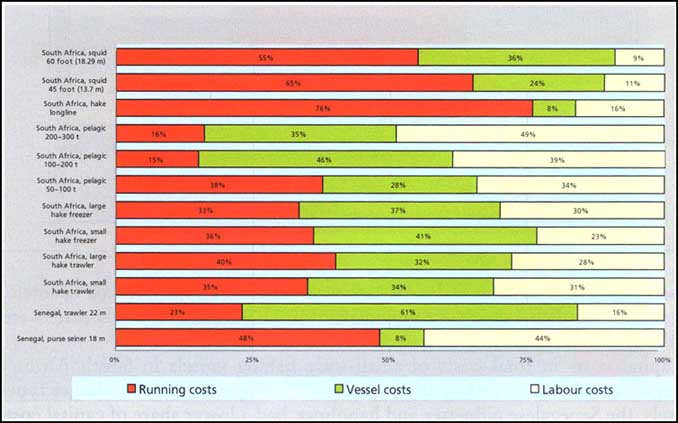
In South Africa and Senegal, labour costs as part of the operating costs were noticeably lower than in European offshore fisheries because of generally lower wages and crew remuneration. Figure 7 shows that labour costs accounted for between 23 and 49 percent of operating costs in African deep-sea fisheries for pelagic species and hake and between 9 and 16 percent for medium-scale fishing vessels fishing for squid and hake in coastal waters. In the case of Senegalese trawlers, the share of labour costs was as low as 16 percent. The three types of South African purse seiners fishing for pelagic species and the Senegalese purse seiners had relatively higher labour costs than vessels using other fishing methods such as squid jigging, longlining and trawling because of the larger crews required by purse-seine vessels.
For South African hake longliners and squid jigging vessels, small purse seiners, large hake fresh fish trawlers and Senegalese purse-seine vessels, running costs were the second most important component of operating costs, followed by vessel costs. Of the running costs of these types of vessels, fuel costs were by far the most important cost component.
For larger and more expensive types of fishing vessel such as the two larger South African purse seiners, vessel costs became more important than running costs. The same was true for the two types of South African hake freezer trawlers studied and for the Senegalese freezer trawler. The most important component of the vessel costs of these types of fishing vessels was that of the regular maintenance and repair of vessels and the repair and replacement of fishing gear, followed by insurance costs in the case of the South African vessels.
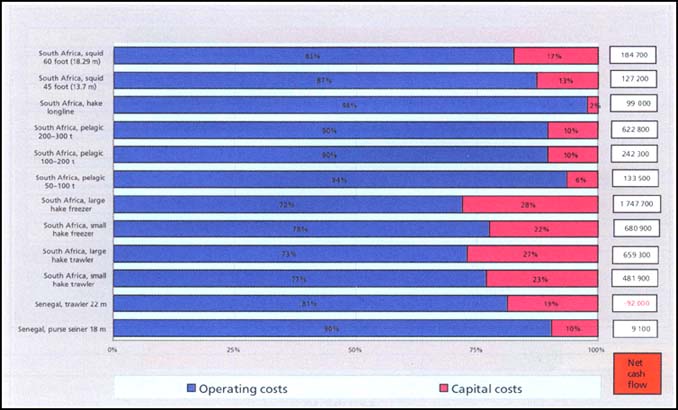
As shown in Figure 8, the share of capital costs in the total costs of South African and Senegalese medium- and large-scale fishing vessels was slightly higher than that of their European counterparts, probably because of the relatively lower operating costs resulting from lower labour costs and expenses for repair and maintenance. The percentage range was as wide as in Europe, ranging from as little as 2 percent for South African hake longliners to as much as 28 percent for South African large hake freezer vessels.
|
FIGURE 7
|
|
FIGURE 8
|
All South African types of fishing vessel covered by the study showed good and very good net cash flows. The Senegalese trawler was the only type with a negative net cash flow and the Senegalese purse seiners showed only a moderate net cash flow.
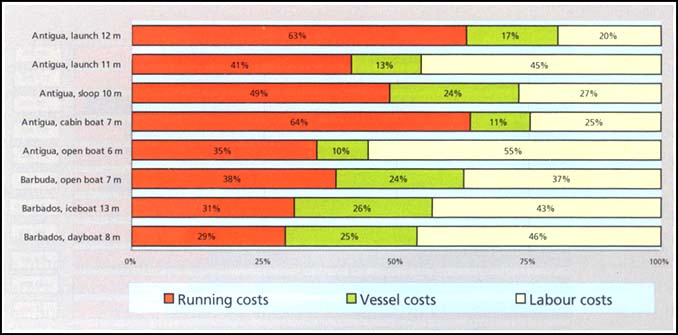
While labour costs were clearly the most significant component in the operating costs of European and African small-scale and coastal fisheries, the importance of labour costs was less pronounced in the Caribbean countries studied compared with running and vessel costs.
Figure 9 shows that in the case of the Barbadian day boats and ice boats and the smaller open fishing boats and launches in Antigua, labour costs still accounted for the largest part of the operating costs, ranging between 43 and 55 percent. In all these cases, running costs clearly ranked second, similar to and for the same reasons as African small-scale fisheries and different from European small-scale fisheries, where vessel costs ranked second.
For larger launches and sloops in Antigua and larger open fishing boats in Barbuda, running costs were the most significant component in the operating costs, accounting for between 38 and 63 percent, followed by labour costs. In the case of the Antiguan launches and sloops, fuel and bait were by far the most important running costs, followed by those of food for the crew and ice. With the exception of ice, which is not used on open fishing boats in Barbuda, the same applied for the larger open fishing boats in the country.
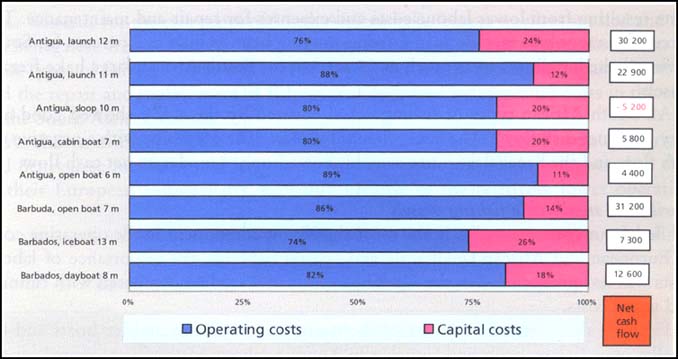
As Figure 10 shows, the share of capital costs in the total costs of the Caribbean small-scale fishing vessels in the study ranged from 11 to 26 percent and was slightly higher than that of European and African small-scale vessels. This might partly be because of the relatively lower operating costs of the Caribbean vessels as, in many cases, the distance to the fishing grounds is shorter.
|
FIGURE 9
|
|
FIGURE 10
|
It is interesting to note that the highest net cash flow was achieved by one of the smallest boats, the open 7-m fishing boat in Barbuda, followed by the two types of Antiguan launches and the day boats in Barbuda.
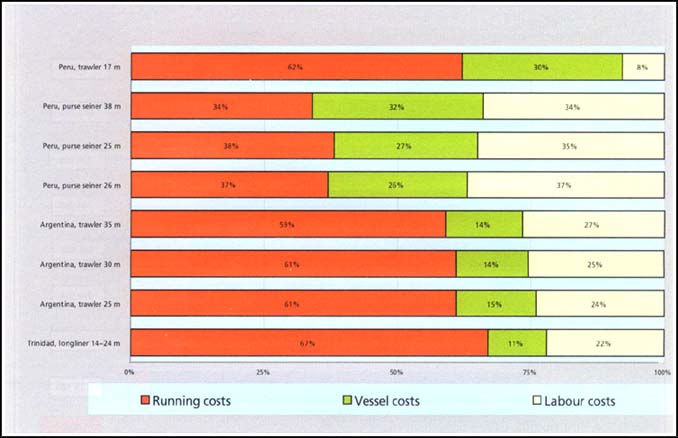
As in the case of South African and Senegalese fishing vessels, the labour costs incurred by Argentine, Peruvian and Trinidadian fishing vessels played a much less important role in the operating costs than in European offshore fisheries, as a result of generally lower wage levels in South American and Caribbean countries.
Figure 11 shows that in the case of the Peruvian hake trawlers, labour costs accounted for as little as 8 percent in the operating costs. In the case of the Trinidadian longliner, they were as low as 22 percent. Labour costs of the three size classes of Argentine trawlers ranged from 24 to 27 percent. For the three size classes of Peruvian purse seiners, labour costs were noticeably higher and ranged from 34 to 37 percent.
|
FIGURE 11
|
This is related to the fishing method of purse seining, which is more labour intensive than trawling and longlining.
The most important component in the operating costs of Peruvian and Argentine hake trawlers and Trinidadian longliners was their running costs, which ranged from 59 to 67 percent. Vessel costs were less important for these types of vessels, ranging from 11 to 30 percent.
Fuel was by far the most important component in the running costs of the trawlers while the cost of bait, followed by fuel and gear expenses, was the most significant running cost for the longliners.
In the case of the three types of Peruvian purse seiners, the share of running costs in the operating costs was almost as high as that of labour costs and ranged from 34 to 38 percent. The share of vessel costs ranged from 26 to 32 percent, slightly lower than that of labour and running costs.
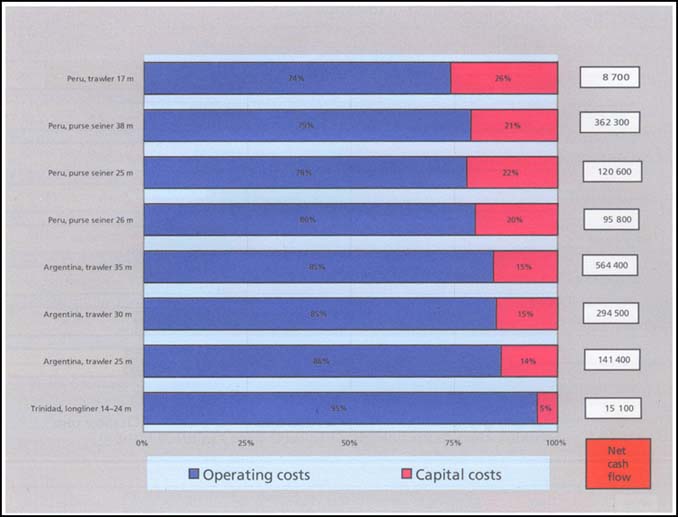
As in the case of the African medium- and large-scale fishing vessels included in the study, the share of capital costs in the total costs of the four types of Peruvian fishing vessels studied was generally higher than for the European vessels. As shown in Figure 12, this share ranged from 20 to 26 percent. The three Argentine trawlers were similar to the European vessels and the share of capital costs in the total costs of longliners in Trinidad was a low 5 percent.
With the exception of the Peruvian trawlers, all other vessels showed very satisfactory or satisfactory net cash flows.
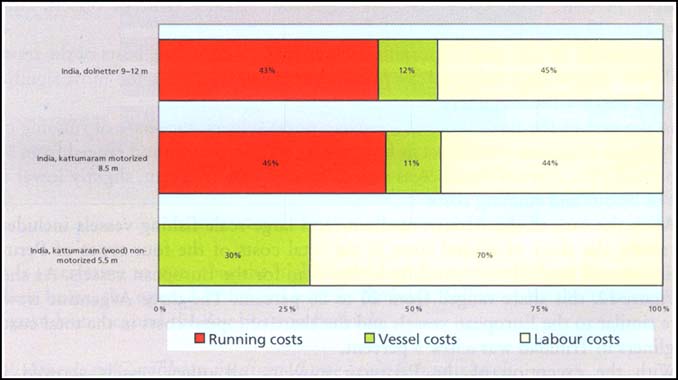
Figure 13 shows that in the case of the two motorized Indian fishing boats, labour and running costs were about equally important and accounted for almost 90 percent of the operating costs. Vessel costs accounted for only slightly more than 10 percent of the operating costs.
The non-motorized Indian kattumaram had no running cost other than that of labour, which accounted for 69 percent of the operating costs.
|
FIGURE 12
|
|
FIGURE 13
|
Compared with European and South African small-scale fishing units, the Indian motorized units had a lower share of labour costs in the operating costs because of the generally lower levels of remuneration in India.
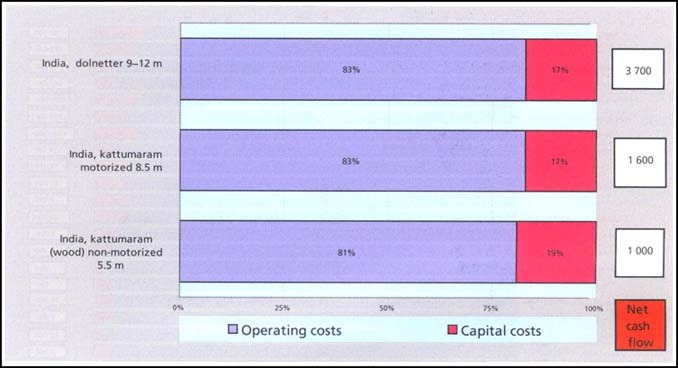
Figure 14 shows that in the case of the three types of Indian small-scale fishing boats, the share of capital costs in the total costs ranged from 17 to 26 percent. This range was slightly higher than for the other countries included in the study.
|
FIGURE 14
|
|
FIGURE 15
|
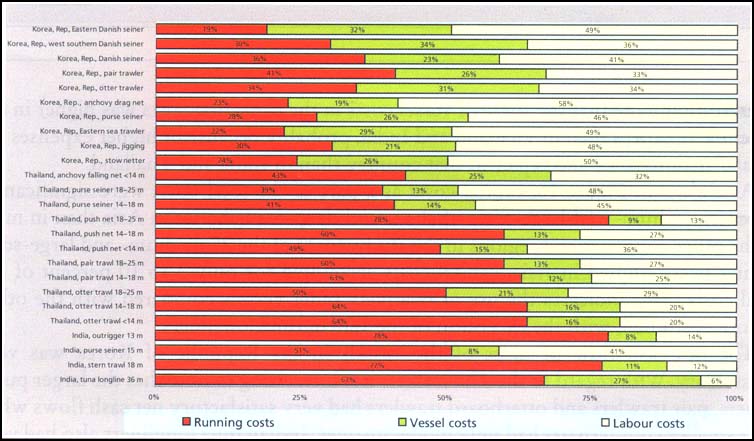
As regards the composition of operating costs, there were noticeable differences between India, Thailand and the Republic of Korea. With the exception of the Indian purse seiners, the share of labour costs in the operating costs was lowest in India, ranging from 6 to 14 percent, as shown in Figure 15. In the case of the Thai vessels, apart from the pushnetter, labour costs accounted for 20 to 36 percent of operating costs. The vessels of the Republic of Korea had the highest share of labour costs in the operating costs, ranging from 33 to 58 percent, which was almost as high as in Europe. These differences are to be seen against the background of the general level of remuneration in the national economies concerned.
With three exceptions in the Republic of Korea, running costs ranked second and vessel costs were the least important component in the operating costs. It is also interesting to note that the share of vessel costs in the operating costs was higher in the Republic of Korea than in Thailand and India, probably because of higher expenses for regular maintenance and repair in that country than in India and Thailand.
|
FIGURE 16
|
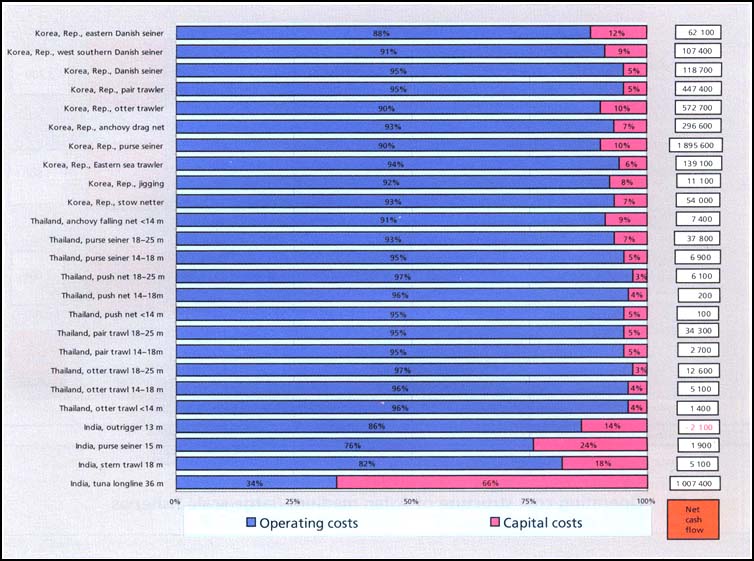
As shown in Figure 16, capital costs as a part of the total costs were significantly lower in medium- and large-scale offshore and deep-sea fisheries in Asia than in most of the other countries and regions in the study. In 20 of the 25 medium- and large-scale fishing fleets studied in Asia, capital costs accounted for only 3 to 10 percent of the total costs. This indicates the use of relatively older vessels compared with the other countries studied, with the exception of the Indian tuna longliners.
The net cash flow of most of the vessels in the Republic of Korea was very satisfactory. With regard to the Thai vessels it is interesting to note that the larger purse seiners, pair trawlers and otterboard trawlers had very satisfactory net cash flows while their smaller counterparts had only moderate ones. Indian tuna longliners also had very satisfactory net cash flows. The stern trawlers and purse seiners achieved rather more modest results and the outrigger trawlers had a negative net cash flow.
The studies carried out in 2002 and 2003 show that all 94 types of fishing vessels covered had a positive gross cash flow and fully recovered their operating costs, with no losses. When also considering capital costs, i.e. the costs of depreciation and interest, 88 of the 94 types of vessels or 94 percent showed a net profit after deducting the costs of depreciation and interest. When comparing the fishing fleets of countries studied in both 1999 to 2000 and 2002 to 2003, significant improvements in financial and economic performance can be seen in the Republic of Korea, Germany and Argentina, partially because of reduction and limitation of fleet capacity. In the other countries covered by the study, the overall picture remained similar with some fleets improving their performance and others achieving less favourable results.
The overall sustained positive earnings situation in 2002 and 2003, as compared with 1999 and 2000, is to be seen against the background of an increase in fuel prices, an important cost component of capture fisheries, of about 9 percent[11] between the two reporting periods, and of a decline in fish prices of up to 5 percent globally.
The findings of the national studies also confirm the variations in cost structure in different continents. These variations are clearly related to differences in the cost of labour in specific countries and to differences in the cost of maintenance and repair of fishing vessels, which generally are more favourable for the fishing industry in the Asian, South American and African countries included in the study than in European countries.
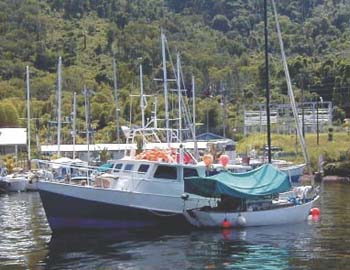
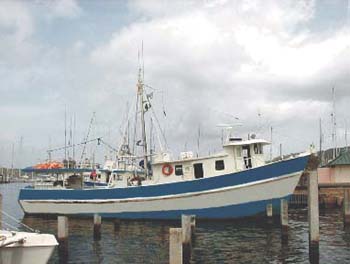
Traditional and modern traphauling launch,
Antigua
I. HORSFORD
Traphauling vessel, Antigua
I.
HORSFORD
|
[7] Calculated from differences
of Conventional Regular Gasoline Prices (CRGPs) in Singapore and Rotterdam
between 30 December1999 and 31 December 2002. [8] Mendoza, J.J. & Larez, A. 1996. Abundancia y distribución de pargos y meros por la pesquería artesanal de media altura del noreste de Venezuela de 1981 a 1992. [Abundance and distribution of snappers and groupers targeted by the artisanal medium-range fishery off northeastern Venezuela (1981-1992).] F. Areguin-Sanchez, J.L. Munro, M.C. Balgos & D. Pauly, eds. Biology, fisheries and culture of tropical groupers and snappers, pp. 266-276. ICLARM Conf. Proc. No. 48. 449 pp. [9] Manickchand-Heileman, S. & Phillip, D.A.T. 1992. Resource assessment profiles of the red snapper (Lutjanus purpureus), vermilion snapper (Rhomboplites aurorubens), yellowedge grouper (Epinephelus flavolimbatus), yellowmouth grouper (Mycteroperca institialis) and grunt (Haemulon melanurum). Fisheries Division, Ministry of Agriculture, Land and Marine Resources, Port of Spain, Trinidad and Tobago. July. 17 pp. [10] Horsford, I.S. 1999. A socio-economic survey of the fishers of Barbuda - Implications for planning and development. Fisheries Division, Ministry of Agriculture, Lands and Fisheries, St. John’s, Antigua. 23 pp. [11] Calculated from differences of Conventional Regular Gasoline Prices (CRGPs) in Singapore and Rotterdam between 30 December 1999 and 31 December 2002. |
![]()
![]()
![]()