![]()
Of the estimated 89 million tonnes of fish produced in 2000 in the world, excluding China, nearly 71 percent (63 million tonnes) was used for direct human consumption. The remainder (about 29 percent) was utilized for various non-food products, mostly for reduction to meal and oil. Corresponding figures for China, which were based on reported capture fishery, aquaculture and fishmeal production and FAO estimates of other non-food uses (see Box 2), were nearly 42 millions tonnes total production and nearly 34 million tonnes (81 percent) for direct human consumption. The remainder was used for the manufacture of fishmeal and other non-food uses, including direct feed to aquaculture.
As a highly perishable commodity, fish has a significant requirement for processing. In 2000, more than 60 percent of total world fisheries production underwent some form of processing. The most important of the fish products destined for direct human consumption was fresh fish (a share of 53.7 percent), followed by frozen fish (25.7 percent), canned fish (11.0 percent) and cured fish (9.6 percent).
During the 1990s, there was a significant increase in the proportion of fisheries production used as fresh/chilled fish rather than as other products (Figure 24).
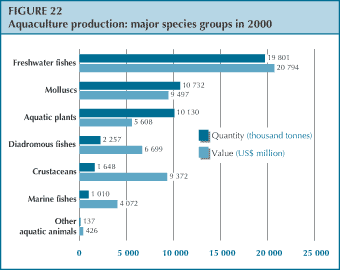
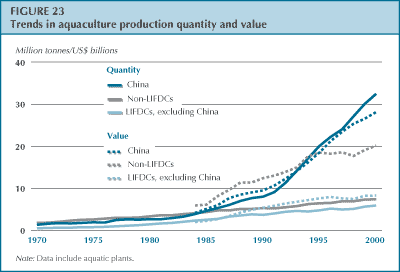
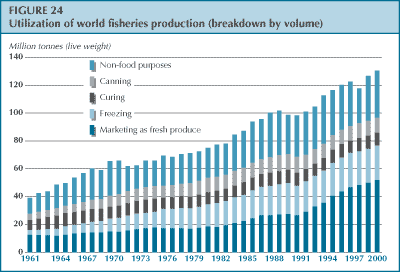
The demand for fresh fish increased, but was partially offset by a slight decline in other uses. Fresh fish increased in volume (live weight equivalent) from an estimated 28 million tonnes in 1990 to 52 million tonnes in 2000. Processed fish (frozen, cured and canned) increased in volume (live weight equivalent) from 43 million tonnes in 1990 to about 45 million tonnes in 2000. Freezing represents the main method of processing fish for human consumption, and had a 55 percent share in 2000. In developed countries, the proportion of fish that is frozen has been constantly increasing, and frozen fish has become the most common form of product, with a share of 40 percent of fish production. In developing countries, however, the share of frozen products is very constant at about 12 percent.
Almost all the fishery products used for non-food purposes in 2000 (33.7 million tonnes) came from natural stocks of small pelagics, which represented nearly one-third of the total capture fisheries. Most of these fishery products were used as raw material for the production of animal feed and other products. As catches of small pelagics for reduction regained the levels prevailing before El Niño, the quantity destined for non-food uses was about 9 million tonnes more than in 1998.
The total food fish supply for the world, excluding China, has been growing at a rate of about 2.4 percent per annum since 1961, while the population has been expanding at 1.8 percent per annum. Since the late 1980s, however, population growth outside China has occasionally outpaced the growth of total food fish supply, resulting in a decrease in per capita fish supply from 14.6 kg in 1987 to 13.1 kg in 2000 (Figure 2). For China, the corresponding annual increases are 6.4 percent for food fish supply since 1961 and 1.7 percent for the population (Figure 9). Annual growth was steady until the mid-1980s (at 3.8 percent from 1961 to 1985) and then suddenly trebled over the following 15 years (10.8 percent from 1985 to 2000).
TABLE 8 | ||
Total food supply (million tonnes live weight) |
Per capita food supply (kg per year) | |
World |
95.5 |
16.0 |
World excluding China |
64.3 |
13.6 |
Africa |
6.2 |
8.0 |
North and Central America |
8.1 |
16.8 |
South America |
2.9 |
8.5 |
China |
31.2 |
25.1 |
Asia (excluding China) |
32.5 |
13.7 |
Europe |
13.9 |
19.1 |
Oceania |
0.7 |
22.5 |
Industrialized countries |
25.4 |
28.3 |
Economies in transition |
3.7 |
12.7 |
LIFDCs (excluding China) |
20.8 |
8.3 |
Developing countries excluding LIFDCs |
13.7 |
14.8 |
The share of the animal protein intake of the whole human population derived from fish, crustaceans and molluscs increased from 13.7 percent in 1961 to 16.1 percent in 1996 and then showed a slight decline to 15.8 percent in 1999.
In industrialized countries (Table 8), where diets generally contain a more diversified range of animal proteins, the supply increased from 13.2 million tonnes in 1961 to 25.4 million tonnes in 1999, implying a rise in per capita provision from 19.9 to 28.3 kg. The growth rate was steady until the late 1980s and has stabilized again since then. In this group of countries, fish contributed an increasing share of the total protein intake until 1989 (accounting for between 6.5 and 8.5 percent), but its importance has gradually declined since then and its contribution in 1999 (7.7 percent) was back to the level prevailing in the mid-1980s.
BOX 6 Aquatic biodiversity from rice-based farming systems supports rural livelihoods Rice fields - much more than rice In the Upper and Lower Mekong River floodplains in Yunnan Province, China and Kampong Thom Province, Cambodia, an attempt has been made to document the availability of living aquatic resources and the pattern of their use by rice farmers. Farmers used their own tools and techniques to collect aquatic species from the fields. Participatory approaches facilitated learning about the traditional knowledge of the local people, including many ethnic minorities.1 Remarkable insights were gained. These rice ecosystems support a rich aquatic biodiversity that is important, not only as a source of daily food and income for rural households, but also as a habitat for rare and endemic species. Fishes are the most important group in terms of species diversity and importance for the local people. A total of 60 and 70 different fish species occur in rice farms in China and Cambodia, respectively. Most of these are consumed fresh or fermented into fish paste. Other species are fermented (either as fillets or in smaller pieces), dried, salted, smoked or used for preparing fish sauce. Fresh or processed fish is the primary source of protein for local people in these areas, and is usually eaten at every meal. In Kampong Thom, an average family of five people probably consumes about 1 kg of fresh fish every day during the fishing season, i.e. when the rice fields are flooded. The same family needs about 20 kg of fermented fish paste for the dry season. Everything else that is caught is sold in the market. Depending on the fishing tool employed, a farmer can catch 15 to 20 kg of fish on a good day, although the average fish catch during the fishing season is less than 10 kg per day. In China, a variety of fish, crustaceans, molluscs, amphibians, insects, reptiles and aquatic plants from rice-based systems are an essential part of the daily diet, in particular for the rice farming Dai minority in Xishuangbanna. The consumption level of aquatic organisms has remained fairly constant; nowadays about one-fifth to one-third of consumption is derived from capture in rice-based farming, but a decade ago this same capture supplied half of the fish needed in the diet. The use of aquatic organisms as animal feeds and bait, or for medicinal purposes, is an important addition to their human consumption value. The availability of these aquatic resources is declining. An increasing human population is resulting in overexploitation of seasonally resident fish populations. Pesticide use, the destruction of fish breeding grounds and illegal fishing methods also contribute to the decline. It seems likely that in other rice growing regions of the world where aquatic organisms are harvested from rice fields and contribute to nutritional needs, they too are likely to be subject to similar threats.2 1 FAO. 2002. Traditional use and availability of aquatic biodiversity in managed ecosystems, edited by M. Halwart and D. Bartley. Rome. |
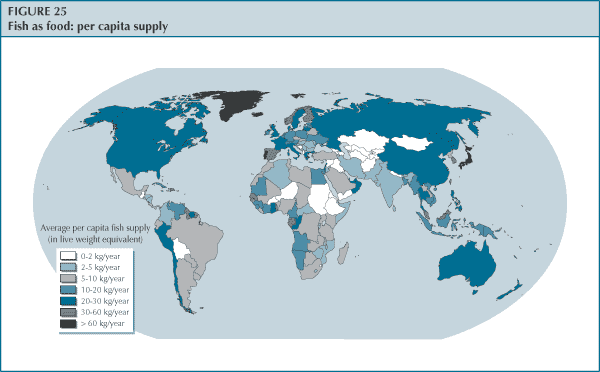
In the early 1960s, the average per capita fish supply in LIFDCs was one-fifth of that in the richest countries. The gap has gradually lessened, however, and in 1999 average LIFDC fish consumption was close to half that of the more affluent economies. If China is excluded, per capita supply in LIFDCs increased from 5.0 to 8.3 kg over the period - an annual growth rate of 1.3 percent. In LIFDCs, despite the relatively low consumption by weight, the contribution of fish to total animal protein intake is considerable (nearly 20 percent), and may be higher than official statistics indicate because of the contribution of unrecorded subsistence fisheries to food intake. Over the last four decades, however, the share of fish proteins in animal proteins has exhibited a slight negative trend owing to faster growth in the consumption of other animal products.
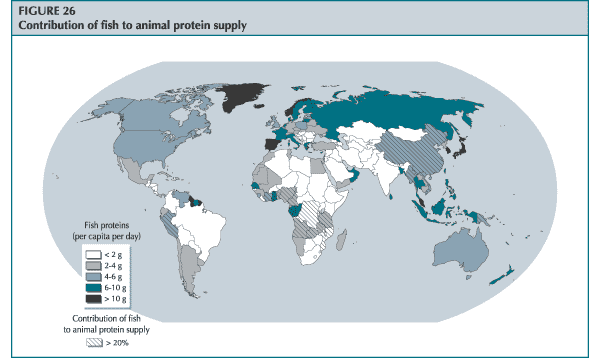
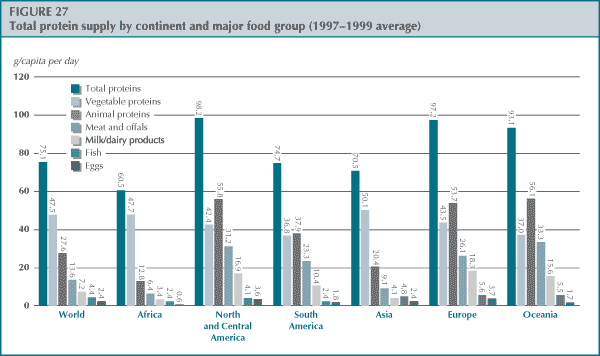
As well as income-related variations, the role of fish in nutrition shows marked continental, regional and national differences (Figures 25 and 26). For example, of the worldwide 95.5 million tonnes available for consumption in 1999, only 6.2 million tonnes were consumed in Africa (with a per capita supply of 8.0 kg); two-thirds of the total were consumed in Asia - 32.5 million tonnes outside China (13.7 kg per capita) and a similar amount in China alone (giving an apparent supply of 25.1 kg per capita).
Currently, two-thirds of the total food fish supply is obtained from fishing in marine and inland waters; the remaining one-third is derived from aquaculture. The contribution of inland and marine capture fisheries to per capita food supply stabilized at 10 to 11 kg per capita in the period 1970-2000. Recent increases in per capita availability have, therefore, been obtained from aquaculture production from both traditional rural aquaculture and intensive commercial aquaculture of high-value species. On average, for all countries in the world except China, aquaculture's contribution to per capita food availability grew from 0.5 kg in 1970 to 1.8 kg in 2000 - representing an average annual rate of 4.5 percent. In China, where fish farming practices have long traditional roots, the per capita supply from aquaculture is reported to have increased from nearly 1 kg to nearly 19 kg in the same period, implying an annual average growth of 11 percent.
The total amount of fish consumed and the species composition of the food supply vary according to region and country, reflecting the different levels of natural availability of aquatic resources in adjacent waters, as well as diverse food traditions, tastes, demand and income levels. Demersal fish are much preferred in northern Europe and North America, and cephalopods are consumed extensively in several Mediterranean and Asian countries, but to a much lesser extent in other regions. Despite the fast-growing contribution of aquaculture to production, crustaceans are still high-priced commodities and their consumption is mostly concentrated in affluent economies. Of the 16.0 kg of fish per capita available for consumption in 1999, the vast majority (75 percent) was finfish. Shellfish supplied 25 percent - or about 4 kg per capita, subdivided into 1.4 kg of crustaceans, 2.1 kg of molluscs and 0.4 kg of cephalopods.
Freshwater and diadromous species contributed 27 million tonnes of total supply. Marine finfish species provided 44 million tonnes, subdivided into 17 million tonnes of demersal species, 19 million tonnes of pelagics and 8 million tonnes of unidentified marine fish. The remaining 20 percent of the food supply was shellfish, comprising 8.6 million tonnes of crustaceans, 2.7 million tonnes of cephalopods and 12.5 million tonnes of other molluscs. Historically, there have not been dramatic changes in most of the broad groups' shares in average world consumption: demersal fish species have stabilized at about 2.9 kg per capita and pelagic fish at 3.2 kg. Two groups are exceptions in that they showed considerable increases between 1961 and 1999: the availability of crustaceans per capita more than trebled from 0.4 to 1.4 kg, largely because of the production of shrimps and prawns from aquaculture practices; and molluscs similarly increased from 0.6 to 2.1 kg per capita.
Fish contributes up to 180 calories per capita per day, but reaches such high levels only in a few countries where there is a lack of alternative protein foods grown locally and where a preference for fish has been developed and maintained (examples are Japan, Iceland and some small island states); more generally, fish provides about 20 to 30 calories per day. Fish proteins are essential and critical in the diets of some densely populated countries, where the total protein intake level may be low, and it is very important in the diets of many other countries (e.g. fish contributes more than, or close to, 50 percent of total animal proteins in the Gambia, Ghana, Equatorial Guinea, Indonesia, Sierra Leone, Togo, Guinea, Bangladesh, the Republic of the Congo, Cambodia).
Worldwide, more than 1 billion people rely on fish as an important source of animal proteins (i.e. fish provides at least 30 percent of their animal protein intakes) (Figure 27). Dependence on fish is usually higher in coastal than in inland areas. About 56 percent of the world's population derives at least 20 percent of its animal protein intake from fish, and some small island states depend on fish almost exclusively.
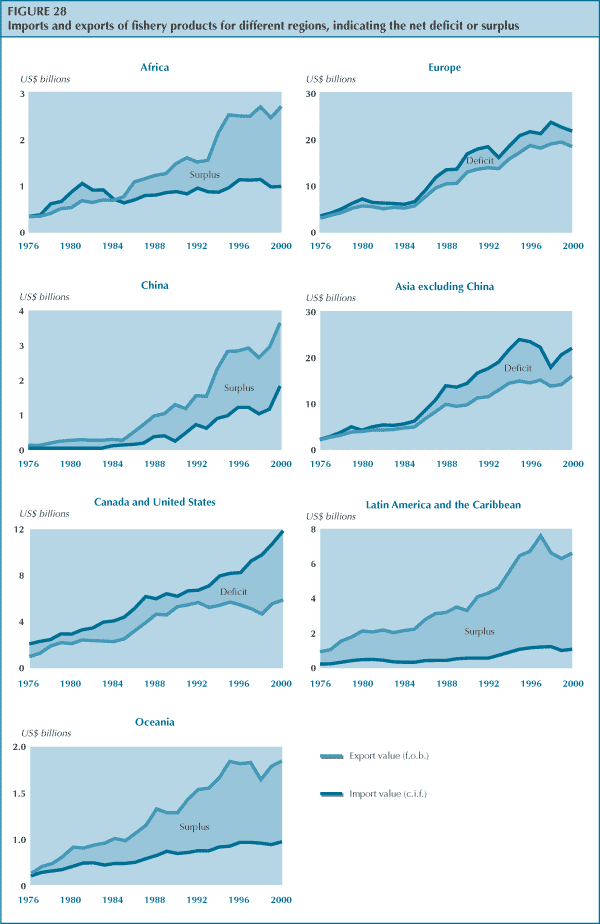
In addition to their role as a source of food and livelihoods, fisheries in many countries are also an important source of foreign exchange. In a few cases, fishery exports are essential to the economy. For example, in 2000 they accounted for more than two-thirds of the total value of traded commodities in Greenland, the Seychelles, the Faeroe Islands and Iceland. In many countries there is a substantial two-way trade in fishery products. The trade surplus is significant in South America, Africa, China and Oceania (Figure 28). Products derived from aquaculture production contribute an increasing share of total international trade in fishery commodities (see Box 7).
In 2000, total world trade of fish and fishery products increased to an export value of US$55.2 billion, having grown by 8 percent since 1998. This increase was largely due to a rise in the volume of commodities traded (Figure 29); compared with 1998, the prices of major food products decreased marginally and those of feeds declined sharply. Thailand continued to be the main exporting country, with US$4.4 billion. China experienced a sharp increase in its export performance to reach US$3.7 billion in 2000 -a major growth of 36 percent from 1998 - and is now the second largest exporter. In addition to exports from domestic production, China also reprocesses imported raw material for export, creating a strong value-addition in the process. Norway, which used to be ranked second, reported lower export values. These were partly caused by lower salmon prices, but also by the low value of the euro - the currency of the main trading area for Norwegian fish.
Fish imports reached a new record of US$60 billion in 2000. Developed countries accounted for more than 80 percent of the value of total fishery product imports. Japan was again the largest importer of fishery products, accounting for some 26 percent of the global total; its fishery imports accounted for 4 percent of its total merchandise trade. After the economic recession, which caused a decline in 1998, the value of Japanese imports of fish and fishery products in 2000 returned to the level of 1997. The EC further increased its dependency on imports for its fish supply. Excluding Spain, which is now the third largest importer of fishery products, all other major countries of the euro currency area reported decreased values of imports in 2000. The United States, as well as being the world's fourth largest exporting country, was the second largest importer. Imports were growing in 2000, mainly owing to expanding shrimp imports.
BOX 7 Trade in aquaculture products The main traded products1 from aquaculture are shrimp and prawns, salmon, and molluscs. Other species showing strong growth in trade are tilapia, seabass and seabream. Crustaceans In international trade, the most prominent product from aquaculture is marine shrimp, and aquaculture has been the major force behind increased shrimp trading during the past decade. Shrimp is already the most traded seafood product internationally, and about 26 percent of total production now comes from aquaculture (1.1 million tonnes in 2000). Since the late 1980s, farmed shrimp has tended to act as a stabilizing factor for the shrimp industry. The major crop failures in Asia and Latin America during past years have therefore had an impact on overall supply, demand, prices and consumption trends. Considered a luxury product in most markets, shrimp demand is very dependent on a country's economic climate, and consumption and trade in an individual country may show large variations from year to year. At present, Japanese demand remains weak, as does the United States market after September 2001. The major markets are Japan, the United States and the EC, and the largest exporters of farmed shrimp are Thailand, Ecuador, Indonesia, India, Mexico, Bangladesh and Viet Nam. Demand for shrimp and prawns is expected to increase in the medium to long term. Asian markets such as China, the Republic of Korea, Thailand and Malaysia will expand as local economies grow and consumers demand more seafood. This trend is already reducing the availability of shrimp to traditional importers, and will eventually put upward pressure on prices if supplies do not expand. Increases in prices will encourage new entries into shrimp farming and, if sustainable methods of production are used, greater stability of prices. Trade in crab species has increased with growing aquacultural production (140 300 tonnes in 2000). Total exports for fresh, frozen and preserved crab (wild and farmed) reached 240 000 tonnes and US$1.5 billion in 2000. Finfish Finfish production ranks first in terms of total aquaculture output, with 23 million tonnes produced in 2000, or about 65 percent of total production from aquaculture. The major share of this total were carps (68 percent of total finfish production in 2000), which are consumed locally in the producing countries (mainly China and India). International trade in farmed salmon has increased from virtually zero to about 1 million tonnes (2001) in less than two decades. The traded species are mainly Atlantic salmon and, to a far lesser extent, coho salmon, which accounted for 88 and 10 percent of production in 2001, respectively. Growth in trade has followed the growth in salmon production, as the bulk of production is concentrated in a few countries with limited domestic markets - Norway, Chile and the United Kingdom. Norway is the main exporter of Atlantic salmon, and Chile the main exporter of coho salmon and the second largest exporter of Atlantic salmon. The main market for Norway is the EC, which accounts for some 70 percent of Norwegian exports; Chile's main markets are Japan and the United States, accounting for some 55 and 30 percent of Chilean exports, respectively. Norway has identified Asia as the future growth market (in addition to further penetration of the European markets), and the Norwegian salmon farming industry has spent almost US$150 million on international promotion and advertising over the last few years. Chilean producers foresee strong growth in the United States, Latin American, European and Asian markets, excluding Japan. In contrast to Norway, Chile produces a large quantity of fillets, which are sent fresh by air to the United States market. The global farmed salmon industry is restructuring rapidly, with a few companies accounting for a large share of production and frequently having strong ties to the feed industry. As production volumes have increased, costs and prices have been driven down and, at current levels (US$2.60 to $3.40/kg cost, insurance, freight [c.i.f.]), salmon has become a relatively mid-priced product in international seafood markets. International trade in trout is much smaller than in salmon, with exports in 2000 reaching some 140 600 tonnes out of a total farmed trout production of 511 000 tonnes. Consumption is concentrated in trout producing countries, but Norway and Chile have been able to farm specific qualities of large-sized, heavy-pigmented trout for the Japanese market (Japan imported 84 000 tonnes of trout in 2001). Another species to show tremendous growth in output is tilapia (aquaculture production of tilapia and other cyclids amounted to some 1 265 800 tonnes in 2000). International trade is limited but growing, especially between Central American producers (Costa Rica, Ecuador and Colombia) and the United States, and between Asian producers (Taiwan Province of China, Indonesia and Thailand) and the United States and Japan. There is also modest trade between Jamaica and the United Kingdom. The largest exporter, Taiwan Province of China, supplies Japan with high-quality tilapia fillets for the sashimi market, and ships frozen tilapia to the United States market (40 000 tonnes in 2001). Taiwan Province of China exports about 70 percent of its domestic tilapia production. Thailand and Indonesia export less than 5 percent of their production. Viet Nam has also recently entered the world tilapia market, and China exported 12 500 tonnes to the United States in 2001. Zimbabwe now also produces fresh and frozen fillets for the EC market. In the United States, tilapia is now the third most imported aquaculture product by weight (56 300 tonnes in 2001), after shrimp and salmon. United States imports have been growing strongly and are forecast to grow further in the future. Long-term tilapia prices are expected to decrease, and this should lead to increased exports to the United States, as well as to Europe, which is still an undeveloped market for tilapia. In Europe, the seabream and seabass industry has grown strongly in the last decade. Production reached 120 000 tonnes in 2001, most of which was exported, mainly to Italy and Spain. The main exporter was Greece, which exported about 70 percent of domestic production. Italy was originally almost the only export market for Greek production but, as a result of market development efforts, Greek exports have now expanded into new markets, such as the United Kingdom, Germany and France, as well as Spain for certain sizes. At the opposite end, trade in fingerlings comes from Italy, Spain and France and goes to farms in Greece, Malta and Croatia. As seabass/seabream output has grown, costs have been driven down, and market prices declined by more than two-thirds between 1990 and 2002 - from US$16/kg to about US$4 to $5/kg. The rapid saturation of the market and the parallel rapid price decline (60 to 70 percent in ten years, compared with 50 percent for Atlantic salmon) are attributed to the much smaller traditional market for these species (mainly southern Europe) compared with the Atlantic salmon market, lack of diversified products, and limited market development and promotion. The substantial drop in prices of these species is, however, opening new markets and expanding existing ones, although acceptable profit margins at the production end can only be sustained through further improvements in productivity and product diversification. As with farmed salmon, the seabass/seabream industry is becoming consolidated, and several companies are also quoted on the stock exchange in Greece and Norway. American catfish is now the fifth most consumed fish in the United States (0.5 kg per capita edible weight in 2000), and domestic production reached 280 000 tonnes in 2000. Exports are limited because production is aimed at the domestic market, whereas imports from Viet Nam have rapidly gained market share in the United States (7 700 tonnes) and European markets. The reason for the success of catfish is similar to that of tilapia's success: strong consumer demand for white, easy-to-prepare fillets. Seaweed Farmed seaweed production has been growing in the last decade (10 million tonnes in 2000), and is now 88 percent of total seaweed supplies. Most output is utilized domestically for food, but there is growing international trade. China, the main producer, has started to export seaweed as food to the Republic of Korea and Japan. The Republic of Korea, in turn, exports some quantities of Porphyra (red seaweed) and Undaria (brown seaweed) to Japan (23 500 tonnes in 2000). Significant quantities of Eucheuma (red seaweed) are exported by the Philippines, the United Republic of Tanzania and Indonesia to the United States, Denmark and Japan. Total EC imports of seaweed in 2000 amounted to 61 000 tonnes. Chile is an important extractor, processor and exporter of agar and carrageenen. Molluscs International trade in molluscs is relatively limited compared with total output: less than 10 percent of total output is traded. Major importing markets are Japan, the United States and France, while major exporters are China and Thailand. The contribution of farmed products to trade is uncertain. For all categories, international trade is increasing. Total fresh and frozen scallop imports have grown from 28 000 tonnes in 1985 to 78 100 tonnes in 2000, reaching a value of US$563 million. Clam imports have grown from 33 000 tonnes to 171 000 tonnes in the same period, valued at US$301 million. Mussel imports showed a downward trend after a peak of 175 000 tonnes in 1992, to reach 137 000 tonnes in 1993 and 151 000 tonnes in 1994. However, mussel imports showed an upward trend again in subsequent years: 200 000 tonnes valued at US$310 million in 2000. Oyster imports have been growing steadily from less than 10 000 tonnes in 1985 to 47 000 tonnes in 2000, reaching a value of US$200 million. Live organisms Asia is rapidly increasing its consumption of live seafood as a result of cultural preferences and growing affluence. The live seafood market is largely restricted to the restaurant trade and to consumers with a relatively high disposable income. Major market expansion is anticipated as a result of demand in China, but expansion is also expected in Malaysia, Singapore and Taiwan Province of China, as well as in parts of North America and Europe with large Chinese or Asian communities. Aquaculture's potential to supply the market is promising. The sector is already supplying large quantities of shellfish and limited quantities of grouper, crabs and other species. Technological developments in the culture of preferred live food species will increase aquaculture's contribution to supplies. Annual international exports of ornamental fish are about US$200 million in value, or less than 1 percent of total world fish trade. However, the total value of the wholesale ornamental trade is estimated at close to US$1 billion, and retail trade at about US$3 billion in the United States alone. The importance of the ornamental fish trade is not just in terms of its share in international trade. The sector is an important source of income for rural, coastal and insular communities in developing countries and, frequently, a welcome provider of employment opportunities and export revenues. Asia accounts for more than 50 percent of the world supply of ornamental fish. New players such as the Czech Republic and Malaysia are now competing with the traditionally dominant suppliers. The main importers are the United States (24 percent), Japan (14 percent) and Europe, particularly Germany (9 percent), France (8 percent) and the United Kingdom (8 percent). In international trade, freshwater species represent about 90 percent in value terms, against 10 percent for marine species. Freshwater species are mostly farmed, whereas marine fish come from the wild. However, marine aquaculture is growing strongly as problems related to the environment and the lack of sustainable collection practices make this a more viable long-term alternative. There appears to be significant regional and international trade in seed of cultured aquatic organisms, mainly from aquaculture sources. In most instances, however, this is poorly documented. As well as the regional trade in Mediterranean seabass and seabream fingerlings, there is also trade in glass eels (e.g. China's recent large purchases of European eel elvers), post-larvae stages of various cultured shrimps, Indian and Chinese carps, and others. There is also limited trade (in terms of quantity) in broodstock. Documentation of the trade in seed will improve gradually in response to concerns about the spread of diseases and the movement of genetic material. 1 The extent of regional and international trade in aquaculture products is difficult to analyse because trade in many aquaculture products is not yet well documented in the main producing countries. International trade statistics often do not distinguish between wild and farmed origin, and the exact breakdown in international trade is therefore open to interpretation. This situation will change gradually, as producers' associations emerge in producing countries and begin to keep records, and in response to new environmental and labelling requirements that distinguish between farmed and wild products. An important development is the new EU legislation on labelling, which since 1 January 2002 requires most fishery products to carry labels stating whether they originate from capture fisheries or aquaculture. |
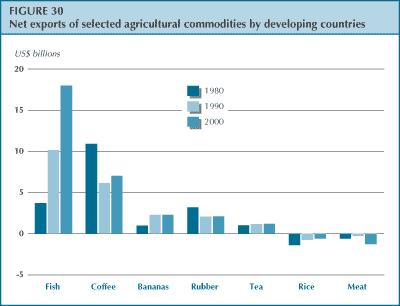
The net receipts of foreign exchange by developing countries (i.e. deducting their imports from the total value of their exports) increased from US$3.7 billion in 1980 to US$18.0 billion in 2000 - a 2.5-fold increase in real (corrected for inflation) terms. In 2000, they increased by nearly 10 percent at current values compared with 1999, after several years of stability at about US$16 billion. This was greater than the net exports of other agricultural commodities such as rice, coffee and tea (Figure 30). For many developing nations, fish trade represents a significant source of foreign currency earnings.
Fish production and trade have grown significantly in the last decades, assisted by improvements in technology, transportation and communications and by sustained demand. A large share of fish production enters international marketing channels, with about 37 percent exported in 2000 (live weight equivalent) in various food and feed product forms. LIFDCs play an active part in this trade, and at present account for almost 20 percent of the value of fishery exports. In 2000, developing countries as a whole supplied slightly more than 50 percent of total exports in value terms. Although there is an important trade of fish and fishery products among the more developed economies, trade tends to flow from the less developed to the more developed countries. About 76 percent of the import value is concentrated in three main areas: Japan, the EC and the United States. Although trade among developing countries is increasing, it is still not very substantial and accounted for about 20 percent of those countries' total exports in 1998-2000.
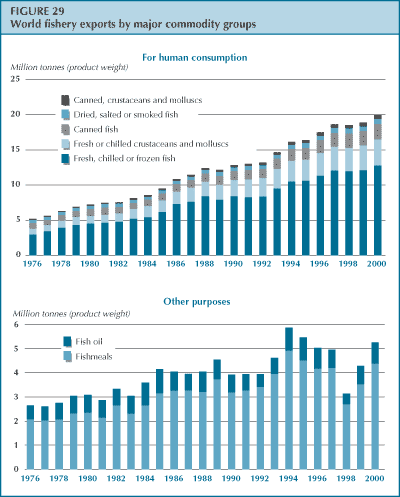
Owing to the high perishability of fish, more than 90 percent of fish and fishery products trade consists of products that have been processed in one form or another. Live, fresh or chilled fish represent only a small, though growing, share of world fish trade; the growth reflects improved logistics and increased demand. Shrimp is the main fish trade commodity in value terms, followed by demersal species (e.g. hake, cod, haddock and Alaska pollock), tuna, salmon, small pelagics, cephalopods and fishmeal.
Fish products traded among industrialized countries are mostly from demersal species, which are traded in fresh, frozen whole and fillet form; lower-value pelagic species such as herring and mackerel, which are traded in fresh and frozen form; and fresh and frozen salmon. Developing countries' exports concern mainly tuna, small pelagics, shrimps, prawns, rock lobsters and cephalopods (octopus, squids and cuttlefishes). In the past, developing countries were involved primarily in exports of raw material for the processing industries of developed countries, but in recent years they have been increasingly involved in adding value to their products prior to export. In addition, a large part of the world's trade in fishmeal originates from developing countries in Latin America. Developing countries' imports concern mainly frozen small pelagics and cured, dried and smoked fish. There are also some imports of raw material (e.g. frozen tuna) for further processing (e.g. canned tuna) and re-export. Emerging markets (Hong Kong Special Administrative Region, Taiwan Province of China, the Republic of Korea, Malaysia and Singapore) are increasingly importing high-value commodities (rock lobster, squid, etc.) for domestic consumption.
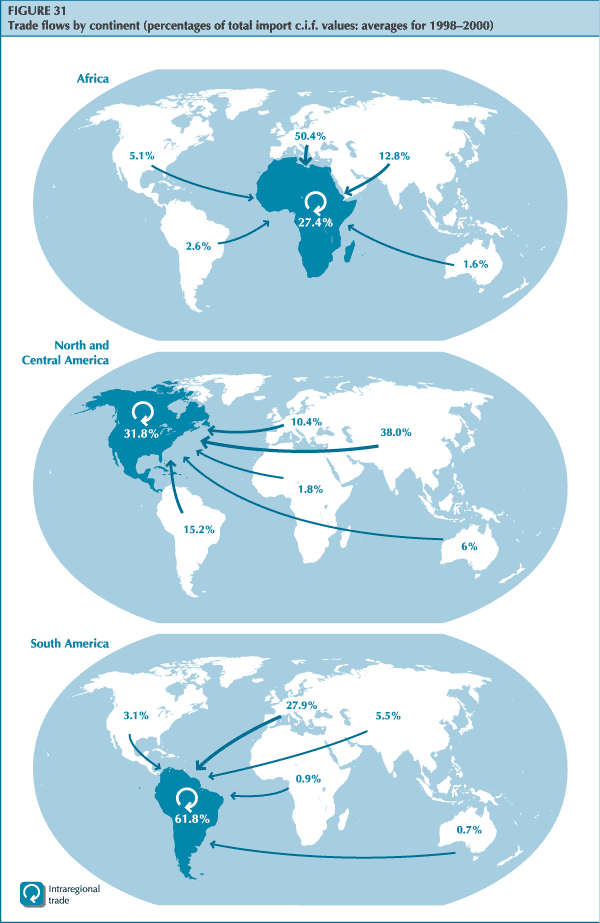
It should be noted that the overall picture presented by the maps in Figure 31 is not exhaustive. Although the countries that reported their imports (some 137 countries for the period 1998-2000) account for 98 percent of the estimated world total, some continental groups have incomplete coverage (e.g. only 40 percent of African countries reported their imports). In such cases, the data indicated should not be taken as the total trade flow of the continental groups to which they refer.
During recent years, international trade in fishery products has faced the following major issues: the change in quality control measures in the main importing countries towards a preventive Hazard Analysis and Critical Control Point (HACCP)-based strategy; the concept of risk assessment; general public concern regarding overexploitation of the resource; environmental concerns regarding aquaculture; and the discussion of traceability and labelling. The EC and the United States made HACCP plans mandatory for all plants producing fish products for their markets. While the United States enforces these measures through importers in the United States, the EC controls the competent authorities in the exporting countries. Risk assessment (i.e. analysis of the risk of consumers falling sick after consuming fish) is still being developed in many countries. The sustainable trade of fish - from either the wild or aquaculture - is of concern to consumers, especially in the developed world. Information about dangerous antibiotics in cultured fish species, or about overfished resources, scares consumers away from fish products. Mangrove depletion through shrimp aquaculture has also received negative press coverage recently. On 1 January 2002, the EC enforced a law on the traceability of fish, which obliges producers to indicate the following on product labels: the commercial name of the species and the Latin name; whether the fish comes from the wild or from aquaculture; the country of origin for freshwater wild and cultured fish; and the ocean of origin for wild marine species. A range of types of labelling, such as ecolabelling or organic product labelling, are being developed and used for fishery products, and this is creating confusion among consumers.
.gif)
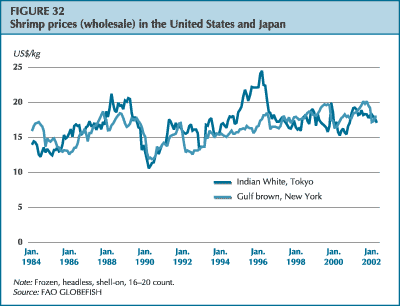
The economic crisis in Japan led to lower demand for shrimp. The main supplying countries had to reduce prices and look for other outlets in order to sell their production. The United States market was strong in 2000, but declined sharply in 2001. The dramatic events of 11 September increased the slowdown of the market. Demand for shrimp in Europe was improving in parallel with the overall economic situation; however, the low level of the euro undercut any substantial growth there. On 29 January 2002, the EC stopped imports of shrimp from China because of the strong presence of antibiotics in cultured shrimp from that country. In other Asian countries, the EC carried out close checks with regard to the presence of antibiotics. These countries prefer to sell to other markets, rather than risk having shipments destroyed at the EC border. This situation upset the international market for shrimp in the opening months of 2002, and prices were extremely low (Figure 32).
The disease problems that affected Ecuador and Central America in 1999 led to lower production of cultured shrimp in 2000 and also in 2001. Thailand continues to be the main shrimp aquaculture producer, with 250 000 tonnes, and cultured shrimp production is growing after the disease problems experienced there in 1996 and 1997.
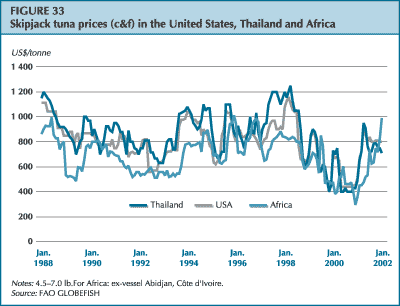
Tuna catches were strong in 1999, and skipjack prices declined to an unprecedented low, making fishing uneconomic. In mid-2000, the main tuna vessel owners created an organization with the aim of normalizing the market. This organization introduced stringent catch reduction programmes, which had an immediate effect on prices. During the course of 2001, members of the organization met regularly to ensure that catch reduction continued. Skipjack prices, which hit a low of US$350 per tonne in mid-2000, recovered to reach US$700 to $750 per tonne in May 2002 (Figure 33).
Thailand continues to be the main exporter of canned tuna to the United States market, but lower exports were experienced in 2001. The Philippines remained in second position. The use of tuna loins by Italian canners continues to expand. Loins as raw material now account for about 70 percent of total Italian canned tuna production. Ecuador and Colombia are benefiting from their special duty-free status as Andean community countries and are increasing their shipments to the EC.
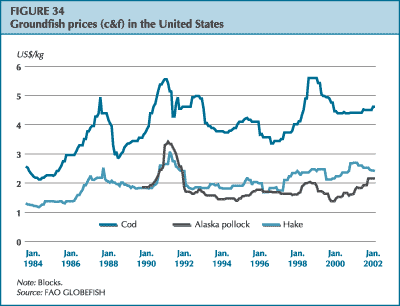
Groundfish supply was very limited in the first half of 2001. Alaska pollock supply was reduced in all main markets, and cod and hake also reported lower catches and less availability. Prices did not rise as much as expected (Figure 34), as other species (salmon and tilapia) are replacing groundfish in many markets.
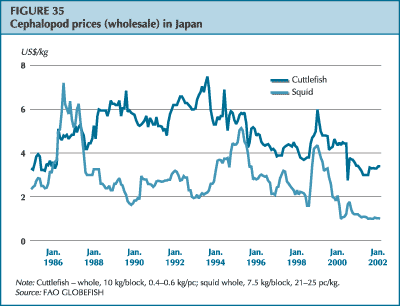
Squid fisheries were low in 2001; especially Illex catches from the Southwest Atlantic. Octopus catches in the Eastern Central Atlantic were good at the beginning of 2001, leading to higher exports to Japan. In a move to protect its octopus industry, the Moroccan Government fixed a minimum price. Japanese traders considered this price too high, however, and sales in this market dropped by 40 percent in 2001 compared with 2000 (Figure 35).
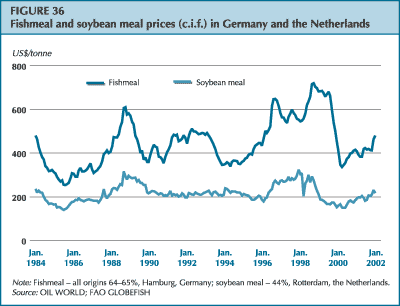
The bulk of fishmeal production - about 60 percent - is exported each year. In 2001, fishmeal production was an estimated 5.4 million tonnes, a 12 percent decrease from 2000. Various fishing bans and problems with jack mackerel resources in Chilean waters were the main cause of the reduced catch. Peruvian production was also relatively low. In 2001, the bovine spongiform encephalopathy (BSE) scare overshadowed the fishmeal market in Europe because, early that year, the EC prohibited the use of fishmeal in ruminants' diets. In most plants in the EC, feed for non-ruminants is prepared on the same production lines as feed for ruminants, and the legislation resulted in lower use of fishmeal in pig and poultry feeds as well. Peru and Chile lodged a complaint with the World Trade Organization (WTO) Sanitary and Phytosanitary (SPS) Committee (October 2001) to persuade the EC to lift the current restrictions on fishmeal usage. Fishmeal prices (Figure 36) are expected to increase as a result of good demand, especially from China and other Asian countries.
The overall climate of the fish oil market was good in 2001, with strong price improvements. Fish oil production in 2001 was slightly lower than in 2000, and there was little availability of fish oil on the market at the beginning of 2002. Competing vegetable oils seem to be in shorter supply than was initially forecast, and their prices are expected to move up. As a result, a further increase in fish oil prices is likely.
Fisheries policies and management strategies the world over are in a state of flux. Fisheries policy-makers and administrators are increasingly recognizing that fisheries resources must be developed and used in ways that are sustainable. However, continued attempts to use fisheries as the key to solving a complex web of social and economic issues threaten to overwhelm the basic fact that, if these resources are overfished, they will not sustain either social or economic development.
Especially where there is no integrated area management, fisheries management efforts are increasingly complicated by the impacts of a diversity of other activities - such as urbanization, shipping, tourism, deforestation and industrial wastes - on the heavily interdependent elements of the aquatic environment. There is growing recognition that principles, policies and mechanisms for identifying and prioritizing the uses of aquatic areas must be put in place so that the impacts of other sectors' activities on fisheries can be addressed. The need to implement ecosystem-based fisheries management is also being emphasized (see Implementing the ecosystem approach to capture fisheries management, Part 2, p. 55).
In both inland and marine fisheries, the pressures of intensified use, combined with other sectors' intensified use of the areas in which fisheries occur, are slowly but surely refocusing fisheries management on ways of allocating limited fisheries resources among growing numbers of stakeholders. There is growing recognition that overfished resources cannot serve as social security nets or food sources without creating civil strife over who can gain access to, and consume, the remaining fish and that overfished resources cannot be used as a platform from which to promote the ongoing support of profitable industrial fleets. Conflicts and conflict management are becoming key elements of fisheries management activities as the objectives of fisheries legislation and management rapidly expand to accommodate social, economic and environmental considerations.
In short, the demands of fisheries management have grown beyond the need to address purely biological issues, and must now address and attempt to resolve an array of social concerns and multiple-use issues. As a result, there is an urgent need to reconsider the use of many of the management approaches that have been used to date.
There is a steadily growing collective will in the international community of politicians and civil society to recognize and support the key role that fisheries play in economic development, food security, poverty alleviation and human health.
Developing countries are continuing their efforts to clarify the linkage between development activities and sustainable resource use. Both population and economic growth are putting enormous additional pressures on inland and marine fishery resources as contributors to food security and providers of a social safety net. At the same time, the use of domestic fisheries to generate foreign exchange is exacerbating allocation issues between artisanal and industrial fleets. The challenges facing developing countries, together with the need for capacity building, are making management (particularly allocation) a difficult task, but there are growing signs that these efforts will have an enduring positive effect on civil and economic development.
In developed countries, legislated principles of sustainability are driving fisheries management efforts to reverse the effects of previous overfishing, and efforts to address overcapacity are receiving considerable attention, although progress is slow. However, as developed countries focus on reducing overcapacity, increasingly intricate technical and social issues are complicating the efforts of fisheries managers. The impacts of displacement and redeployment - of both people and vessels - are becoming the most important, difficult and contentious elements of fisheries management.
Technical measures (e.g. gear, time and area restrictions) continue to dominate fisheries management efforts as methods for achieving the conservation of fish stocks. Such measures are globally recognized as having the potential to be effective, particularly in fisheries where overcapitalization is not a problem. However, there is also an increasing awareness that there are issues of overcapitalization in many fisheries and that, in such cases, these types of fisheries management measures have either failed to result in the conservation or sustainable use of fish stocks, or have only succeeded at considerable cost to society.
Furthermore, as resources become scarcer and are shared by increasing numbers of users, there is a growing awareness that the escalating economic and social costs arising from the use of technical measures need to be compensated for. Thus, as civil society is demanding both stock sustainability and an accounting of the economic and social costs of managing fisheries resources, there is inevitable pressure on managers to consider new or, at the very least, different approaches.
The use of incentives that affect fishers' behaviour and create opportunities for both conservation and economic efficiency is gradually drawing more attention. Despite the inherent benefits of such incentive-based management strategies as community-based quotas, territorial use rights and transferable quota systems, their uptake and application in the fisheries arena are not rapid. One possible alternative to the use of win-win approaches is the consistent and persistent growth of market-based business strategies, such as ecolabelling schemes, which aim to harness market forces and create financial rewards for people working in fisheries and satisfying sustainability and various social criteria.
In many instances, discussions regarding the adoption of incentive-based systems tend to be dominated by concerns relating to initial allocation formulas, consolidation and the exit and entry of participants - all of which can be accommodated in the design process. These concerns are understandable because such management strategies create very strong market incentives and tend to be implemented as a last resort when fisheries stocks are under pressure, overcapitalization is present and participants are unlikely to be in a position to alter their investment strategies. Unfortunately, however, discussions also tend to ignore the many lessons to be learned from the numerous and varied solutions that have emerged worldwide for coping with just such design concerns.2
At present, in part because the incentives generated by many regulatory controls are not being considered, fisheries management efforts regarding overcapacity are primarily concentrating on measuring, coping with and reducing it. Although such efforts are much needed, more emphasis should be placed on management strategies that prevent the initial development of overcapacity, thus avoiding the difficult and socially disruptive consequences of trying to reduce it.
Several different management approaches are emerging as ways of coping with management pressures. Increasingly, managers are seeking to optimize the use of public fisheries resources by devolving management to local levels, where there is a stronger sense of ownership, and through clearer definition of the community to which a resource may belong.
Efforts to broaden the involvement of stakeholder groups and make fisheries management decision-making more inclusive and representative are being made at all levels, from the international to the very local. Unfortunately, however, in the absence of a concomitant devolution of legislative, managerial, financial and administrative capacity, as well as of much-needed political will, many of these efforts do not fulfil their potential for building on local knowledge and skills. As a result, they tend simply to shift the responsibilities for management without necessarily passing the tools and opportunities that are needed for management success (see, for example, Regional fisheries governance, p. 48).
In other situations (especially where there have been conflicts over the sharing and de facto, if not explicit, allocation of limited or special fisheries resources), stakeholders have begun to turn to alternative fora such as private contractual agreements to resolve managerial and administrative fisheries issues. Such agreements have already been made between particular fishing companies and local communities, between fishers and processors and among members of fisheries organizations. Perhaps the most extreme examples of efforts to bring about more durable, effective and efficient outcomes are non-governmental initiatives from the conservation sector, the private sector and joint industrial-conservation partnerships. By challenging or supplanting existing administrative processes through the intensified use of legal and/or political platforms to achieve their results, such agreements circumvent the existing due processes of fisheries management authorities to bring about faster solutions.
The standard skills base for administering fisheries management needs to undergo rapid changes. Expanded demands on administrators, as well as budgetary constraints, are testing the capacity and capabilities of fisheries administrations the world over. As the principles of sustainable development are adopted, administrators become increasingly accountable for social, economic, financial, legal and governance issues, in addition to conventional conservation matters that draw on information from the natural sciences.
The growing demands of both consumers and harvesters, and the relatively limited capacity of fisheries resources are leading to conflicts over resource sharing. As a result, administrators and stakeholders, alike, need to learn and use a range of conflict management, alternative dispute resolution and mediation techniques.
The growing gaps in developed countries among international norms and regional and national legislative requirements, as well as the inevitable limits on budgets and scientific information, are creating an urgent need for capacity building. The expansion of alternative approaches, including precautionary approaches and those based on risk assessment, is beginning to mitigate the absence of detailed stock information with cost-effective and practical measures. At the same time, the practical aspects of expanding fisheries management to include entire ecosystems (see Implementing the ecosystem approach to capture fisheries management, Part 2, p. 55) are stretching the administrative and budgetary limits of fisheries management agencies.
Both developed and developing countries are grappling with the impacts of globalized trade on all aspects of the fishing industry. The fast-moving and far-reaching issues of catch certification, trade documentation and food quality assurances are creating incentives that alter harvesting, production and marketing strategies far more quickly than many fisheries administrations and regulatory processes can keep up with (see Catch certification and catch documentation, Part 2, p. 65). Although these changes are inevitable and not necessarily undesirable, many current management strategies are not equipped to cope with them. Issues of increasingly globalized trade, especially in developing countries, are altering incentives relating to industrialized fisheries and their ability to raise foreign exchange and drive economic development, but the strategic policy or planning groups of fisheries management agencies often do not include trade and development specialists.
The international community places great importance on subregional and regional fisheries cooperation in the conservation and management of fisheries. This is because many fish stocks are transboundary in character and cannot be managed by a single state.
Since 1945, some 30 subregional and regional RFMOs and arrangements have been established. Chapter 17 of Agenda 21, the United Nations Programme of Action from UNCED, the 1995 United Nations Fish Stocks Agreement and the 1995 FAO Code of Conduct for Responsible Fisheries highlight the role of RFMOs in implementing management measures designed to secure long-term sustainable and responsible outcomes.
The principle task of most RFMOs is to manage fisheries. Some of them do this well, others do not. Why are some of them underperforming? How can regional fisheries governance be strengthened?
International fora, such as the FAO Committee on Fisheries (COFI) and academic journals, discuss the role and activities of RFMOs. Discussion usually focuses on organizational efficiency and the nature and extent of their work, but it is difficult to assess performance in the absence of agreed benchmarks. At an FAO meeting in 2001, RFMO representatives supported, in principle, the need to develop performance indicators for RFMOs and related guidelines, while recognizing that some organizations already used sustainable development indicators to assess their performances.
Inaction is the main manifestation of underperformance. Inaction is an issue for most RFMOs because they work through consensus, which is often very difficult to achieve. Reducing the possible sources of conflict would seem to be a good way of enhancing trust among members. To that end, it has been suggested that each RFMO should establish agreed scientific standards for stock assessment, procedures for revising allocation, information sharing concerning foreign fleets, and standards in respect of port state responsibilities.
Despite the shortcomings in regional fisheries governance, some RFMOs have focused on innovative regional cooperation as a means of enhancing management. Innovations have been adopted to address IUU fishing. Both contracting and non-contracting parties to RFMOs, as well as flag vessels from open registries, have been involved in IUU fishing, which undermines efforts to manage fisheries in a responsible manner. Port and trade measures to deter the laundering of IUU-caught fish are being promoted and implemented by a growing number of RFMOs. Such measures are quite revolutionary, and until recently they would not have been considered appropriate for combating fisheries management problems. This new situation indicates a change in mood on the part of the international community in its desire to curb IUU fishing and related practices.
A burning issue for RFMOs is their capacity and willingness to accommodate new entrants in a fair and consistent manner. Failure to address membership, capacity, allocation and equity issues could endanger the future work of RFMOs and lead to increased IUU fishing. The lack of agreed criteria caused a split in the International Commission for the Conservation of Atlantic Tunas (ICCAT) in recent years, hampering the organization's ability to deal productively with other problems. In late 2001, however, ICCAT reached an innovative solution for dealing with allocations, including those for new entrants.
RFMOs are needed to facilitate and reinforce regional cooperation. Over the next decade, RFMOs will face the challenge of implementing parts of Agenda 21, the 1995 UN Fish Stocks Agreement and the 1995 FAO Code of Conduct for Responsible Fisheries. However, unless RFMO members cooperate more closely and are prepared to take difficult decisions, which could have adverse short-term social and economic costs on their way to achieving longer-term sustainability gains, even large amounts of scientific research, funding and enforcement will not improve the effectiveness of these organizations.
In order to strengthen the work of RFMOs in a real and effective manner, some basic issues concerning performance must be addressed. States must commit themselves to initiatives that provide the necessary mitigation measures, even though those initiatives might also disadvantage fishers in the short term. Difficult choices must be made to support sustainable solutions. The greater involvement of stakeholders, including industry, in the work of RFMOs could enhance their performance and effectiveness, especially if they are convinced of the need to implement tough and difficult decisions.
The Agreement for the Implementation of the Provisions of the United Nations Convention on the Law of the Sea of 10 December 1982 relating to the Conservation and Management of Straddling Fish Stocks and Highly Migratory Fish Stocks (1995 UN Fish Stocks Agreement) was adopted on 4 August 1995. It entered into force on 11 December 2001, one month after the thirtieth instrument of ratification or accession had been deposited with the Secretary-General of the United Nations.
The purpose of the 1995 UN Fish Stocks Agreement is to facilitate the implementation of certain provisions of the 1982 United Nations Convention on the Law of the Sea (1982 Convention) concerning the conservation and management of straddling fish stocks and highly migratory fish stocks. The agreement complements the 1993 FAO Agreement to Promote Compliance with International Conservation and Management Measures by Fishing Vessels on the High Seas (1993 FAO Compliance Agreement) and the 1995 FAO Code of Conduct for Responsible Fisheries.
Implementation of the 1995 UN Fish Stocks Agreement presents major challenges for both states and subregional or regional RFMOs. Underpinning its implementation is the requirement for concerted international cooperation. States that adhere to one or both of these agreements, either directly or through RFMOs, are obligated to cooperate to ensure the effective conservation and management of straddling fish stocks and highly migratory fish stocks.
Even before the agreement entered into force, states - individually and in cooperation with each other - had been engaged in a range of initiatives designed to promote its implementation. Since 1995, some states have adopted new laws and/or regulations to ensure that they are in a position to exercise greater flag state control over the activities of their flag vessels when those vessels are operating on the high seas. Moves to strengthen these controls have gathered momentum as the concerns regarding IUU fishing have increased in international fora, including sessions of the United Nations, FAO and RFMOs (see Box 8). States' political will to address these and related conservation and management problems, which undermine the work and effectiveness of RFMOs, has been highlighted as being essential to meeting the challenges of these concerns.
The 1995 UN Fish Stocks Agreement places RFMOs in a pivotal and central position in terms of its implementation; they provide the primary mechanism through which participating states should cooperate to achieve enhanced resources conservation and management. Some RFMOs whose mandates extend to the conservation and management of straddling and highly migratory fish stocks have reviewed, or are in the process of reviewing, certain provisions of their respective conventions to ensure that they are consistent with the agreement. In some cases, substantial changes to conventions have been proposed or introduced. Despite these developments, however, RFMOs are grappling with practical aspects of the agreement's implementation, such as how to apply the precautionary approach in fisheries management, how to implement ecosystem management and how to address transparency.
The 1995 UN Fish Stocks Agreement has spawned two new RFMOs: one dealing with the management of straddling fish stocks and the other with highly migratory fish stocks.
The initiatives to establish the Southeast Atlantic Fisheries Organization (SEAFO) and the Western and Central Pacific Tuna Commission were taken essentially for the same reasons, and had the goals of:
The Convention on the Conservation and Management of Fisheries Resources in the South East Atlantic Ocean, which paves the way for the establishment of SEAFO, opened for signature on 20 April 2001. Its purpose is to ensure the long-term conservation and sustainable use of the fishery resources in the convention area through effective implementation of the convention. Negotiations for the establishment of SEAFO took place over a five-year period. When it opened for signature, the convention was signed by seven states and the EC.
BOX 8 Illegal, unreported and unregulated fishing IUU fishing and its impact on resource sustainability is a matter of high international concern. It is recognized that if IUU fishing and its related activities are not addressed effectively and holistically, efforts by national administrations and RFMOs to manage fisheries responsibly will be undermined. With this situation in mind, on 2 March 2001 the Twenty-fourth Session of COFI adopted by consensus the International Plan of Action to Prevent, Deter and Eliminate Illegal, Unreported and Unregulated Fishing (IPOA-IUU). Subsequently, on 23 June 2001 the FAO Council, at its Hundred-and-twentieth Session, endorsed the IPOA-IUU. The IPOA-IUU is a voluntary instrument concluded within the framework of the 1995 FAO Code of Conduct for Responsible Fisheries. It encourages action by states and RFMOs to address IUU fishing. The IPOA-IUU is innovative in a number of respects, especially regarding the use of internationally agreed market-related measures to combat IUU fishing. Significantly, the IPOA-IUU calls on states to develop and implement national plans of action - aimed at achieving the goals of the IPOA - not later than three years after its adoption (i.e. 23 June 2004). To support the implementation of the IPOA-IUU, FAO has issued Technical Guidelines for Responsible Fisheries No. 9, Implementation of the International Plan of Action to Prevent, Deter and Eliminate Illegal, Unreported and Unregulated Fishing (2002, Rome). This document provides practical guidance on implementation of the IPOA-IUU for states, RFMOs and other interested parties. To disseminate information about the IPOA-IUU, FAO has also issued a non-technical document entitled Stopping illegal, unreported and unregulated fishing. It is intended to provide information to fishers, fishing communities and the public. Source: D. Doulman, FAO Fisheries Department. |
The convention area is based on FAO's Statistical Area 47. It covers high sea areas only, and abuts the EEZs of four coastal states: Angola, Namibia, South Africa and the United Kingdom (the overseas territory of Saint Helena and its dependencies of Tristan da Cunha and Ascension Island).
SEAFO will manage stocks that straddle the EEZs of coastal states and the adjacent high seas. Species subject to management may include alfonsino, orange roughy, armourhead, wreckfish and deepwater hake. SEAFO will also manage discrete high seas stocks, such as that of red crab, even though discrete stocks are not subject to the provisions of the 1995 UN Fish Stocks Agreement. The management of these latter stocks is a logical and practical consequence of the characteristics of the region's geography, stocks and stock distribution, and fisheries management needs. The convention does not address the management of highly migratory stocks, as these are already subject to management by ICCAT.
Key aspects of the SEAFO Convention are the establishment of a commission, a secretariat and compliance and scientific committees; the application of the precautionary approach, contracting party obligations,3 flag state duties, port state duties and measures taken by a port state; observation, inspection, compliance and enforcement; decision-making; cooperation with other organizations; ensuring the compatibility of conservation and management measures and fishing opportunities; recognition of the special requirements of developing states in the region and of non-parties to the convention; and implementation.
The Government of Namibia has established an interim secretariat to facilitate implementation of the convention. It will fulfil this role pending the convention's entry into force and the full implementation of administrative arrangements. The interim secretariat will implement interim arrangements relating to the authorization and notification of fishing vessels, vessel requirements and scientific observation, and the collection of information to support stock assessment.
The Convention on the Conservation and Management of Highly Migratory Fish Stocks in the Western and Central Pacific Ocean opened for signature on 5 September 2000 after four years of complex and intense negotiations. Over the 12-month period that the convention was open for signature, 19 states signed it. In addition, a representative of Taiwan Province of China signed an Arrangement for the Participation of Fishing Entities on 5 September 2000.
The convention provides a balance between coastal state and Distant Water Fishing Nation (DWFN) interests in a number of important areas (e.g. entry into force of the convention and decision-making). It will enter into force 30 days after the deposit of instruments of ratification, acceptance, approval or accession by three states situated north of the 20 °N parallel (i.e. DWFN) and seven states situated south of the 20 °N parallel (i.e. coastal states of the region). If within three years of its adoption (i.e. by September 2003) the convention has not been ratified by three states situated north of the 20 °N parallel, it will nevertheless enter into force six months after the deposit of the thirteenth instrument of ratification, acceptance, approval or accession.
The purpose of the convention is to ensure the long-term conservation and sustainable use of highly migratory fish stocks in the Western and Central Pacific Ocean through effective management, in accordance with the provisions of the 1982 Convention and the 1995 UN Fish Stocks Agreement. The convention applies to the management of all highly migratory fish stocks in the region, but principally to the highly valuable and extensive tuna species in the convention area - especially skipjack, yellowfin, bigeye and Southern albacore tunas.
The convention area is extensive, covering a tract of the Pacific Ocean that is defined by geographic coordinates in the south and east. In the west and north, because of a number of difficult and sensitive political issues, boundaries are defined by reference to the migratory range of the stocks. In this way the commission, based on its cooperative arrangements with other relevant RFMOs, will define the area of applicability of conservation and management measures for particular species.
The convention seeks to build on established regional arrangements that have been tried and tested (e.g. the regional observer scheme) and to minimize costs and avoid duplication through the use of existing regional organizations (e.g. the scientific expertise of the secretariat of the Pacific Community's Oceanic Fisheries Programme).
The convention provides for, inter alia, the establishment of a commission, a secretariat and scientific and technical and compliance committees; decision-making, transparency and cooperation with other organizations; obligations of members of the commission; duties of the flag state; compliance and enforcement, a regional observer programme and regulation of transhipment; requirements of developing states; peaceful settlement of disputes; and requirements regarding non-parties to the convention.
In preparation for the convention's entry into force, the final session of the Western and Central Pacific Ocean Tuna Conference established a preparatory conference, which started work in April 2002. Its purpose is to establish the organizational and financial framework for the new commission and its subsidiary bodies, in order to ensure that, when established formally, the commission will commence operations effectively and with minimum delay. The conference will also begin the process of collecting and analysing data on the status of the fish stocks and, if necessary, recommend conservation and management measures. It is envisaged that the preparatory conference will complete its work by September 2003.
1 FAO. 2002. Inland capture fishery statistics of Southeast Asia: current status and information needs, by D. Coates. RAP Publication 2002/11. Bangkok, FAO Regional Office for Asia and the Pacific. 121 pp.
2 See, for example, the discussions on initial allocations of trans-ferable fishing (effort) or fish (catch) quotas for more than 23 fisheries in: FAO. 2001. Case studies on the allocation of trans-ferable quota rights in fisheries. FAO Fisheries Technical Paper No. 411. Rome.
3 Contracting party obligations in Article 6(a) require that a party ensure that its nationals fishing in the convention area and its industries comply with the provisions of the convention.