![]()
![]()
![]()
by
G.R. Akande and A.A. Ajayi
Nigerian Institute for
Oceanography and Marine Research,
Victoria Island,
Lagos,
Nigeria
C. Ogunweno and M.T. Ash
Department of Marine Biology and
Fisheries,
University of Lagos, Akoka,
Lagos, Nigeria
|
Abstract Proximate composition, physical appearance and sensory characteristics of smoked croaker Pseudotolithus senegalensis using sawdust and firewood were compared. Storage studies were carried out at ambient and refrigerated temperatures on smoked fish packed in Low Density Polyethylene (LDPE) and High-Density Polyethylene (HDPE) bags. The protein, moisture, lipid and ash of the smoked fish ranged from 60 - 70%, 14 - 26%, 2 - 3% and 8 - 10% respectively. Sensory evaluation of the products was similar except for the sawdust-smoked fish, which gave a better appearance and texture. Visual examination for mould growth showed a pronounced infestation in smoked fish stored in the refrigerator compared to ambient temperature storage. Smoked fish stored at ambient temperature kept better than those stored in the refrigerator irrespective of the source of fuel energy and packaging materials. HDPE packaged products were less susceptible to spoilage compared to LDPE packaged smoked fish. |
1. INTRODUCTION
Fish smoking is an age long method of processing fish in Nigeria. However, the process is laborious with associated drudgeries. In order to remove these drudgeries and to conserve wood fuel energy, efforts must be geared towards research and development of improved smoking kilns and alternative sources of energy in fish processing.
The use of firewood, though a traditional energy resource in fish smoking, is an increasing environmental concern. Most type of wood, hard or soft, can be used for smoking fish. Red mangrove wood, which is available in tropical countries, burns well even immediately after cutting. Hard wood being the best burns slowly and produces more smoke than softwood. Smoking demands great quantities of firewood, and this demand grows as the movement of fresh fish becomes more difficult because of poor access roads, an increase in the amount of fish being landed and the need for disposal to market outlets (Ssali, Reynolds and Ward, 1992). Localised shortages of fuel wood are known to be due in whole or part to the activities of fish processors. Wood is becoming scarce and expensive, eroding the profit of the processors who often have to purchase it. The situation is now known to be critical in fishing villages and urban centres where fish processing takes place on a daily basis. The shortage of fuel-wood coupled with increasing cost of the ones available warrants deep concern and urgent attention to guarantee continuous production of smoked fish both for home consumption and export markets.
Research and development work on alternative fuels for use in fish smoking has been minimal thus far and should now be seriously looked into as part of future trends in the area of fish processing. Some alternatives presently in use either separately or in combination with firewood include such materials as palm nut, coconut husk and sugar cane trash. Waste wood products such as shavings and sawdust offer likely possibility in Nigeria.
The objective of the work is to look at the use of sawdust as a potential alternative to firewood in fish smoking using an improved Chorkor oven and thereafter do a comparative chemical and sensory analysis of the smoked product.
2. MATERIALS AND METHODS
Raw material preparation
The fish species used for this experiment was croaker, Pseudolithus spp. The fish were de-scaled and degutted before washing thoroughly to remove blood and slime and thereafter split open to increase the surface area of the fish during smoke-drying. The energy sources were firewood and sawdust. The fish were then brined to improve their flavour and enhance their shelf life. They were then drained for about 30 minutes before smoke drying in an improved Chorkor oven.
Smoking process
The fish were then divided into two batches; one batch was smoked-dried using sawdust, while the other batch was equally smoked using firewood. Sawdust and hard wood were obtained from sawmill and local wood sellers from Lagos respectively. Firewood was bought while sawdust was obtained free of charge except for the cost of transportation to the processing area. The smoking was done using improved Chorkor oven. The time taken to smoke-dry the fish samples with firewood was 5 hours, while it took 21 hours using sawdust. On completion of this process, the fish were left to cool and subsequently packaged in low density and high-density polyethylene bag and sealed.
Sawdust and wood consumption
Sawdust and wood consumption were measured by weighing a load of wood or sawdust at the start of the experiment. Any remaining or partially burnt sawdust or wood at its completion is then weighed. Sawdust and wood usage were expressed as:
the actual amount of sawdust or wood used.
the weight of sawdust or wood used per kg of fresh fish.
the weight of sawdust or wood used per kg of smoked fish.
Storage trials
Smoked fish products were packed in low-density polyethylene (LDPE) bags and stored in a refrigerator at 5°C and also at ambient room temperature of 30±2°C.
Sensory evaluation
This was undertaken to determine the taste, odour, texture and general appearance of the smoked products. Taste panels of six members already familiar with scoring smoked fish were given the products scores at every two-week interval. Products were scored on a scale of 8 - Excellent, 7 - Very Good, 6 - Good, 5 - Fairly good, 4 - Fair, 3 - Poor, 2 - very poor and 1 - extremely poor.
Analysis
Proximate composition of the smoked fish was determined. Moisture was determined by the oven-drying method at 103±2ºC; crude protein by the Kjeldahl procedure (factor 6.25, Pearson, 1981), total lipid by the Bligh and Dyer (1959) method, and ash by incineration at 525ºC. Visual examinations of the samples were carried out regularly to check for mould growth or insect infestation.
3. RESULTS AND DISCUSSION
Proximate composition
Table1: Percentage moisture and ash contents of smoked croaker during storage at refrigerated and ambient temperatures.
|
Source of energy |
Method of |
Mode of |
Moisture (%) |
Ash (%) |
|
Firewood |
LDPE |
Refrigerator |
26.23±2.64 |
9.58±1.72 |
|
Sawdust |
HDPE |
|
24.75±2.91 |
8.61±1.54 |
|
Sawdust |
LDPE |
|
26.62±1.42 |
10.14±0.51 |
|
Sawdust |
HDPE |
|
26.48±0.79 |
8.11±1.11 |
|
Firewood |
LDPE |
Ambient |
14.66±0.82 |
8.19±1.60 |
|
Firewood |
HDPE |
|
14.72±0.95 |
8.30±1.59 |
|
Sawdust |
LDPE |
|
15.52±1.41 |
9.39±0.89 |
|
Sawdust |
HDPE |
|
14.47±0.31 |
9.06±0.70 |
Note: Data are mean of triplicate determinations ± standard deviation LDPE - Low density polyethylene HDPE - High density polyethylene
The average proximate composition of smoked Croaker is 25% moisture, 60% protein, 8% lipid and 7% ash. Table 1 shows the moisture and ash contents of the two smoked products stored under two different storage regimes. The high ash contents in the two products under different storage regimes may be as a result of the analysis carried out on the whole fish inclusive of the bones. Increased moisture content in smoked fish kept in the refrigerator operating at 5oC, with storage time is due mainly to absorption of water and constant opening of the refrigerator which is the normal practice if the fish had been stored at home. On the other hand, the product stored at room temperature exhibit a fairly stable degree of moisture content throughout the storage period.
Moulds and insect infestation
The development of moulds and insect infestation as a measure of the rate of spoilage were less pronounced in the smoked fish stored at room temperature than in those stored in the refrigerator. This is expected because of the high moisture content of the products kept in the refrigerator, which favoured the development of moulds in the early stage of storage. In the sawdust smoked fish, they were generally found to be less prone to spoilage - mould growth and insect infestation - possibly due to low moisture, heavy deposit of smoke drying. This aromatic hydrocarbon components of the smoked deposit, having an effect on micro-organisms may have protected the fish smoked with sawdust more so than that smoked with firewood. Mould growths were usually noticeable in the dorsal region of the split fish while other part of the flesh and the skin was not so much affected.
Sensory assessment
Table 2: Sensory evaluation of smoked croaker fish during storage at refrigerated and ambient temperatures
|
Source of |
Method of |
Mode of |
Organoleptic parameters |
|||
|
Texture |
Odour |
Taste |
Appearance |
|||
|
Firewood |
LDPE |
Refrigerator |
6.8±0.14 |
6.9±0.47 |
7.8±0.35 |
7.3±0.80 |
|
Firewood |
HDPE |
|
7.0±0.30 |
7.2±0.16 |
7.9±0.29 |
7.1±0.63 |
|
Sawdust |
LDPE |
|
7.1±0.23 |
7.1±0.44 |
6.8±0.55 |
7.9±0.31 |
|
Sawdust |
HDPE |
|
7.2±0.45 |
7.0±0.37 |
6.8±0.42 |
7.5±0.64 |
|
Firewood |
LDPE |
Ambient |
7.2±0.42 |
6.7±0.60 |
7.4±0.48 |
6.9±0.49 |
|
Firewood |
HDPE |
|
7.2±0.82 |
6.6±0.57 |
7.0±0.27 |
6.9±0.53 |
|
Sawdust |
LDPE |
|
7.3±0.33 |
6.3±0.54 |
6.9±0.38 |
7.3±0.41 |
|
Sawdust |
HDPE |
|
7.6±0.25 |
6.3±0.26 |
7.0±0.60 |
7.1±0.39 |
Note: Each result is mean ± standard deviation of eight panellist response on a scale of 8 = excellent, 7 = very good, 6 = good, 5 = fairly good, 4 = fair, 3 = poor, 2= very poor and 1 = extremely poor
Sensory assessment as judged by taste panellists is presented in Table 2. Fish smoked using sawdust were found to be better in terms of appearance with scores of between 7.0 and 8.0 (Excellent to Very good) when compared with firewood smoked products with a score of 7.0 (Very good). The appearance of smoked fish is usually judged based on the black golden lustre, which the heavy smoke of the sawdust may have conferred on the product as opposed to the firewood. The panellists judged the sawdust smoked fish slightly firmer in texture than the firewood smoked fish. This may also be explained from the fact that the low fire characteristic of burning sawdust as opposed to the initial high heat produced from firewood may have prevented case hardening of the fish and thereby making the texture more acceptable to taste panellists. Clifford et. al. (1980) observed that the extent of smoked fish texture, toughness and dryness is greatly influenced by loss of moisture during smoking and also protein denaturation effect. In terms of taste and odour, the panellists scored the firewood-smoked products slightly better than the sawdust smoked fish.
Packaging
Packaging was found to have an effect on the storage life of the smoked products irrespective of the mode of storage. High-density polyethylene (HDPE) gave a better protective storage and therefore longer shelf-life of the product when compared with low density polyethylene (LDPE) bags, the reason being that HDPE has a lower gas and water vapour permeability compared to LDPE.
Fuel consumption and cost analysis
Table 3: Technical performance of smoked fish using sawdust and firewood
|
Treatment |
Wt of fish |
Wt of |
% wt loss |
Fuel used |
Kg of fuel |
Kg of fuel |
Cost of |
|
Sawdust |
40.0 |
13.40 |
66.50 |
23.5 |
0.59 |
1.75 |
4.65 |
|
Firewood |
40.0 |
13.60 |
65.75 |
21.5 |
0.54 |
1.58 |
6.40 |
The improved Chorkor oven used in this study was found to be fuel-efficient (Table 3) either in the use of firewood or sawdust as can be seen in the data on the weight of fuel material per Kg of fresh and smoked fish. Stroud (1989) reported similar findings for Chorkor mud oven as being the most fuel efficient in a study on the technical performance of different smoking ovens in Ghana.
The design of the new improved Chorkor oven is such that heat loss is minimised by introduction of a heat reflector at the base of the covering hood. This allows for a backward reflection of escaping heat on the fish in the topmost trays (Akande, Oladosu and Tobor, 1998).
The firewood used in smoking 1 kg of fresh fish cost N.6.40 ($0.06) while for the sawdust, it could be taken to cost nothing since the sawdust is not bought. However, if the cost of transportation (N.100) of the sawdust is put into consideration, then the sawdust used in smoking 1 kg of fresh fish cost less than N.4.65 ($0.04). The cost that was assigned for transporting the quantity of sawdust used for smoking 1 kg of fresh fish was exaggerated because the sawdust that was transported at a cost of N.100 can smoke several batches. Nevertheless, it is clear that the use of sawdust can be an important source of saving of fuel costs compared to firewood. It is important to note that the transportation cost does not apply to firewood because of availability in all locations and within the reach of fish processors both in the rural and urban centres, especially where there are smoking activities.
4. CONCLUSION
Sawdust can be obtained at practically no cost and is therefore an attractive alternative to firewood. Initially, a combination of sawdust and wood may be used with the women smokers as a prelude to getting them used to the sawdust. Sawdust can be made into briquettes, which will reduce waste and constant replenishment. The 16 hrs used in smoking as compared to 5 hours for the fish smoked using firewood can be a disadvantage because it means that the labour cost may be higher for the longer smoking period. However, if this is however weighed against the compensation that may be derived from the low cost of sawdust and consideration given to the fact that fish smokers in the villages are used to smoking fish overnight, the advantages may therefore outweigh the disadvantages.
The use of HDPE was found to have increased the shelf life of the two products irrespective of storage conditions either at room or refrigerator temperatures. The low gas and vapour permeability of HDPE was responsible for this and as such is recommended for packaging smoked fish. LDPE and HDPE are both available locally and have been used in packaging of other foodstuffs including street foods in Nigeria without much adverse effects. The time difference between the production and consumption of smoked fish products may not be long enough for the superiority of any of the two packaging materials to be noticeable.
5. REFERENCES
Akande, G.R., Oladosu, H. and Tobor, J. G. (1998): A comparative technical and economic appraisal of two traditional and a new Magbon-Alade fish smoking ovens. In Conference Proceedings of 6th FAO Expert Consultation on Fish Technology in Africa, Kisumu, Kenya, 27-31 August, 1996 FAO, Rome.
Bligh and Dyer (1959): A rapid method for total lipid extraction and purification. Canadian Journal of Biochemistry and Physiology, 37, pp. 911-917
Clifford, M.N., Tang, S.L. and Eyo, A. A. (1980): Smoking of Foods. Process Biochemistry, 6/7, 5p.
Pearson, D (1981): The chemical Analysis of foods. 8th Edition. Churchill Livingstone, London
Ssali, W.M., Reynolds, J.E. and Ward, A.R. (1992): Fish and fuel, Food and forest: Perspectives on post harvest losses in Uganda. In: proceedings of the symposium on post harvest fish technology, FAO, CIFA Technical Paoer No. 19.
Stroud, G.D. (1989): A technical and economic Appraisal of Artisanal Smoking Ovens in Ghana. In: Conference proceedings of 4th FAO Expert Consultations in Africa, Abidjan. 25-28 April, 1988. FAO Rep., (400) Suppl. 34p FAO, Rome.
by
G.R. Akande[3], A.R. Ward[4], D. Jeffries2 and D. Odogbo[5]
|
Abstract A load tracking experiment was undertaken to quantify the losses during loading, unloading and transport of smoked fish from Maiduguri to Lagos. Two types of loss were considered; actual loss (physical loss) and the increase in weight of broken pieces (quality loss). Replicate measurements were taken to allow an assessment of the accuracy of the loss estimates. Paired t-tests were used to assess whether the losses were significantly different from zero, at the 5% level. The fish were purchased at Maiduguri market, then sorted before being packed into ten cartons. The load tracking exercise followed these ten cartons from packing and loading in Maiduguri through to off loading in Mile 12 market Lagos. Regression techniques were used to show that as the weight of the fish in a carton increased there was a tendency for the weight of broken fish to decrease. Results also showed that by the end of the exercise the cartons were heavier than they were at the beginning. This was very small relative to the weight loss of the fish. It may have been caused by oil and water uptake by the packaging material. |
1. INTRODUCTION
World-wide production of fisheries products is around 100 million tonnes per annum. A proportion of this is used for fishmeal production and the rest for human consumption. It is widely recognised that not all fish that is harvested with the intention of being used for human consumption actually reaches the consumer. There may be real physical and quality losses because of inadequacies in the handling, preservation, processing and distribution of fish and fishery products. Post-harvest fish losses in the Nigerian artisanal fisheries continue to be quoted as being very high (30-40 per cent of the catch). The estimated and determined figures for the Lake Chad fisheries range from 22-56 per cent for dried unsalted fish (Osuji, 1977, Mills, 1979; Moes, 1980).
The magnitude of the loss that occurs between capture and consumption are difficult to measure for several reasons:
Little effort had been made to develop systematic and practical assessment methodologies that can generate accurate information in post-harvest fish losses.
Much of the historical data available on post-harvest fish losses, especially loss levels are derived from limited and unsystematic observations and studies.
In many cases, the type of loss being measured and the way data have been collected and interpreted are not clear.
Therefore, there was hitherto no reliable data, which could have formed the basis of appropriate interventions.
The above shortcomings led to the development of three loss assessment methods (Ward and Jeffries, 2000) through a joint research project between the West African Association for the Development of Artisanal Fisheries (WADAF) and the Natural Resources Institute (NRI). The three methods are the Informal Loss Assessment Method (IFLAM), the Questionnaire Loss Assessment Method (QLAM) and the Load Tracking (L).
A load tracking experiment was undertaken, among others to quantify the losses during loading, unloading and transport of smoked fish from Maiduguri to Lagos. Two types of losses were considered; actual loss (physical loss) and the increase in weight of broken pieces (quality loss). The study was also conducted to assess the feasibility of combining the principle of load tracking with that of collecting statistically valid data and tests to measure loss of smoked fish due to loading, unloading and long-distance transport by lorry from Maiduguri to Lagos.
2. MATERIALS AND METHODS
Three grades of whole smoked catfish fish (Clarias gariepinus) are sold in Maiduguri market. Grade 1, being the best quality and most expensive, grade 2, of medium price and quality with grade 3 having the lowest quality and price. Grade 2 medium sized fish was chosen for this exercise, because it was the most commonly available product and therefore the most representative. The traders themselves performed the categorisation and although the same fish were graded by different traders, traders in Maiduguri and traders in Lagos, there appeared to be consistency in their choices.
A sample size of ten cartons of smoked fish was chosen to give a compromise between precision and cost. Ten cartons gives nine degrees of freedom for the variance estimate, which should be viewed as a minimum for this type of experiment. The load tracking exercise followed these ten cartons from packing and loading in Maiduguri through to off loading in Mile 12 market in Lagos.
Two market operators randomly chosen by the researchers filled the cartons in a traditional manner. After filling, the cartons were tied with rope according to local practice. The cartons were numbered 1 to 10 with a marker pen.
The next stage in normal practice of the trade would be either to store the packed cartons or load them onto a lorry for onward transport to Lagos. However, for the load tracking exercise the cartons were carefully unpacked and the weight of the carton, the fish and the proportion of broken fish were taken using a dial weighing scale. Market operators, simulating the standard practice sorted the broken fish from the whole fish. The fish, including the broken pieces were re-packed into the cartons and stored ready for transport. Great care was taken not to introduce losses during the unpacking, weighing and re-packing procedures. Any doubts regarding losses as a result of these procedures, a load tracking exercise of this stage can be undertaken to assess any losses introduced.
The ten cartons were systematically assigned to separate packing levels in the lorry, but within each level a carton was randomly located. This was to reduce bias, which would be caused by locating all the experimental cartons in a small number of levels. The cartons were loaded on to the lorry in the usual manner with minimum interference from the researchers.
The lorry was packed with 900 cartons, mainly of the "Lagos" type, which constituted a full load. The lorry was loaded on a Thursday and left Maiduguri the next day. It arrived in Lagos on Saturday during the night and was unloaded on Sunday morning. The unloading and weighing procedure was exactly the same as in Maiduguri, with the contents of each carton being carefully emptied onto a tarpaulin. The market operators then sorted the fish into whole and broken categories. It is of course impossible to ensure identical grading of fish in Maiduguri and Lagos, but it was clear that the methods were consistent. As in Maiduguri the relevant weights were recorded. After this procedure, the experimental cartons were re-packed and sold, recovering some of the expenses and thus reducing the cost of the experiment.
Table 1. Timetable of key load tracking activities
|
Date |
Activity |
Time |
Duration |
|
15.03.00 |
Smoked fish bought |
9.00 |
45 mins |
|
Mixing and packing |
9.45 |
15 mins |
|
|
Cartons unpacked and fish graded into broken and unbroken, loss measured. |
10.30 |
1 hr 15 mins |
|
|
Cartons stored |
11.45-18.00 |
6 hrs 15 min |
|
|
Loading of cartons onto lorry |
18.00 |
|
|
|
Cartons left on lorry |
|
42 hrs |
|
|
17.03.00 |
Cartons arranged on lorry |
12.00 |
8 hrs |
|
Lorry leaves for Lagos |
Approx. 20.00 |
Approx. 24 hrs |
|
|
18.03.00 |
Lorry arrives in Lagos |
21.00 |
|
|
Cartons left on lorry |
|
13 hrs |
|
|
19.03.00 |
Cartons unloaded |
10.00 |
|
|
Fish unpacked and loss measured. |
11.00 |
1hr |
A secondary exercise measured the loss between purchasing and packing, before the load tracking experiment began. Data was also collected from informal interviews with traders and operators at Maiduguri smoked fish market and Mile 12 wholesale smoked fish market in Lagos. These provided an understanding of where and why losses might be occurring and possible interventions to reduce these losses.
The ambient daytime temperature in Maiduguri for the period of the exercise reached 38ºC, but the temperature at night was much lower. Conditions were generally bright during the day with very little breeze.
Table 1 gives an overview of the key activities, which took place as part of the load tracking exercise.
Statistical analysis
Replicate measurements were taken to allow an assessment of the accuracy of the loss estimates. Paired t-tests were used to assess whether the losses were significantly different from zero, at the 5% level. The use of paired samples is important for valid comparison of data of this type where there is a before and after measurement within each carton.
3. RESULTS AND DISCUSSION
Table 2. Data from loss assessment load tracking.
|
Carton |
Before |
After |
||||
|
Weight of |
Weight of |
Weight of |
Weight of |
Weight of |
Weight of |
|
|
1 |
12.05 |
1.15 |
0.6 |
11.15 |
1.2 |
0.95 |
|
2 |
12.5 |
1.2 |
0.65 |
11.55 |
1.4 |
0.75 |
|
3 |
12 |
1.25 |
0.6 |
11 |
1.4 |
1 |
|
4 |
12.25 |
1.3 |
0.45 |
11.35 |
1.2 |
0.9 |
|
5 |
12.7 |
1.2 |
1 |
12 |
1.3 |
1 |
|
6 |
12.15 |
1.2 |
0.8 |
11.5 |
1.35 |
0.65 |
|
7 |
10.9 |
1.15 |
1 |
10.1 |
1.2 |
0.9 |
|
8 |
11.65 |
1.45 |
0.4 |
10.75 |
1.5 |
0.8 |
|
9 |
11.9 |
1.25 |
0.95 |
11.2 |
1.3 |
1.05 |
|
10 |
12.65 |
1.2 |
0.9 |
11.55 |
1.25 |
0.7 |
The raw data from loss assessment load tracking as recorded before and after is presented in Table 2. The analysis focuses on overall weight loss of fish and the changes in weight of the broken pieces. It was recorded that 3% of the fish was broken and separated out before packing the cartons (Table 3). Observations indicated that some broken fish were also packed with whole fish. After packing, a carton contained an average of 6.8% of broken fish with a 95% confidence interval of (5.3% to 8.3%).
Weight loss of smoked fish
Figure 1 compares the weight of fish in each carton before and after the journey.
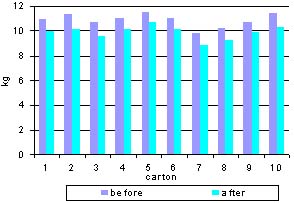
Figure 1. Before/after comparison of fish weight
There is a consistent weight loss in all cartons, with an average weight loss of 0.9 kg (rounded to one decimal place). A paired t-test shows that the weight loss is highly significant with a p-value of less than 0.001. A 95% confidence interval for the weight loss is (0.8 to 1.0) kg, which in terms of percentage of the initial weight of fish is (7.4 to 9.2)%. The % loss has been calculated by dividing the actual losses by the average initial weight of the cartons. The cartons spent in total approximately 87 hours or three and half days on the lorry from loading in Maiduguri to unloading in Lagos inclusive of unforeseen delays both ends.
High ambient temperatures during the experiment may have caused evaporation of moisture and oil as a result of the cartons remaining on the lorry under hot conditions for a prolonged period. However, weight loss, if it is due to evaporation and loss of oil, may not be economically significant, as fish is not sold by weight, but by volume.
Fragments of fish may also have been lost from the carton during loading, unloading and transport. Fragments were lost during re-weighing, but every effort was made to try and minimise this.
Weight loss may also have been due to loss of oil and insect infestation.
Table 3: Losses recorded at each stage of the experiment.
|
Key results |
Estimate |
95% confidence interval |
Comment |
|
Broken fish sorted out before start of load tracking |
3%+ |
- |
Accuracy cannot be quantified because there is no replication for this measurement |
|
Broken fish after packing |
6.8%* |
5.3% to 8.3% |
At the 5% level, the loss was significant |
|
Increase in weight of broken pieces as a result of loading, unloading and transport |
1.2%* |
-0.4% to 2.9% |
At the 5% level, the increase in weight of broken pieces was not significant. Some cartons showed a decrease in the weight of broken pieces. |
|
Decrease in overall weight of fish due to loading, unloading and transport |
8.3%* |
7.4% to 9.2% |
At the 5% level, the loss was significant. Every carton showed a weight decrease. Weight loss could be due to evaporation of water from fish, fragments falling from carton, loss of oil from fish, loss of fragments during re-weighing, insect infestation. |
+ expressed as % total of all the fish.
*
expressed as % of average weight of fish per carton
Carton weight gain
Figure 2. compares the before and after weights of the cartons. The loss for carton 4 may be explained by loss of packaging material during the journey, but amongst the other cartons there is a definite trend of increased carton weight. There is a significant (p-value = 0.018) increase in weight of carton, but with a 95% confidence interval of (0 to 0.1) kg, it is unlikely to have any economic importance.
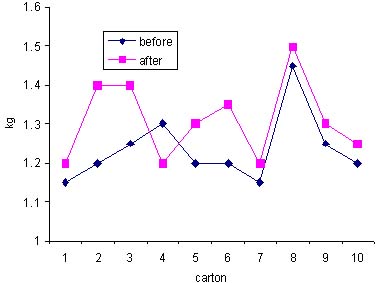
Figure 2. Before and after weight of cartons
Some of the weight loss of the fish is explained by an actual gain in the weight of the cartons, which is probably caused by oil absorbed from the fish into the cardboard packing material. Weight gain may also be due to the carton absorbing water, which has been evaporated from the fish. Nine of the cartons gained weight during the journey, which was probably caused by the cartons absorbing fish oil and moisture. Although this increase was statistically significant at the 5% level it is unlikely to have economic importance as the increases were very small.
Broken fish changes
Figure 3 compares the weight of broken fish before and after the journey, with cartons 1, 2, 3, 4, 8 and 9 showing an increase in broken pieces.
There is an average increase in the weight of broken pieces of 0.1 kg, but this is not a significant increase at the 5% level, having a p-value of 0.12. Expressed as a percentage of the initial weight of fish, the mean increase in broken fish is 1.2% of the initial weight of the fish and an approximate 95% confidence interval for the increase is -0.4% to 2.9%. There is no significant difference between before and after broken fish weight and consequently the confidence interval contains zero. A negative increase actually represents a decrease in the weight of broken fish.
The mean increase in broken fish as a result of loading, transport and unloading is 1.2% of the initial weight of the fish and an approximate 95% confidence interval for the increase is -0.4% to 2.9%. This interval contains 0 because there is no significant increase in broken pieces at the 5% level. The low level of breakage may be as a result of the cartons being fully packed and there being less movement of fish in the carton.
This hypothesis is supported by the fact that there is some indication that cartons with less initial weight of fish have a higher weight increase for broken pieces. However, there is no corresponding trend for the initial weight of the carton and the weight of the actual loss.
The traders in Maiduguri were of the opinion that fully packed cartons of smoked fish, such as those used for this exercise, will contain less broken pieces after transport. Traders also use loosely packed cartons.
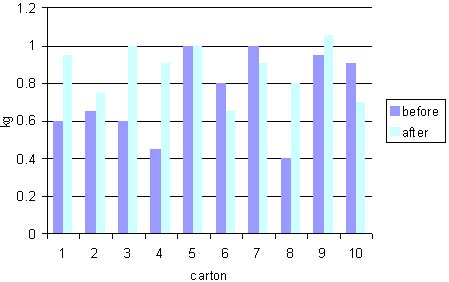
Fig. 3 Before/after comparison of broken fish.
An informal interview with a trader in Lagos during the re-weighing revealed that the traders are aware that the following can reduce breakage during transport:
Fully loading the lorry to reduce general movement of cartons
Arranging cartons on the lorry in a certain way
A driver who brakes carefully and avoids potholes
4. CONCLUSION
Post-harvest losses were recorded at the sorting and packing stages and also during loading, transport and unloading. Two types of losses as a result of loading, transport and un-loading have been recorded:
Actual loss from a carton (physical loss)
Increase in weight of broken pieces (quality loss)
The actual loss of 8.3% (95% confidence interval is 7.4% to 9.2%) is highly significant. This suggests that loading and transport cause significant actual loss in weight. This may be due to:
fragmented fish falling out of the box
evaporation of water from fish
loss of oil
loss of fragments during re-weighing
insect infestation
This exercise has shown that load tracking when combined with replication can give statistically valid estimates for weight changes related to physical and quality loss.
5. REFERENCES
Mills, A. (1979). Handling and processing fish on Lake Chad, 55p. (Unpubl. proj. rep.).
Moes, J.E. (1980). Nigeria. Reduction of spoilage of fish caught in Lake Chad. Project report NIR/74/001/F/01/12. (unpbl. Proj. rep.).
Osuji, F.N.C. (1977). The influence of traditional handling methods on the quality of processed fish in Nigeria. In: Conference proceedings handling, Processing and Marketing of Tropical Fish. TPI, United Kingdom. pp. 319 - 322.
Ward, A.R. and Jeffries, D.J. (2000). Manual for assessing post harvest fisheries losses. NRI, Chatham Maritime, Kent, United Kingdom.
|
[3] Nigerian Institute for
Oceanography and Marine Research, Wilmot Point Road, Bar-Beach, P.M.B.12729,
Victoria Island, Lagos, Nigeria [4] Natural Resources Institute Medway University Campus, Central Avenue, Chatham Maritime, Kent ME4 4TB, United Kingdom [5] Federal Department of Fisheries, Federal Ministry of Agriculture, Water Resources and Rural Development, Maiduguri, Borno State, Nigeria |
![]()
![]()
![]()