


Planted forests database had the following amounts of observations:
Gross and Net Area table |
3,869 |
Planting Rate table |
1,759 |
Production table |
2,885 |
Taxa table |
520 species 48 genera 4 species groups |
Reference Sources table |
397 references |
Besides area information, Gross and Net area table contained also information of tree species planted in particular country without any exact information of the area (1,419 observations).
Gross area observations were available for different classifications:
Gross area |
Total |
Individual species |
SNU |
Ownership |
Purpose |
Countries |
171 |
142 |
30 |
38 |
13 |
Observations |
2,434 |
1,199 |
531 |
215 |
71 |
There were on average 5 observations of gross areas over time on the country level. In 142 countries gross areas were obtained by tree species but the level of information varied considerably. In some countries only two groups were identified (broadleaves, coniferous) while e.g. in Cameroon the gross area of 17 species or genera were given. Gross areas in sub-national units could be found in 30 countries.
Ownership information was available for 38 countries. Purpose of planted forests was given for 13 countries. Usually only industrial/non industrial plantations were separated. It was evident that in many countries the purposes of planted forests were overlapping so that e.g. industrial plantations were used for fuelwood production; fuelwood plantations were serving environmental protection etc.
It was in many cases not possible to distinguish gross areas from net areas. In unclear occasions areas were classified as gross areas. Thus only 61 net area observations were found in 13 countries. In 45 cases also gross areas were available. No trend of gross/net area relationship was possible on such a small amount of observations.
Planting rates were in many cases given by annual figures. To harmonize data from different countries annual planting rates were in most cases summarized to five year totals. The planting rate data at different levels were:
Total |
Countries |
Countries by species |
Countries by SNU |
Countries by Ownership |
Countries by Purpose |
1759 |
83 |
50 |
5 |
8 |
1 |
In some countries, like Australia, New Zealand and Malawi, very detailed information about planting rates was available. It must be recognized that planting rates may include both reforestation and afforestation areas and in most cases these were neither separated nor identified.
Production information was collected as mean annual increments and rotation lengths. In most cases they were given as an average for an individual species grown in a certain country. Data collected provided reliable averages of MAI for 185 species, 94 countries and in 16 countries for sub-national units.
The amount of observations on different levels were:
Mean annual increment |
Total |
General |
Country |
SNU |
Genera |
Species |
Not related to rotation length |
Minimum |
516 |
240 |
202 |
61 |
24 |
478 |
13 |
Average |
2,073 |
51 |
1269 |
258 |
171 |
1,405 |
496 |
Maximum |
978 |
269 |
494 |
158 |
56 |
864 |
56 |
Total |
3,567 |
560 |
1965 |
477 |
251 |
2,747 |
565 |
Most of the observations were related to average MAIs on country and species level. Most uncertain MAIs (i.e. on global level or General) were usually given as minima and maxima. There existed only a few observations on sub-national or genera level. There existed 87 observations where MAIs were expressed as volume increment to certain minimum top diameter and 111 observations given as under bark values. There existed also 565 observations of MAIs that were not related to rotation lengths i.e. they represented mean annual increment values on shorter age than rotation length.
The amounts of observations related to rotation lengths were:
Rotation length |
Total |
General |
Country |
SNU |
Genera |
Species |
Minimum |
234 |
18 |
199 |
17 |
35 |
199 |
Average |
2,069 |
48 |
1186 |
323 |
149 |
912 |
Maximum |
322 |
33 |
257 |
28 |
52 |
266 |
Total |
2,625 |
99 |
1642 |
368 |
236 |
1,377 |
In many cases rotation length value was connected to a particular MAI observation. Most of the rotation length observations were related to individual species or to individual country and were expressed as average rotation length.
Figures from the three consecutive Global Forest Resources Assessment were used as a compilation in analyzing forest plantations development in different countries.
Gross area |
FRA 1980 |
FRA 1990 |
FRA 2000 |
PFDB |
Countries |
104 |
109 |
173 |
141 |
Observations |
214 |
237 |
1,411 |
2,388 |
Most comprehensive FRA data is that of year 2000. PFDB has more observations but the amount of countries is larger in FRA. Together these sources give possibility to compare the development of planted forest resources by country level and globally.
The planted forests database contained gross area information for 171 countries. The elder reported gross planted forest area belongs to Martinique with reference year 1905. Most countries have reported their gross area at year 2000 with average reference year 1992. There gross areas contained information about tree species distribution, ownership and/or purpose of planted forests. Combined with the consecutive FRA assessments 1980, 1990 and 2000, long term trends of country wise gross area development of forest plantations could be drawn.
According to the forest plantation gross area in 2000 (from FRA 2000) countries were divided into different size groups by continents:
Group |
Gross area ('000 ha) |
Large |
>1,000 |
Medium |
100−1,000 |
Small |
10−100 |
Minor |
<10 |
The countries were classified according to their gross area development (or planting rates) into four classes:
Country profile |
Trend of development |
Mark |
Expanding |
Gross area is increasing |
+ |
Stable |
Gross area is not changing |
o |
Decreasing |
Gross area is diminishing |
- |
No data |
Trend not available |
? |
The results of these classifications are presented in details in Appendix 2.
The following trends and comments were drawn from the results:
• Most of the large planted forest countries were located in Asia;
• All the large planted forest countries were expanding in planting area development, i.e. gross area was increasing;
• In Africa many medium planted forest countries were stable (Algeria, Angola, Madagascar, Malawi, Morocco, Rwanda) or even decreasing (Ethiopia, Tanzania, Tunisia) in their planting development;
• Among medium planted forest countries on other continents only Colombia had decreasing planted forest development;
• Some countries in Asia lack planted forest data (former CISs, Republic of Korea, People’s Democratic Republic of Korea);
• Most of the minor planted forest countries were stable or decreasing in their planted forest development that can mean that they did not have suitable areas remaining for planted forests;
• Many countries in which planted forest area development was decreasing, have had serious economic or political problems or civil wars during the last decades; and
• There existed no systematic collection of planted forest area development in FAO for most of the industrialized countries. According to FRA 2000 large European forest plantation countries were Russian Federation 17.3, Ukraine 4.4, United Kingdom 1.9 and Spain 1.9 million ha.
For further gross area analyses mostly PFDB data was used where the last observations of country gross area with tree species distribution were attained between the years 1990 and 2000. This was true for 78 countries having a total gross area of 58.6 million ha and an average reference year 1995. The FRA 1990 gross area for respective countries was 52.1 and that of FRA 2000 77.4 million ha.
Three large forest plantation countries, China, India and Indonesia, had no species wise gross area information between 1990 and 2000. For China there existed no data at all about tree species distribution and also region wise data was very scarce. Only country total gross areas were available for several years (36.8 million ha in 1996). For India the cumulative forest plantation area estimates were given by regions in 1999 (31.2 million ha) but the tree species distribution was available only for public forest plantations in State Forest Departments totalling 15.3 million ha in 1997. For Indonesia a tree species distribution was available only in the state-owned forest enterprise Perum Perhutani on an area of 2.5 million ha for 1997 while the country had already in 1990 a gross forest plantation area of 8.8 million ha.
Detailed information about the global planted forest gross area by species was thus available for a gross area of 10.8 million ha only. According to this information, Pinus radiata was the most common planted tree species reported with 3.80 million ha. 104 individual tree species and 12 genera were mentioned.
Because the total gross area of this analysis was only 19 percent of the total 58.6 million ha considered, the public planted forests of India and Indonesia were added even though they did not represent the countries’ total planted forest areas. This increased the area of detailed information about tree species distribution to 28.2 million ha (Appendix 3). According to the results Tectona grandis was the second most planted species with 2.91 million ha and the following species were Pinus merkusii, 0.90, Acacia nilotica, 0.80, Pinus halepensis, 0.61, Acacia auriculiformis, 0.56, Eucalyptus grandis, 0.48, E. globulus, 0.39, Pinus roxburghii, 0.32 and Dalbergia sissoo, 0.27 million ha (Appendix 3).
A noticeable amount (9.7 million ha) of total analyzed 28.2 million ha remained unspecified by tree species. Besides that, 2.40 was classified as Eucalyptus genera (3.5 for the whole genus), 0.46 as Coniferous and 0.20 million ha as Broadleaves. Thus only 13.9 million ha (49 percent) had exact information about individual tree species gross area.
Another way to analyze the frequency of individual tree species planted was to count the number of countries where individual tree species were used without demanding any area information. 490 individual tree species were recorded thus indicating the huge amount of planted tree species selected for planting (Appendix 4). If the species used in developed countries had recorded, the number would have exceeded much over 500.
Most tree species were used in very few countries: 262 in one country only, 71 in two, 46 in three and 21 in four countries. Thus 90 tree species were mentioned in five or more countries. The most common species was Eucalyptus camaldulensis (67) and among the most popular species there were many other Eucalypt species like E. grandis (37), E. tereticornis (36), E. globulus (26), E. saligna (26), E. citriodora (25) and E. robusta (22 countries). Like the area information, Tectona grandis (50) was one of the most distributed tree species. Pinus caribbaea var. hondurensis (49), Swietania macrophylla (38), Gmelina arborea (34), Casuarina equisetifolia (23), Pinus patula (23), Azadirachta indica (22) and Acacia auriculiformis (21) were used in many countries as planted forest tree species. One of the most widely planted species, Pinus radiata, was found in 17 countries only (Appendix 4).
In FAO Forest Resources Assessments there exist no data of temperate and boreal zone countries’ species wise planted forest areas. Actually the FRA 2000 was the first attempt to determine the forest plantation areas in developed countries although Pandey and Ball (1988) presented area estimations also for developed countries. For Australia (partly sub-tropical) and New Zealand (temperate) the exact tree species distributions were easily available. By including countries like Japan (temperate), 10.7, and Russia (mostly boreal), 17.3 million ha of forest plantations would change the above mentioned picture of tree species distribution. As an example, in Japan alone Cryptomeria japonica has been planted on 4.6 and Chamaecyparis obtusa on 2.5 million ha (Gaston et al. 2000) and in China Cunninghamia lanceolata on perhaps on 6 million ha (area of natural forests and forest plantations together 9 million ha) (Fung 1994).
Rubber tree (Hevea brasiliensis) was considered as a plantation tree species in forest assessments for the first time in FRA 2000. The global estimate for rubber plantations in 2000 was 9.9 million ha (FAO 2001b, Carle et al. 2002). There exist statistics of rubber plantations as early in 1900 and the trend of global rubber plantations gross area is as follows (IRSG 1966, 1995, 2002):
Rubber tree: gross area planted 1910 - 1990
Year |
Gross area ('000 ha) |
1910 |
0,690 |
1920 |
1,800 |
1930 |
3,220 |
1940 |
2,650 |
1950 |
4,420 |
1960 |
4,980 |
1975 |
7,150 |
1980 |
7,590 |
1990 |
9,240 |
In their study about rubberwood as wood supply Balsiger, Bahdon and Whiteman (2000) counted the global rubber plantation area in 1999 noticeably smaller, 7.2 million ha. It is probable that this estimate is more realistic than those made by International Rubber Study Group. In any case, rubberwood is a remarkable source of wood and fiber in many Asian countries like Indonesia (2.3), Malaysia (1.4), Thailand (1.6), China (0.4), Viet Nam (0.4) and India (0.4 million ha).
In Malaysia the area of rubber plantations has decreased clearly during the last decade. In Indonesia and Thailand it has stayed stable but in other large size rubber plantation countries area has still increased.
The International Poplar Commission has recorded poplar (Populus spp.) plantations in 1996 and 2000. In the latest inventories in 1992−2000 the poplar plantation gross area was reported to be 7.1 million ha, based on information from 25 countries (Appendix 5). China alone reported 6 million ha of poplar plantations. Iran, 150,000 ha, and Argentina, 130,000 ha, have noticeable poplar plantations together with the European countries France, 256,000 ha, Italy, 119,000 ha, Hungary, 109,000 ha and Spain, 103,000 ha. 38 poplar species and hybrids were reported together with 11 willow species and hybrids.
Poplar planting has a long tradition. Already in 1965 the estimated plantation area was 780,000 ha, without China (FAO 1967). For example Italy had at that time 205,000 ha and Hungary 100,000 ha of poplar plantations. Generally, the area of poplar plantations has increased during the latest decade and the intensive tree breeding programs have increased greatly their productivity.
Reported willow (Salix spp.) plantation area was only 52,000 ha in 1999. Romania, 24,000 ha and Sweden, 16,000 ha, had the largest reported areas. It is recognised that Russia has vast areas of poplars natural and planted however the data has not been reported.
The planted forests database contained information on planting rates for 83 countries totalling 1759 observations. Detailed planting rates for periods longer than 1 year, but not necessarily including all the species, were provided for 50 countries, 40 developing and 10 developed.
Despite the large number of observations collected, information on planting rates was incomplete for several reasons:
• It was not possible to specify whether annual planting is new planting (afforestation) or replanting (reforestation);
• Very few countries provided details for the species planted;
• Only few a countries were able to provide continuous planting trends;
• Among the 30 largest countries with planted forests area assessed by FRA 2000, nine countries (Russian Federation, Ukraine, United Kingdom, Turkey, Pakistan, France, Portugal, Nigeria, Sudan) had no information on annual planting rates;1
• In many countries planting rates were provided by different sources that varied markedly.
In Africa there existed information on annual planting in PFDB for countries with a total planted forest area of 66 percent of the entire continent. By obtaining planting rates from large planted forest countries Nigeria and Sudan as well as from Burundi, Cameroon, Cap Verde, Ethiopia, Liberia, Mozambique, Rwanda, Tunisia and Zambia the situation in Africa would be clearer.
In Asia the scale of plantings is very big compared to others continents. In the list of the Top 30 planted forest countries 12 of them were in Asia and only for Turkey and Pakistan there existed no planting rate data. Other countries with no planting rate data were Bangladesh, Bhutan, Cambodia, Nepal, Pakistan, Sri Lanka and United Arabic Emirates.
There existed no planting rates for most former CISs like Armenia, Azerbaijan, Georgia, Kazakhstan, Kyrgyzstan, Uzbekistan, Tajikistan and Turkmenistan. Mongolia, Republic of Korea and Dem People's Republic of Korea announced planting rates that were incorporated in PFDB but in FRA 2000 no plantation existed in these countries.
As overall, Asia had information on annual planting for countries with a total planted forest area of 96 percent of the entire continent. Although a large number of countries did not report on annual planting, their area was very low and accounted only for 4 percent of total Asia.
In North and Central America all the countries with reliable planted forest area also reported planting rates. Although Canada according to FRA 2000 did not have any plantations, annual planting areas were available. Also in South America the data about planting rates were extensive covering all countries with planted forests.
In Oceania data were excellent for Australia and New Zealand and also for many small islands. Papua New Guinea was an exception containing no data about planting rates. New Zealand was one of the rare countries that clearly distinguished new and replanting.
In Europe six countries ranked in the Top 30 planted forest countries globally. Unfortunately the information found for European countries was very scarce and only for very few of them it was possible to compile annual planting data in PFDB. The reasons were not the lack of statistics but the inconsistency in the definition of plantations and lack of standardization of methods to compile planted forest information.
Trends in planting rates over time by regions or by countries can serve as good means to extrapolate information on planted forests. Further analyses are needed in order to fill the gaps that exist in planting rate information.
The lack of information for developed countries is due to the traditional mandate of FAO to collect and compile information for developing countries and also to the definitions adopted and created mainly for forest and planted forests in developing countries. It is extremely important to harmonize the definitions of planted forests and plantations. This work is under way (FAO 2002a, b, Carle and Holmgren 2003).
Mean annual increments (MAI) of tree species have been widely used in estimating the productivity of planted forests. A total of 3,567 observations was the basis for productivity estimations in PFDB.
185 species or genera had observations on average mean annual increments but only for 57 species observations exceeded two. 76 individual tree species had both minimum, average and maximum MAI values. When the criterion was laid that at least two observations were needed for each of the values 57 species were reported (Appendix 6).
Albizia falcataria proved to have highest average MAI of all species with 29 m3 ha-1 yr-1 as the average. Among the species with average MAI over 20 m3 ha-1 yr-1 Eucalyptus and Pinus species were most common (E deglupta, E. grandis, E. urophylla, E. regnans, E. saligna, P. pseudostrobus, P. radiata, P. merkusii, P. elliottii and P. patula). Leucaena leucocephala, Acacia magnium, Maesopsis eminii and Gmelina arborea also exceeded the limit of 20 m3 ha-1 yr-1. The valuable hardwood species Dalbergia sissoo (9 m3 ha-1 yr-1), Swietania macrophylla (9 m3 ha-1 yr-1) and Tectona grandis (8 m3 ha-1 yr-1) were among the least productive species when measuring productivity on volume growth only (Appendix 6).
The information of PFDB could be compared to earlier estimations on MAIs. In FRA 2000 main report Carle (FAO 2001b) presented MAI estimates for 27 species. Earlier both Pandey and Ball (1998) and FAO (2000) had presented estimates for 10 species, partly as a basis for global outlook for wood supply from planted forests (Table 1). Other sources for extensive MAI estimates are Webb et al. (1984) and Wadsworth (1997).
In none of these sources the exact determination of MAI estimates was declared. Sources of information were either presented or then estimates were based on expert knowledge only. In PFDB estimates of minimum and maximum MAI average values were used and these values were based on at least two observations for both estimates. It was required that values from different sources built logical ascending series from minimum through average to maximum.
Table 1. Mean annual increment (MAI) of selected tree species according to different sources and Planted forests database (PFDB)
FRA 2000 |
FAO 2000 |
Pandey& |
PFDB |
|
Brown |
Ball 1998 |
|||
Species |
MAI, m3 ha-1 yr-1 |
|||
Acacia auriculiformis |
6−20 |
6.5−10 |
9−18 | |
Acacia magnium |
8−19 |
10−15 |
15−37 | |
Acacia mearnsii |
14−25 |
12−24 | ||
Araucaria angustifolia |
8−24 |
8−16 | ||
Araucaria cunninghamii |
10−18 |
10−24 | ||
Casuarina equisetifolia |
6−20 |
1.5−7.5 |
6−18 | |
Casuarina junghuhniana |
7−11 |
|||
Cordia alliodora |
10−20 |
|||
Cryptomeria japonica |
8 |
|||
Cupressus lusitanica |
8−40 |
8−25 | ||
Dalbergia sissoo |
5−8 |
3−5 |
4−10 | |
Eucalyptus camaldulensis |
15−30 |
10−21 | ||
Eucalyptus deglupta |
14−50 |
17−35 | ||
Eucalyptus globulus |
10−40 |
8−29 | ||
Eucalyptus grandis |
15−50 |
14−35 | ||
Eucalyptus robusta |
10−40 |
11−28 | ||
Eucalyptus saligna |
10−55 |
13−48 | ||
Eucalyptus spp. |
4−25 |
1−20 |
11−31 | |
Eucalyptus urophylla |
20−60 |
20−40 | ||
Gmelina arborea |
12−50 |
12−19 |
16−28 | |
Leucaena leucocephala |
30−55 |
18−42 | ||
Pinus caribaea var. Caribaea |
10−28 |
10−23 | ||
Pinus caribaea var. Hondurensis |
20−50 |
15−22 | ||
Pinus elliottii |
15−25 |
10−24 | ||
Pinus kesiya |
6−10 |
11−21 | ||
Pinus oocarpa |
10−40 |
11 |
10−32 | |
Pinus patula |
8−40 |
15−25 |
11−30 | |
Pinus radiata |
12−35 |
18−24 |
13−26 | |
Pinus taeda |
7 |
12−30 | ||
Swietenia macrophylla |
7−11 |
5−7.5 |
8−13 | |
Tectona grandis |
6−18 |
4−18 |
2−6.3 |
7−13 |
Terminalia ivorensis |
8−17 |
5−12.5 |
8−15 | |
Terminalia superba |
10−14 |
5−12.5 |
10−16 |
It can be noticed from Table 1 that usually FRA 2000 (FAO 2001b) presented higher values for MAI than Pandey and Ball (1998), Brown (FAO 2000) or what was the result in PFDB. This difference can result from different definitions and perhaps FRA’s maximum MAIs represented the absolute maximum growth in ideal circumstances. The lower limits for MAI were rather similar in FRA 2000’s estimates and in PFDB. Brown’s estimates were systematically lower than those of FRA 2000 or in PFDB. Pandey and Ball estimated the growth of Pinus species to be at the same level than values presented in PFDB but other species more conservatively. FRA 2000 presented systematically higher values for Eucalyptus species than PFDB values (Table 1).
The productivity of planted forests varies according to many factors: climate, site and silviculture being the most important factors (Evans 1982). An example of variation in the productivity of planted forest is given in Table 2. FAO presented in the State of the World’s Forests 1997 forest data according to ecofloristic zones (FAO 1997b), which have been used here to illustrate different climatic conditions. It must be noted that by dividing the database information to smaller fractions the accuracy of data becomes weaker.
No conclusions can be drawn from Table 2 as regards the most suitable ecological zones, mostly because of the heterogeneity of the data. Some of the highest increments can be found in Central and Southern Africa thus indicating suitable conditions for many planted forest species. Tropical-Non Tropical comparison is not possible with the data available.
Table 2. Mean annual increment (MAI, m3 ha-1 yr-1) and the number of observations (n) of five tree species on different ecological zones (FAO 1997b)
Tectona |
Swietenia |
Pinus |
Pinus |
Eucalyptus | ||||||
grandis |
macrophylla |
car.var.hond. |
patula |
grandis | ||||||
Region |
MAI |
n |
MAI |
n |
MAI |
n |
MAI |
n |
MAI |
n |
Caribbean |
6 |
17 |
10 |
47 |
14 |
6 |
||||
Central Africa |
14 |
3 |
16 |
2 |
30 |
11 | ||||
Central America and Mexico |
13 |
14 |
5 |
11 |
25 |
2 |
25 |
1 | ||
Continental South East Asia |
9 |
3 |
18 |
2 | ||||||
East Asia |
8 |
4 |
||||||||
East Sahelian Africa |
4 |
3 |
25 |
2 |
20 |
1 | ||||
Insular East Africa |
10 |
1 |
||||||||
Insular South East Asia |
7 |
17 |
10 |
12 |
14 |
2 |
||||
South Asia |
6 |
67 |
7 |
3 |
12 |
4 |
15 |
2 |
32 |
17 |
Southern Africa Non Tropical |
26 |
3 |
21 |
50 |
23 |
23 | ||||
Southern Africa Tropical |
10 |
2 |
18 |
2 |
18 |
11 |
30 |
9 | ||
Temperate Oceania |
18 |
1 |
23 |
1 |
17 |
6 | ||||
Temperate South America |
18 |
1 |
||||||||
Tropical Oceania |
8 |
3 |
7 |
25 |
15 |
8 |
34 |
8 | ||
Tropical South America |
14 |
1 |
15 |
1 |
12 |
9 |
19 |
3 |
35 |
1 |
West Moist Africa |
12 |
39 |
16 |
8 |
16 |
2 | ||||
MAI values are usually dependent on the purpose of the planted forest management. Saw timber is grown on longer rotations with lower mean increment, i.e. lower spacing while pulpwood or fuel wood on shorter rotations and denser spacing and thus higher mean increment. Although the purpose of planted forests was determined in many cases no comparison could be derived from the data between saw timber or pulpwood management or other purposes.
Most of the rotation length observations in PFDB referred to averages (2,069 of 2,625). Therefore reliable minimum and maximum rotation length values could not be derived. Average rotation lengths were available for 166 individual species or genera but more than two observations only for 70 species (Appendix 7). At least ten observations were reported for 27 species; Tectona grandis, Eucalyptus grandis, E. globulus, Pinus caribaea var. hondurensis, P. elliotti, P. kesiya, P. patula, P. pinaster, Swietania macrophylla and Gmelia arborea being the most represented.
The average rotation lengths in PFDB could be compared to the estimates of Pandey and Ball (1998) for eight species. It proved that for Acacia magnium and Tectona grandis the observations in PFDB suggested shorter rotations than what Pandey and Ball had presented. For other species average rotation lengths in PFDB were near the upper limit of Pandey and Ball estimates except for Pinus kesiya that had longer rotation in PFDB.
MAI values could be plotted against rotation lengths. In Appendix 8 some examples are shown for the most representing tree species (more than 30 observations). It proved that especially Gmelina arborea had very sharp growth curve with highest values at short rotation but on the other hand also some observations on very long rotations. Eucalypt species are generally managed on short rotations but E. grandis showed that in some regions it is grown for as long as 50 years. Tectona grandis was reported to have many rotation schemes, short in Central America and long in Asia, from 15 to 80 years. Pinus species had low values at short rotation representing rather slow increment rate at the beginning of rotation period.
One of the main purposes of PFDB is to disseminate information and share it with users through internet and often electronic formats (CD). Therefore information contained must be easily accessed and user friendly.
The concepts above have been taken into consideration in the database design. The software used to implement was Microsoft Access 97 considered as a good compromise version that can run both on the latest Windows platforms, 2000 and XP, but also on former versions as Windows NT4 and Windows 95 or 98. Access is very compatible with the operating system used to develop FORIS.
PFDB is composed by a set of tables that contain data and by two different sets of user interfaces to assist the data entry and to retrieve the information.
The set of tables was grouped in three data entry forms developed to assist the user on entering data.
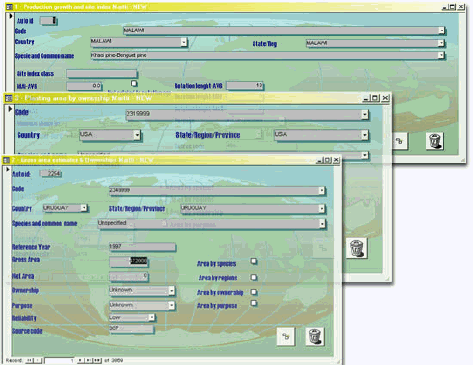
Forms are only available on the PFDB version that runs on Access at FAO Headquarters. In the future they will be converted to FORIS to allow the update of information through the Internet.
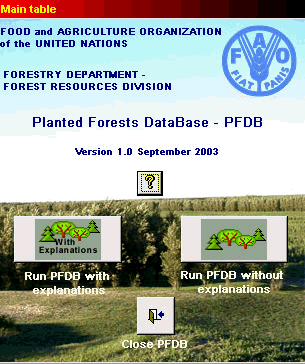
The enquiry forms of PFDB have the purpose to supplement FRA data with relevant information. Particular care was put to provide information related to Mean Annual Increments, Rotation Lengths and Rates of Planting. Latest gross area information is provided by FAO in FRA 2000 and will not be presented in the PFDB.
The database runs in two interfaces: one interface assists users with explanations on data displayed (see picture below as example of explanation for MAI data at country level), another runs without explanations. Explanation forms are also printable and they are the only printing facilities provided by PFDB in this first release.
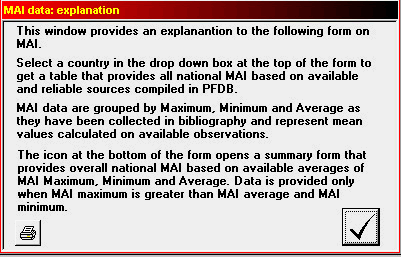
All data provided in the database are the results of data compilation from literature. Therefore they do not provide statistical extrapolations but have to be used for further analysis.
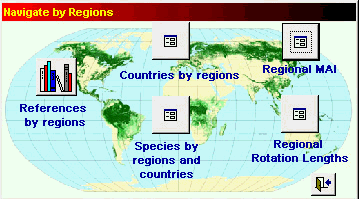
The next data forms allow the user to navigate at three different levels: region, country and species (see figure below)
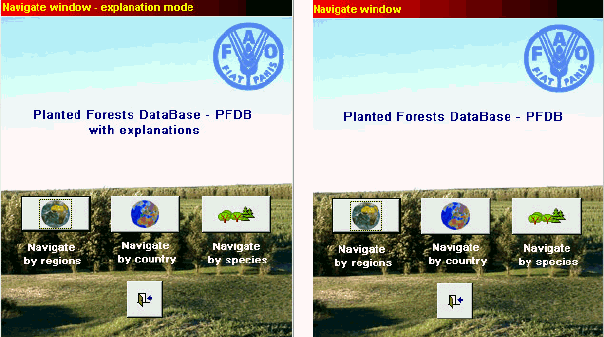
The “Navigate by region” icon allows the user to open the form (see figure below) where data is provided at regional level. PFDB contains the most recent regions endorsed by FAO and lately used for SOFO 97. The list below provides the regions available.
Region Name |
|
1 Caribbean |
11 North Africa |
2 Central Africa |
13 Northern Europe |
3 Central America and Mexico |
14 South Asia |
4 Continental South East Asia |
15 Southern Africa Tropical |
5 East Asia |
16 Temperate North and Central America |
6 East Sahelian Africa |
17 Temperate Oceania |
7 Eastern Europe |
18 Temperate South America |
8 Former USSR |
19 Tropical Oceania |
9 Insular East Africa |
20 Tropical South America |
10 Insular South East Asia |
21 West Moist Africa |
11 Middle East |
22 West Sahelian Africa |
12 Non Tropical Southern Africa |
23 Western Europe |
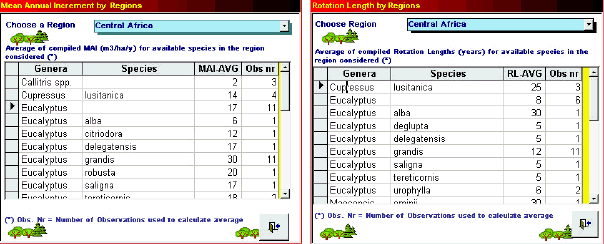
The PFDB provides at regional level the list of countries belonging to each region, the list of species reported and the reliable averages of Mean Annual Increments and Rotation Lengths for all the species found in the given region (see figure below). Another form provides the compilation of all the sources quoted for the given region.
The “Navigate by countries” icon opens the main form containing the queries that provide information at country level (see figure below). This form contains the bulk of information since it provides most of the information available on PFDB.
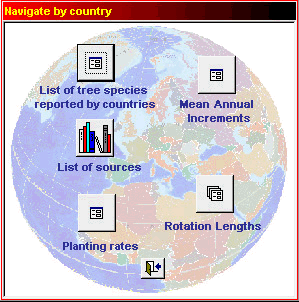
Information on MAIs is provided by three levels:
• “Mean Annual Increments” provides overall averages of Minimum, Maximum and Average MAI for a given country;
• “Mean Annual Increment by species” provides averages of Minimum, Maximum and Average MAI for all species found in a given country; and
• “Mean Annual Increments by Species – Details” provides detailed information for a given country and different species.
Information on Rotation Lengths is provided by three levels:
• “Rotation Lengths” provides overall averages of Minimum, Maximum and Average RL for a given country;
• “Rotation Lengths by Species” provides averages of Minimum, Maximum and Average RL for all species found in a given country; and
• “Rotation Lengths by Species – Details” provides detailed information for a given country and different species.
The form allowing enquiry for annual planting is composed of two tables:
• Overall planted area during a certain period;
• Details for the related species used during the same period.
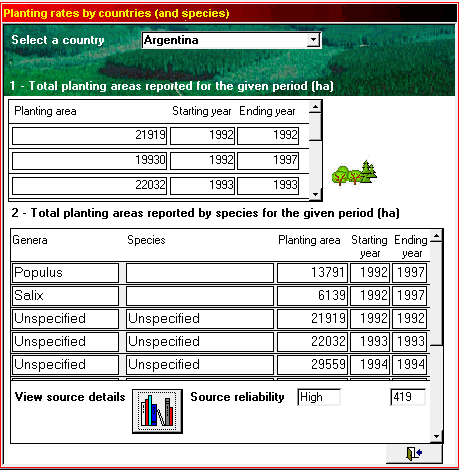
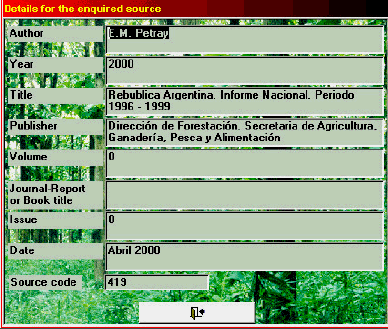
Finally, the form allows access to the source reference documents used as the baseline for data displayed and gives a rating of its reliability as assessed by the reviewers in the small cell named "source reliability" at the bottom of the window. The icon “view source details”, located at the bottom left side of the form, opens a window displaying all reference details for the related data displayed (see below).
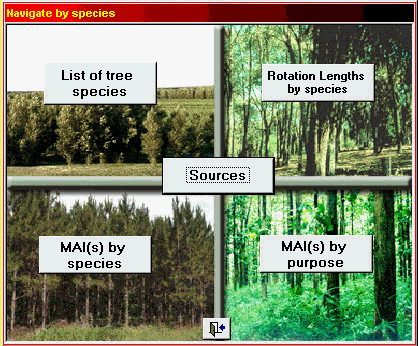
The “navigate by species” icon opens a form that provides information for single tree species. In particular it provides the list of tree species, MAI by species and MAI by species and purpose. It also provides rotation lengths by species and the entire list of references used for all the reported species.
1 Area on plantations for the Top 30 countries, correspond to 93% of the global plantation area reported in FRA 2000.