AQUASTAT - FAO's Global Information System on Water and Agriculture
Australia
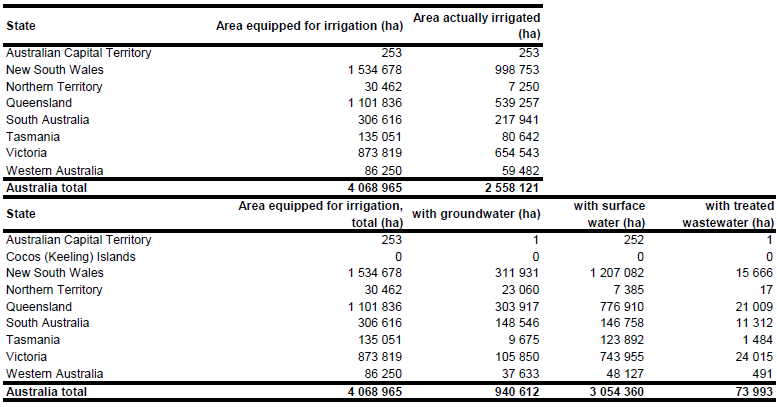
Area equipped for irrigation is not reported in the Australian agricultural or water use statistics. Therefore area equipped for irrigation was estimated based on two independent data sets: area actually irrigated reported by the water use statistics of the Australian Bureau of Statistics [AU01] and irrigated land derived from a remote sensing based land use map of Australia [AU02]. Only a fraction of the area equipped for irrigation is receiving irrigation and the extent of the areas actually irrigated varies significantly from year to year. Area actually irrigated was 2 546 318 ha in season 2005/2006 but declined to 1 760 758 ha in season 2008/2009, mainly as the consequence of a severe drought [AU03]. We used here the statistics related to season 2005/2006 because the area actually irrigated reported for this season represents the maximum within the period 2002-2010. Furthermore, the report related to this season provided statistics for states, statistical divisions, statistical subdivisions and local government areas while statistics related to other years were limited to states or statistical divisions. However, for many local government areas and statistical subdivisions data were suppressed in the census reports to preserve confidentiality which required a combination of the statistics reported for the different administrative levels and aggregation of the “nodata” areas into larger units. Since area actually irrigated was reported in units of 1 000 ha we preferred to compute this area based on the variables “Irrigation volumes applied” and “Irrigation volumes applied per ha” which were reported at higher precision. This resulted in a final data set of area actually irrigated for 691 administrative units and a total area actually irrigated of 2 558 221 ha. Area equipped for irrigation was then computed for the 691 units by combining these statistics to the sum of irrigated land in the Australian land use map [AU02] and by selecting the maximum of both data sources for each of the 691 units. This resulted in a total area equipped for irrigation of 4 068 965 ha. The irrigated areas by state are shown in the Table below. The irrigated areas both by state and by statistical division can be downloaded as Australia irrigation areas in PDF or Australia irrigation areas in Excel (two sheets).
Areas equipped for irrigation were assigned to specific cells within the sub-national units by combining three data sets by using the priorities documented below (Table 1). The highest priority was given to areas derived from the Australian land use map [AU02] belonging to the following classes: 3.3.5 Sugar, 3.3.6 Cotton, 3.4.1 Tree fruits, 3.4.4 Vine fruits, 3.5.4 Vegetables & herbs, 4.2.0 Irrigated modified pastures, 4.3.0 Irrigated cropping, 4.3.1 Irrigated cereals, 4.3.3 Irrigated hay & silage, 4.3.4 Irrigated oil seeds, 4.3.5 Irrigated sugar, 4.3.6 Irrigated cotton, 4.3.8 Irrigated legumes, 4.4.0 Irrigated perennial horticulture, 4.4.1 Irrigated tree fruits, 4.4.3 Irrigated tree nuts, 4.4.4 Irrigated vine fruits, 4.5.4 Irrigated vegetables & herbs, 5.4.1 Shadehouses, 5.4.3 Glasshouses (hydroponic). Then, with the next priority, we considered areas classified by the MODIS land cover [AU04] as cropland or cropland/natural vegetation mosaic (priority 7) or grasslands (priority 6) and located inside polygons showing the extent of major irrigation areas in Australia [AU05]. Finally, if required, area equipped for irrigation was also assigned to grid cells belonging to these MODIS land cover classes and located outside the extent of the major irrigation areas. Irrigated area was first distributed only to cells having priority 8, then to cells having priority 7 and so on until the sum of the distributed irrigated area was equal to the irrigated area reported for the related subnational administrative unit.
The distinction of area equipped for irrigation in areas irrigated with groundwater, surface water or with non-conventional water sources was based on the water use statistics for season 2006/2006 [AU01] that reported water uses from “surface water”, “groundwater”, “town or country reticulated mains supply”, “recycled or re-used water from off farm sources” and “others”. We assumed that the fraction of groundwater in “town or country reticulated mains supply” is similar to the ratio between “groundwater” and the sum of “surface water” and “groundwater” while “recycled or re-used water from off farm sources” and “others” were assumed to represent non-conventional water sources. The ratio of areas equipped for irrigation from the different sources of water was assumed to be similar to the ratio of the irrigation water use volumes reported in the water use census.
References
[AU01]: ABS, 2008. Water use on Australian farms, 2005-06. Australian Bureau of Statistics (ABS), cat. no. 4618.0, http://www.abs.gov.au/AUSSTATS/abs@.nsf/allprimarymainfeatures/ 902502BE6F61594CCA2574B100160196?opendocument, 06/06/2011.
[AU02]: BRS, 2010. 2001/2002 Land Use of Australia, Version 3. National Land and Water Resources Audit, Bureau of Rural Sciences (BRS), Commonwealth of Australia, http://adl.brs.gov.au/mapserv/landuse/index.cfm?fa=app.loaddata&tab=loaddata, 07/06/2010.
[AU03]: ABS, 2011. Water use on Australian farms, 2009-10. Australian Bureau of Statistics (ABS), cat. no. 4618.0, http://www.abs.gov.au/AUSSTATS/abs@.nsf/allprimarymainfeatures/ A5A4DA2DF9F997A0CA2571AD007DDFD4?opendocument, 06/06/2011.
[AU04]: Modis Land Cover Group, 2009. Modis Global Land Cover. Department of Geography and Environment, Boston University. ftp://crsftp.bu.edu/modis/MOD12Q1_data/, 07/06/2010.
[AU05]: BRS, 2001. Australian Irrigation Areas Version 1a. National Land and Water Resources Audit, compiled by Bureau of Rural Sciences (BRS) from data supplied by Agriculture WA, Queensland Department of Natural Resources and Mines, Murray-Darling Basin Commission, NSW Department of Land and Water Conservation and Tasmanian Department of Primary Industries, Water and Environment. BRS, Commonwealth of Australia, 2001a. http://adl.brs.gov.au/anrdl/metadata\_files/pa\_aia\_\_r9ab\_\_00211a02.xml, 07/06/2010.


