AQUASTAT - FAO's Global Information System on Water and Agriculture
Brazil
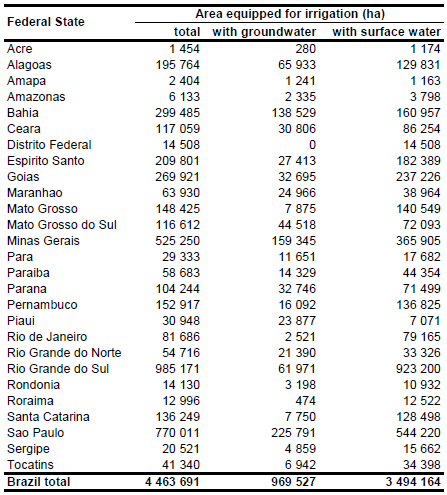
Area equipped for irrigation was derived from the agricultural census report 2006 and added up to 4 463 691 ha [BR01]. The census report provided data for 5 566 municipalities. However, data for 474 municipalities were suppressed in the census report to preserve confidentiality which required an aggregation of the “nodata” areas into larger units (248 micro-regions and 3 meso-regions). Area equipped for irrigation in these aggregated no-data regions was then computed as difference between total area equipped for irrigation reported for the whole micro- or meso-region and the sum of equipped for irrigation in municipalities for which data were reported. This finally resulted in 5 341 subnational units for Brazil. The irrigated areas by state are shown in the Table below. The irrigated areas both by state and by municipalities can be downloaded as Brazil irrigation areas in PDF or Brazil irrigation areas in Excel (two sheets).
Irrigated area was first assigned to irrigation schemes as digitized from several irrigation maps ([BR02] – [BR11]). The remaining irrigated area was assigned to cells classified on the GLC2000 land cover map for South America [BR12] as agriculture (intensive) or mosaics of agriculture and other land uses.
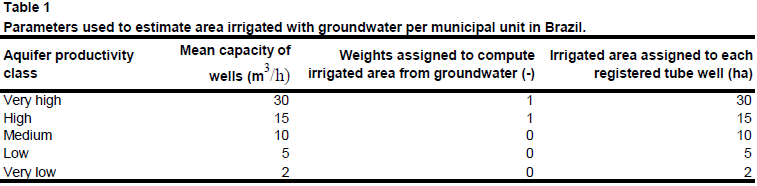
Sub-national irrigation statistics available for Brazil do not distinguish the source of water supply for irrigation [BR13]. To estimate the percentage of irrigation areas supplied by groundwater we used therefore an inventory of wells used for irrigation [BR14] and reports showing the extent and describing the characteristics of the major aquifers of Brazil (BR15], [BR16]). The extent of the aquifers was digitized from the maps contained in these reports. The aquifers were classified into 5 groups depending on the reported mean capacity of wells fed by the aquifers (Table 1). For each county the sum of AEI covering these aquifers was computed and then, considering the weights shown in Table 1, the potential sum of AEI irrigated with groundwater, respectively. Next, for each county a sum of potential groundwater irrigation area defined by existing wells was computed. 6 841 registered wells that were reported to be used for irrigation were considered and to each well an irrigation area depending on the aquifer in which the well was located was assigned (Table 1). The total potential groundwater irrigation area computed based on the coverage by major aquifers was 934 051 ha and the area computed based on the number and location of tube wells was 83 956 ha. Finally, we computed for each county the sum of both potential groundwater irrigation areas and limited this sum to be not larger than the total AEI reported in the agricultural census 2006 [BR01]. Total AEI from groundwater computed that way was 969 527 ha (22 percent of total AEI) and thus close to the area reported by AQUASTAT for year 1998 (19 percent of total AEI).
References
[BR01]: IBGE. 2006. Censo Agropecuario 2006. Online publication, http://www.ibge.gov.br/home/download/estatistica.shtm, 24/01/2012.
[BR02]: CODEVASF. 1999. Mapa da irrigacao publica - perimetros irrigados do Vale do Rio Sao Francisco. Maps available online at: http://www.codevasf.gov.br, 12/10/1999.
[BR03]: Ministerio da Agricultura. 1979. Aptidao agricola das terras do Ceara.
[BR04]: Ministerio da Agricultura. 1979. Aptidao agricola das terras do Rio Grande do Norte.
[BR05]: Ministerio da Agricultura. 1979. Aptidao agricola das terras do Rio Grande do Norte.
[BR06]: Ministerio da Agricultura. 1979. Aptidao agricola das terras do Paraiba.
[BR07]: Ministerio da Agricultura. 1979. Aptidao agricola das terras do Pernambuco.
[BR08]: Ministerio da Agricultura. 1979. Aptidao agricola das terras do Bahia.
[BR09]: Ministerio da Agricultura. 1979. Aptidao agricola das terras do Alagoas.
[BR10]: Ministerio da Agricultura. 1979. Aptidao agricola das terras do Sergipe.
[BR11]: Ministerio da Agricultura. 1979. Aptidao agricola das terras do Rio Grande do Sul.
[BR12]: Eva, H.D., de Miranda, E.E., Di Bella, C.M., Gond, V., Huber, O., Sgrenzaroli, M., Jones, S., Coutinho, A., Dorado, A., Guimarães, M., Elvidge, C., Achard, F., Belward, A.S., Bartholomé, S., Baraldi, A., De Grandi, G., Vogt, P., Fritz, S. & Hartley, A. 2003. The land cover map for South America in the year 2000. GLC2000 database, European Commision Joint Research Centre, available at http://www-gem.jrc.it/glc2000, 10/08/2006.
[BR13]: ANA. 2005a. Disponibilidade e demandas de recursos hídricos no Brasil. Agência Nacional de Águas (ANA), Brasília – DF, Brazil, http://www.ana.gov.br/pnrh\_novo/ Tela_Apresentacao.htm, 13/08/2009.
[BR14]: Serviço Geológico do Brasil. 2009. Sistema de Informações de Águas Subterrâneas (SIAGAS). Serviço Geológico do Brasil (CPRM), http://siagas.cprm.gov.br/ wellshow/indice.asp?w=&h=, 14/04/2009.
[BR15]: ANA. 2005b. Atlas Nordeste - Abastecimento Urbano de Água. Agência Nacional de Águas (ANA), Brasília – DF, Brazil, http://atlas\_nordeste.ana.gov.br/atlas\_nordeste/, 13/08/2009.
[BR16]: Ministério do Meio Ambiente. 2006. Plano Nacional de Recursos Hídricos (PNRH). Cadernos Regionais. Ministério do Meio Ambiente, Instituto do Meio Ambiente e dos Recursos Naturais Renováveis, http://pnrh.cnrh-srh.gov.br/, 13/08/2009.


