AQUASTAT - FAO's Global Information System on Water and Agriculture
India
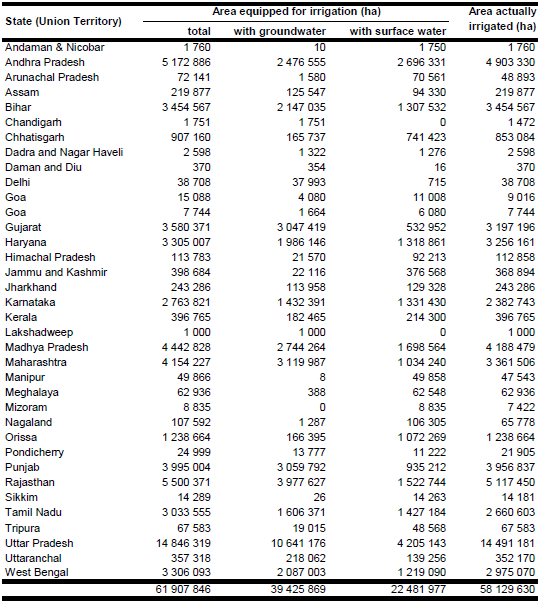
Data on the extent of area equipped for irrigation is not collected by statistical surveys in India. Therefore, statistics on the Net Irrigated Area (NIA) provided by the reports and data bases of the Agricultural Census 2000/2001 of the Ministry of Agriculture [IN01], the Input Survey 2001/2002 of the Ministry of Agriculture [IN02], and the Minor Irrigation Census 2000/2001 of the Ministry of Water Resources [IN03] were used to estimate AEI. NIA does not account for AEI that was left fallow or was completely rainfed in the year of the statistics. NIA is therefore likely to be lower than the AEI. AEI per district was computed as the maximum of NIA reported by the three inventories aforementioned resulting in a total sum of 61 907 846 ha. The irrigated area by state is visible in the table below and the irrigtaed area both by state and by district can be downloaded as India irrigation areas in PDF or India irrigation areas in Excel (two sheets).
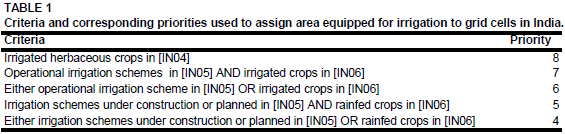
In the northern part of India, irrigated areas were assigned to pixels classified as irrigated in the Himalaya land cover classification [IN04]. In addition, irrigated areas were digitized from a hydrological atlas published in 2005 [IN05] showing the outlines of the large-scale irrigation schemes of the country and distinguishing between existing schemes, schemes under construction and proposed schemes. In addition, the location of minor irrigation schemes is shown in the irrigation atlas in dot-map form, whereby each dot represents 4 000 ha of irrigated area outside the major irrigation schemes. These areas were digitized by enclosing areas closed by dots on the map. The digitized irrigation areas were then combined with the Globcover landcover classification product for Central Asia [IN06] using the priorities shown in Table 1.
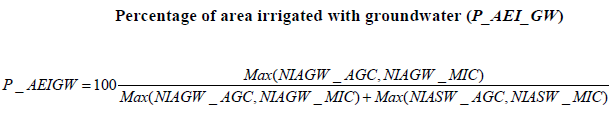
The percentage of area irrigated with groundwater was computed by using the agricultural census statistics and the minor irrigation census statistics because these inventories also reported the source of irrigation water. In general, percentage of area irrigated with groundwater (P_AEI_GW) was computed as shown in the formula below, where NIAGW_AGC was the NIA irrigated with groundwater according to the Agricultural Census (ha) , NIAGW_MIC was the NIA irrigated with groundwater according to the Minor Irrigation Census (ha) and NIASW_AGC and NIASW_MIC were the corresponding net irrigated areas irrigated with surface water as reported by the two census data bases (ha).
Exceptions from this general procedure (mainly caused by missing data) are documented below by federal state:
Andaman and Nicobar Islands:
Only Minor Irrigation Census data was used.
Arunachal Pradesh:
Data from the Minor Irrigation Census was used because in the agricultural census data base most of the NIA was assigned to "other sources", it was assumed that "Major/medium schemes" in MIC represent surface water sources (862 ha of 39 958 ha total NIA).
Bihar:
In the agricultural census data base there was no data, therefore another inventory reporting NIA for season 1993/1994 [IN07] was used as second data source.
Daman and Diu:
Because of missing data in the Minor Irrigation Census, only the Agricultural Census data base was used.
Jharkhand:
In the agricultural census data base there was no data, therefore another inventory reporting NIA for season 1993/1994 [IN07] was used as second data source.
Lakshadweep:
It was assumed that all irrigation is from groundwater.
Meghalaya:
In the agricultural census data base there was no data, therefore the Minor Irrigation Census was used as the only data source.
Uttar Pradesh:
The percentage of AEI irrigated with groundwater was computed by assuming that all areas reported in category "others" refer to irrigation from surface water to account for the specific relevance of water extractions from rivers and reservoirs in some districts of the state.
Total area equipped for irrigation with groundwater computed that way for India was 39 425 869 ha (63.7 percent of total AEI) while 22 481 977 ha (36.3 percent of total AEI) were irrigated with surface water. AAI was computed for each district as maximum of net irrigated area reported by the Agricultural Census Database or the Minor Irrigation Census and neglected therefore the statistics collected by the Input survey in period 2001/02. Total AAI estimated that way for year 2001 was 58 129 630 ha.
References
[IN01]: Ministry of Agriculture. 2009. Agricultural Census Database. Government of India, Ministry of Agriculture, Agricultural Census Division, http://agcensus.dacnet.nic.in/, 05/06/2012.
[IN02]: Ministry of Agriculture. 2009. Input Survey Database 2001-02. Government of India, Ministry of Agriculture, Agricultural Census Division, http://inputsurvey.dacnet.nic.in/, 05/06/2012.
[IN03]: Ministry of Water Resources. 2005. 3rd census of minor irrigation schemes. Ministry of water Resources, New Delhi, India, http://mowr.gov.in/micensus/mi3census/index.htm, 05/06/2012.
[IN04]: FAO. 2010. Land Cover of Himalaya Region. FAO, Rome, Italy, http://www.fao.org/geonetwork/srv/en/main.home?uuid=46d3c2ef-72c3-4f96-8e32-40723cd1847b, 28/01/2010.
[IN05]: Nag, P. (ed). 2005. Hydrological atlas of India. National Atlas & Thematic Mapping Organisation, Department of Science & Technology, Government of India, Kolkata, India.
[IN06]: POSTEL. 2008. GLOBCOVER landcover classification, Version 2.2, Central Asia. Globcover database. http://toyo.mediasfrance.org/?GLOBCOVER, 24/03/2009.
[IN07]: Government of Bihar. 1996. District-wise Net Area Irrigated by canals, tanks, tube-wells and other sources in Bihar (1991-92 to 1993-94). Government of Bihar, Agricultural Department, http://www.indiaagristat.com, 14/07/2004.


