AQUASTAT - FAO's Global Information System on Water and Agriculture
Jordan
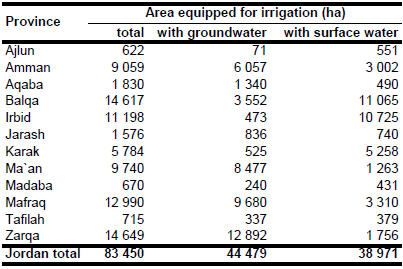
The area equipped for irrigation increased from 64 300 ha in 1990 [JO01] to 78 860 ha in 2004 [JO02] and 83 450 ha in year 2006 [JO03]. Irrigated area per province was extracted from the report of the Agricultural Census 2007 [JO04]. However, total irrigated area reported by the agricultural census (125 870 ha) was larger than the area reported in the aforementioned statistics, while total cultivated area was similar. One reason maybe that the limited availability of water resources was not reflected in these statistics. Therefore total AEI was scaled to 83 450 ha reported by the Department of Statistics for year 2006 [JO03]. The irrigated area per province is visible in the table below and also can be downloaded as Jordan irrigation areas in PDF or Jordan irrigation areas in Excel.
The irrigated areas were localized using an irrigation map of the Jordan Valley and a map showing irrigated areas outside the Jordan Valley [JO05]. The irrigation schemes were then digitized using satellite imagery [JO06]. The extent of the areas digitized that way in the four northern provinces Ajlun, Irbid, Jarash and Mafraq was smaller than the AEI reported by the statistics. Therefore, the remaining AEI was assigned in these provinces to areas classified as rainfed cropland in the regional Globcover landcover classification for North Africa [JO07].
The percentage of area irrigated with groundwater was extracted for each province from the report of the agricultural census 2007 [JO04]. Total area equipped for irrigation with groundwater calculated this way was 44 479 ha or 53 percent of the total AEI and thus similar to the percentage reported in the FAO Aquastat country report [JO02]. In contrast, AEI irrigated with a mixture of treated wastewater and surface water was 15.9 percent according to FAO [JO02] but 0 according to the agricultural census database [JO04]. The reason for this difference could be that treated waste water is released into rivers and the mixed water is later extracted downstream by the farmers for irrigation [JO02]. Therefore it is very likely that farmers consider the part of treated waste water extracted from the river or reservoir as surface water. Area actually irrigated was 72 009 ha or 91 percent of AEI in year 2004 [JO02]. The same ratio between AAI and AEI was used to estimate AAI in year 2006.
References
[JO01]: Department of Statistics. 1991. Statistical yearbook 1991. Amman, Jordan.
[JO02]: FAO. 2012. AQUASTAT country profile of Jordan, version 2008. FAO, Rome, Italy.
[JO03]: Department of Statistics. 2009. Crop statistics: Irrigated and non-irrigated areas. Department of Statistics (DOS), Amman, Jordan, http://www.dos.gov.jo/owa-user/owa/ FOCAL_AGR.agr_kk?LANG=E&dis=0, 20/08/2009.
[JO04]: Department of Statistics. 2010. The agricultural census 2007. Department of Statistics (DOS), Amman, Jordan, http://www.dos.gov.jo/agr/agr\_e/index.htm, 10/12/2012.
[JO05]: World Bank. 1988. Jordan water resources sector study. World Bank, Infrastructure Operations Division, report No. 7099-JO, Washington, DC.
[JO06]: Earth Satellite Corporation. 2004. Landsat GeoCover (2000/ETM+) Edition Mosaics, tiles 071-271, 071-272, 071-286 and 071-287. Sioux Falls, USA, USGS, http://glcfapp.umiacs.umd.edu:8080.
[JO07]: POSTEL. 2008. GLOBCOVER landcover classification, Version 2.2, North Africa. Globcover database. http://toyo.mediasfrance.org/?GLOBCOVER, 24/03/2009.


