AQUASTAT - FAO's Global Information System on Water and Agriculture
Methodology
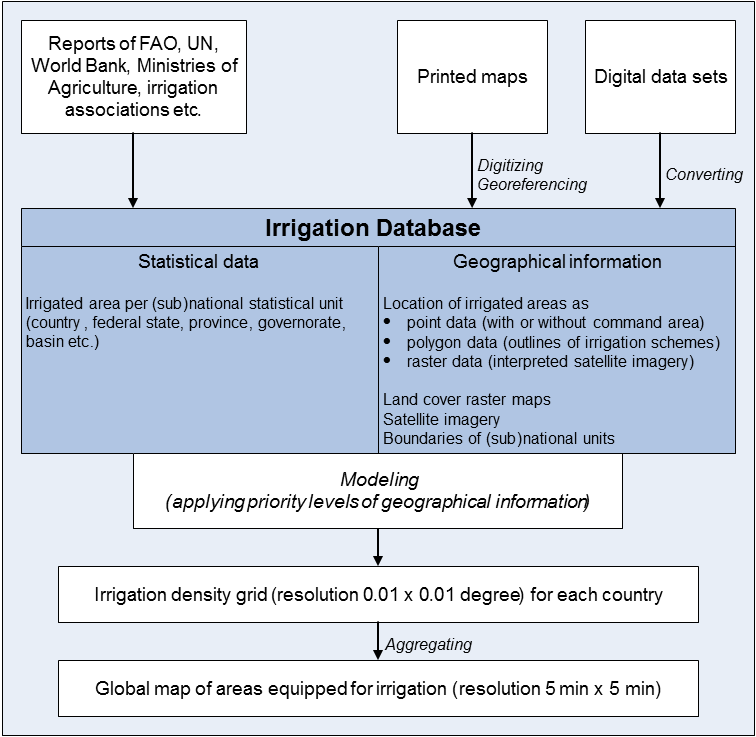
Mapping of area equipped for irrigation
The data layer on area equipped for irrigation was developed by combining sub-national irrigation statistics with geospatial information on the position and extent of irrigation schemes to compute the fraction of 5 arc minute cells that was equipped for irrigation, which is called irrigation density. The figure below gives a schematic overview of the methodology:
In the following, we provide a concise description of the mapping methodology. A detailed description is given in Siebert et al. (2005).
Irrigation statistics for sub-national units (e.g. districts, counties, provinces, governorates, river basins), from national census surveys and from reports available at FAO, World Bank and other international organizations, are being collected on a continuous basis. For most of the countries, these statistics refer to the area equipped for irrigation. Due to several reasons (e.g. crop rotation, water shortages, and damage of infrastructure) the area actually irrigated maybe significantly lower than the area equipped for irrigation. However, some countries only report the area that was actually irrigated in the year of the census. Statistics for the year closest to 2005 were used if statistics for more than one year were available. For countries, where the irrigation statistics reported by the AQUASTAT database were assumed to be more representative, the collected subnational statistics were scaled so that the sum of the irrigated area equals the area equipped for irrigation as given by AQUASTAT at the country level.
In order to distribute irrigated area within the sub-national units, geospatial information on position and extent of irrigated areas was derived by digitizing hundreds of irrigation maps available in reports of FAO, World Bank, irrigation associations or national ministries of agriculture. Additionally, information from several atlases or inventories based on remote sensing available in digital format was utilized. For most of the countries, more than one data source was used.
As the relevance and reliability of the maps varies, it was necessary to decide which geospatial record should be used in a specific sub-national unit. This was realized by applying a priority level to each record. Only if the extent of all digitized irrigated areas with the highest priority level was smaller than the total irrigated area reported for the specific sub-national unit, also records with the second highest priority were considered. This distribution process was repeated down to the next lower priority level until the sum of irrigated area in the map was equal to the irrigated area in the sub-national statistics. Several different criteria have been used to assign priorities to geospatial information, for example:
- the scale and publishing date of the maps;
- the type of map (simple sketch or drawing to scale);
- how the background information for the maps was collected (by ground-based mapping, survey or via remote sensing);
- if only the position or also the extent of the irrigation schemes was provided.
In many sub-national units, lack of geospatial information on irrigation made it necessary to use indirect information to infer areas within the sub-national unit where irrigation is probable. Such information includes areas where the main irrigated crops are grown, or cultivated areas in very arid regions. For arid regions, remote sensing data were additionally used to verify the available maps. If no direct or indirect information about the spatial distribution of irrigation within a sub-national unit was available, irrigated area was distributed according to one of two global landcover datasets (USGS-GLCC-2.0 and JRC-GLC2000
Mapping of area actually irrigated, area equipped for irrigation with groundwater, with surface water and with non-conventional sources of water
Statistics on area equipped for irrigation with groundwater, with surface water or with water derived from non-conventional sources and on area actually irrigated were collected from national census reports or online data bases and complemented with country information available from the FAO-AQUASTAT library, data collected by other international organizations or statistical services (e.g. Eurostat) or data taken from the literature.
In many countries different ministries are responsible to collect, process, and provide data on area equipped for irrigation, area actually irrigated or on the water source for irrigation resulting in different reference years and different resolution of the statistics. We used the following rules for the selection of statistics used for this data set and to fill data gaps:
- Statistics provided at high resolution, for the most recent reference year and using similar definitions were preferred unless proved wrong.
- If statistics on the source of irrigation water were available for area actually irrigated only, then the fraction of area equipped for irrigation with water from the different sources was assumed to be similar to the fraction of area actually irrigated with water from the different sources.
- If the extent of area equipped for irrigation with water from the different sources was unknown but irrigation water use from different sources was reported, then the water use statistics were used to downscale the irrigated area statistics (for example, if 20 percent of irrigation water use was from groundwater, then it was assumed that also 20 percent of area equipped for irrigation was irrigated with groundwater).
- If for specific countries the source of irrigation water was unknown and water use statistics were not available as well, the percentage of AEI irrigated with groundwater, surface water or non-conventional sources was estimated based on other information, e.g. qualitative estimates in the literature, based on borehole inventories or based on the availability of water resources.
- Areas with conjunctive use of groundwater and surface water were assigned with 50 percent to area equipped for irrigation with groundwater and 50 percent to area equipped for irrigation with surface water if not otherwise noted.
- If statistics on area actually irrigated or on the source of irrigation water were available for more than one year, then mean values for periods of up to five years around year 2005 were computed to reduce the impact of specific conditions in specific years.
For most of the countries the data reported at the level of subnational administrative units were not further disaggregated (except of a few countries for which borehole inventories were used). This results in equal values of the percentage of area actually irrigated or the percentage of the different water sources for all pixels belonging to the same subnational administrative unit.


