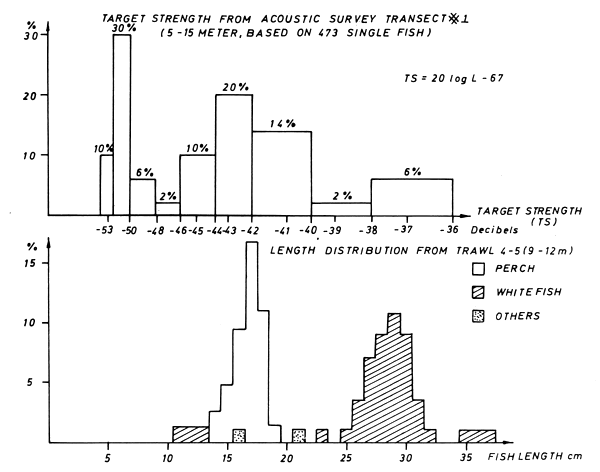
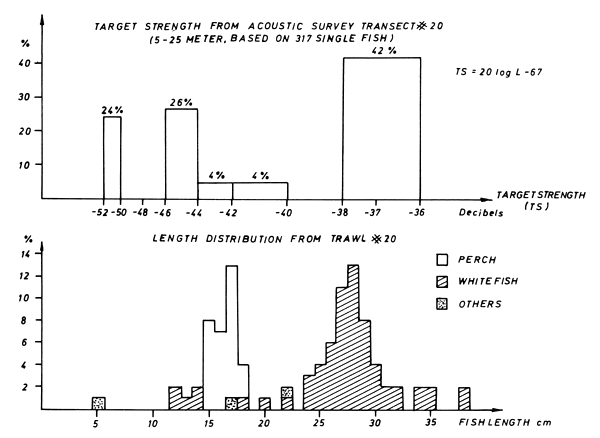
A total of 5539 P. fluviatilis, 223 C. lavaretus and 363 others were caught (Table 1). Practically all perch (99.8 %) belong to age group I (two summers old X = 15.8 ± 1.1 cm). Of the C. lavaretus, 7% are allocated to AG O (X = 12.6 ± 2.1 cm), about 83 % to AG I (X near 28 cm), and about 10% to AG II (AG I + II : X = 28.7 ± 3.0 cm). Most of the 244 R. rutilus (X = 14.8 ± 1.8 cm) and 39 L. leuciscus (X = 17.3 ± 2.4 cm) belong to AG I.
Perch of the age groups (AG) II – III, whitefish of age II, and Cyprinids of AG I, which constitute the bulk of the fish in the commercial catches, are more or less missing in the trawl hauls. This indicates some net selection towards AG I.
With respect to numbers of fish caught, no significant difference between the two types of trawl was detected within the restricted material. If, irrespective to trawling depth and region, all directly measured perch from the C.V.T. are compared with the combined Y.F.T.-perch, there is also no difference in mean or variance of perch size. Numbers of whitefish were too low for Y.F.T./C.V.T.-comparison. Seventy-five per cent of the 16 white-fish measuring 10 – 18 cm, 88% of the 191 ones from 22 to 33 cm, and all of the larger ones were caught with deep C.V.T.s but, as in the following case, it remains uncertain whether this is an effect of trawling depth and/or type of gear. The R. rutilus of the (deep) C.V.T.s of the eastern bight were significantly larger (X = 15.2 cm ± 1.7 cm; X = 14.7 ± 1.8 cm) than those of the (surface -) Y.F.T.s of the same region.
Contrary to P. fluviatilis and “others”, most C. lavaretus were caught offshore (Table 2). Additionally, highest numbers of perch and “others” were trawled in the most eastern part of the lake, and low numbers of whitefish were collected in the western region. Figure 3, on whitefish, is given as an example. The corresponding figure 4 from the hydroacoustic survey differs in tracing a maximum of whitefish in the most eastern region. Similar east-west gradients of densities of whitefish, perch and others are found in the regional catches of the professional fishermen (Hartmann, 1984). 98% of the R. rutilus were caught in the most eastern part (haul nos. 11 – 16).

FIG. 2a

FIG. 2b
Figures 2a and 2b Percentage length-frequency histograms from trawl hauls and acoustic survey. Percentages below 0.8 % not drawn. Echos beyond - 37 dB are shifted down into the (- 37, - 38) dB size group

Figure 3 Numbers of trawled whitefish. The squares are calculated as fronts of cubes. □ = trawling deeper than 8 m◊ = trawling not deeper than 8 m. O = no whitefish caught in a trawl not deeper than 8 m. Scale: largest figure represents 1 fish/1000 m3 water

Figure 4 Numbers of whitefish from the echo survey. Water layers for which the fish densities are calculated, from west to east: 10 – 40 m, 3 – 25 m, 5 – 25 m, 10 – 25 m. For more explanation see figure 3
There is no indication that the lengths of caught perch and whitefish correlate with water depth. Sizes of trawled perch and whitefish decreased from west to east, which is explainable by density-dependent growth or density-dependent sampling bias. A similar observation is reported by a local fisherman (Bilgeri, 1948).
Table 2
Horizontal distribution of the fishes according to catches
| Depth of water m | Coregonus sp. n | P. fluviatilis n | Others n |
| ≤ = 50 | 0.09 ± 0.07 | 6.26 ± 6.57 | 0.32 ± 0.25 |
| > 50 – 150 | 0.22 ± 0.13 | 28.21 ± 55.82 | 1.33 ± 2.01 |
| ≥ = 200 | 0.29 ± 0.41 | 0.16 ± 0.21 | 0.01 ± 0.02 |
Note: Each number averages the catch (fishes/1000 m3 water) of two
surface hauls and three deep
hauls. Paired hauls are treated
as one